

Goldman Sachs derivatives strategist Brian Garrett said seven market “repair” signals have started to emerge in U.S. equities after a volatile October, arguing that positioning and sentiment now offer a contrarian case for buying. He added a clear caveat in the same note: “We just need to get through 2026 first.”
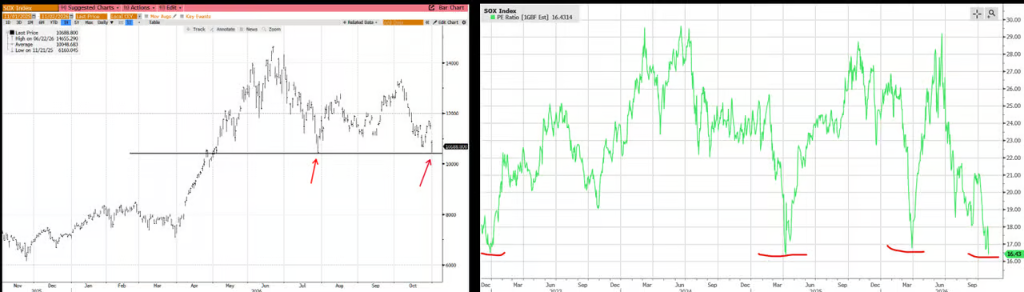
The Nasdaq 100 fell about 7% in October, its second-worst month since the AI rally began in 2023, and entered its third correction of the year. Chip stocks dropped 7% to 8% in a single session on Friday, marking their third-worst one-day relative decline in more than 15 years. The Philadelphia Semiconductor Index also broke below its 200-day moving average on Friday after holding above that level for 355 straight trading days, and it is now testing its July low. The S&P 500 fell 0.6% for the week and closed at 7,580.
Garrett wrote that while spot prices remain under pressure, “some contrarian indicators are emerging, suggesting the current move may have elements of a repair phase.” Goldman Prime Brokerage data showed hedge fund net exposure has dropped to levels that historically line up with drawdowns of more than 20%, even though the S&P 500 is only about 3% below its all-time high. In his view, that gap is itself a contrarian signal.
Semiconductors break a long streak as valuations return to AI-cycle lows
Goldman TMT specialist Peter Callahan said the Philadelphia Semiconductor Index closed below its 200-day moving average on Friday, ending a 355-session streak above that line. That was the third-longest such run in the past decade. The index is now revisiting its July low, while forward price-to-earnings multiples for the semiconductor group have fallen to about 16x, back to the valuation low of the current AI cycle.
Callahan said the selloff was triggered by a dense earnings week. He wrote that the data points “to some extent show characteristics of an inflection in growth,” but stressed that those signals came “from outside the core AI complex.” He cited Amazon’s visibility on AWS revenue over the next two years as part of that argument.
The post-earnings reactions were severe. NOW fell 25% in one day, INTC dropped 30%, RDDT lost 30%, and FFIV fell 20%, with several names posting their worst earnings-day performances on record. Callahan attributed the moves to crowded positioning, a compressed earnings calendar, and ongoing structural debates across the sector.
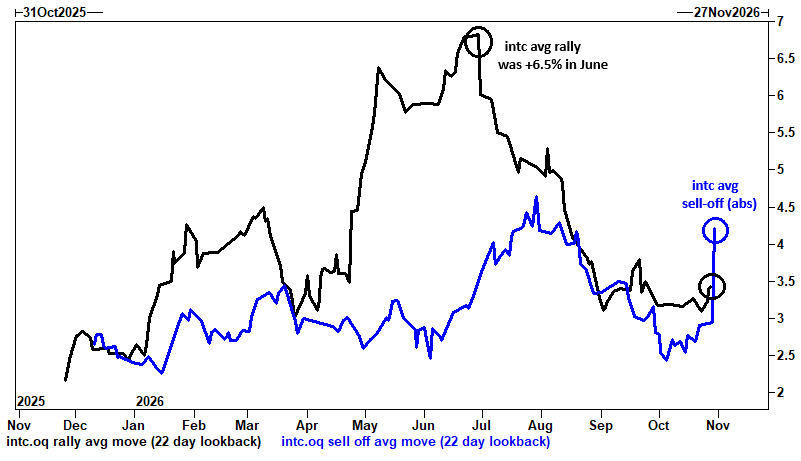
Garrett said the direction of volatility has also changed. Stocks are “no longer crashing upward.” Using Intel as an example, he noted that the company’s average one-day gain reached 6.5% in June, while its average one-day decline has now moved above its average gain. Semiconductor ETFs and QQQ show the same pattern, with average downside swings once again larger than average upside moves. In Garrett’s words, stocks are “starting to trade like stocks again — downside volatility is more extreme than upside volatility.”
Index volatility catches up, but gamma barely moves
The first contrarian signal on Garrett’s list is that macro-level equity implied volatility has finally started to catch up with the fear already priced into single-stock volatility and credit markets.
Goldman’s derivatives team said one-month implied volatility on the Nasdaq 100 jumped by nearly 2 volatility points in a single trading day. Clients also showed a shift toward buying index downside protection and semiconductor put exposure, while the S&P 500 briefly fell through a medium-term CTA threshold intraday. The gap between QQQ realized volatility and implied volatility was one of the most pronounced single events of the past year.
Volatility of volatility rose as well. VVIX touched 124 intraday, the highest level since the outbreak of a specific geopolitical conflict, before easing back. U.S. equity options volume approached 100 million contracts on Friday, the fourth-highest daily total on record.
Gamma, however, stayed largely unmoved. Garrett wrote that “despite meaningful realized index moves on the day, 0DTE straddle pricing never showed a clear response.” For the S&P 500, the cost of a straddle covering both Apple earnings and the midterm election was only 150 basis points, below the 180-basis-point realized decline seen in Friday’s single session. Year-end directional implied moves were priced at ±5.1% for the S&P 500, ±7.8% for the Nasdaq 100, and ±6.3% for the Russell 2000, with large-cap volatility once again above small-cap volatility.
Hedge fund net exposure has fallen to bear-market territory, but the index has not
The second contrarian signal came from Goldman Prime Brokerage data. Hedge funds were net buyers of U.S. equities for the first time in four weeks, at +1.1 standard deviations, but 73% of that buying came from macro products and was driven mainly by short covering. Short interest in U.S.-listed ETFs fell 4.8%, the biggest weekly short-covering move in more than six months, led by technology, large-cap equity and credit ETFs.
Technology was the most net-bought sector for the week, but Goldman’s prime brokerage team said that buying, through Thursday, only offset about 40% of the selling seen over the prior three weeks. The Magnificent Seven were net sold on four of the past five trading days, which Garrett said showed that risk appetite had barely improved in any meaningful way.
He also noted that the Mag 7 remains one of the few areas in TMT where positions are still being added, with long exposure still near yearly highs. In other words, investors are selling technology broadly while still holding on to the most crowded part of the trade.
The more important figure, in his view, is that U.S. fundamental long-short net leverage has fallen to 47%, the 7th percentile of the past year. Garrett regressed that measure against S&P 500 drawdowns and found that this level of net exposure has historically been associated with declines of more than 20%, while the index is currently down only about 3% from its high. That means hedge fund positioning is already braced for a bear market that has not yet happened, which he sees as a contrarian bullish signal.
80% of stocks rose, yet the index still fell
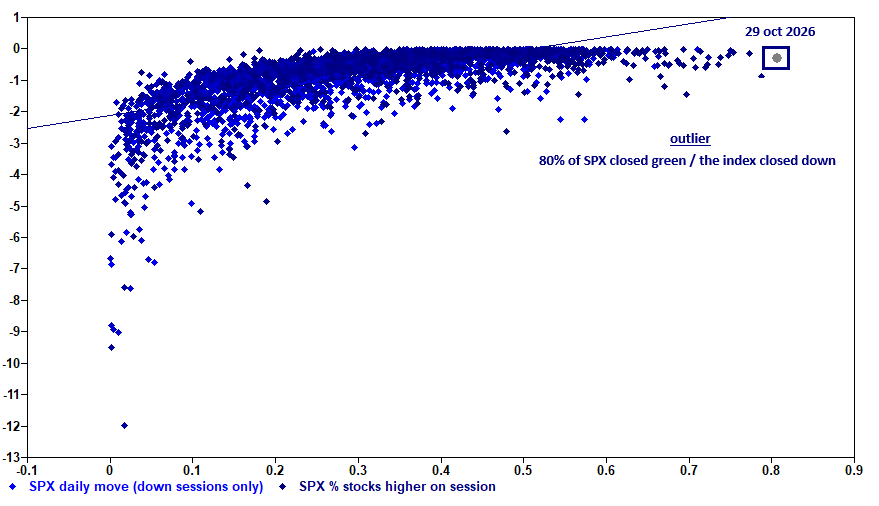
The fourth and fifth signals came from internal market structure. On Thursday, 406 S&P 500 constituents finished higher, one of the highest single-day proportions of 2026, yet the index still closed lower. Garrett plotted all down days against the share of stocks that rose on those sessions and found Thursday stood far outside the usual range. An index decline with 80% of constituents advancing is almost a historical outlier.
That reflects the ongoing split between AI and non-AI stocks. Goldman’s AI winners basket has remained under pressure, while the S&P 500 excluding AI, or S&P ex-AI, is on track for its best monthly performance since 2022. At the same time, long-duration Treasuries through TLT have shown a roughly -0.7 two-week correlation with Goldman’s AI winners basket, near the low end of the past two years, fitting the classic “AI down, bonds up” defensive pattern.
On valuation, the S&P 500 is up 10.7% year to date, but its forward P/E has fallen to about 19x, the lowest level of 2026. The index has risen while valuation has compressed toward earnings, another signal Garrett classifies as contrarian.
Defensives, though, are expensive. The dividend-yield factor sits at the 90th percentile of the past decade, and the valuation factor at the 80th percentile. Momentum is only at the 30th percentile and growth at the 40th percentile. Forward valuation multiples for low-volatility indices have expanded to growth-stock levels.
Callahan wrote that the conversation around “broadening the portfolio” is growing, but “easier said than done.” On days led by non-AI sectors, investors often feel as if positions are being dismantled, and it remains difficult to find non-AI names that are truly insulated from the AI disruption narrative. He listed AAPL, SNPS, ADI/TXN/NXPI, SPOT, V/MA, EBAY and LYV as names that still work in the current setup.
Apple valuation hits a record as catalysts crowd the week
This week’s calendar is packed. Apple reports after the close on Monday, AMD and ANET report on Tuesday, the U.S. midterm election takes place Tuesday, Kalshi puts the probability of a full Democratic sweep at 65%, Treasury refunding details arrive Wednesday through the QRA, and nonfarm payrolls are due Friday after last month’s +29,000 reading. The S&P 500’s implied move for the week is 1.84%.
Callahan said he is focused on five stocks, with Apple at the center. AAPL is trading at 36x forward earnings, a record in absolute valuation terms, and at a 17-turn premium to the S&P 500, also a record on a relative basis. The last mega-cap still widely treated as a defensive asset is now also one of the most expensive in history, reinforcing the view that defensives have become costly.
On the midterm election, Garrett said he does not expect it to be “an event” for the index as a whole, but he does see it as a moment for thematic basket trades. The pair trade he highlighted was long renewable energy and grid-related names while buying downside protection on hyperscale data center and data center equipment baskets. He called “who pays for data center power” the most underappreciated election-sensitive theme in U.S. equities.
The last two signals: softer AI financing expectations and more cautious retail buyers
The final two signals on Garrett’s list are less mechanical. The sixth is that credit specialists have started to suggest AI financing demand may come in below expectations. If hyperscale cloud companies rely less on bond markets than feared, that could ease market anxiety, though Garrett said it “will take time to play out.”
The seventh is the one he appears to enjoy citing most. Garrett said the behavior of his college classmates and his father-in-law is now sending a warning signal. That group has shifted “from buying every dip unconditionally to at least asking one question before buying.” He argued that retail investors are on the eve of an “agentic transition,” and pointed to an advertisement promising users they could set up an AI agent options strategy in seven minutes while their children were out trick-or-treating.
Putting the signals together, Garrett said positioning supports a repair case: net exposure already matches levels historically tied to drawdowns of more than 20%, market breadth has shown panic-like anomalies, defensive valuations look stretched, and retail sentiment is starting to wobble.
Flows, however, show deleveraging is not over. Trading desks are still selling technology, Mag 7 long positions remain near yearly highs, CTA systems are close to triggering another round of sell signals, and options markets are pricing the combined event risk of Apple earnings and the midterm election below the realized cost of Friday’s single-session move.
As for 2027, Garrett said options markets have already priced index internal correlation to around 20%, a historical low. The index itself may look calm, while the internals remain anything but.