
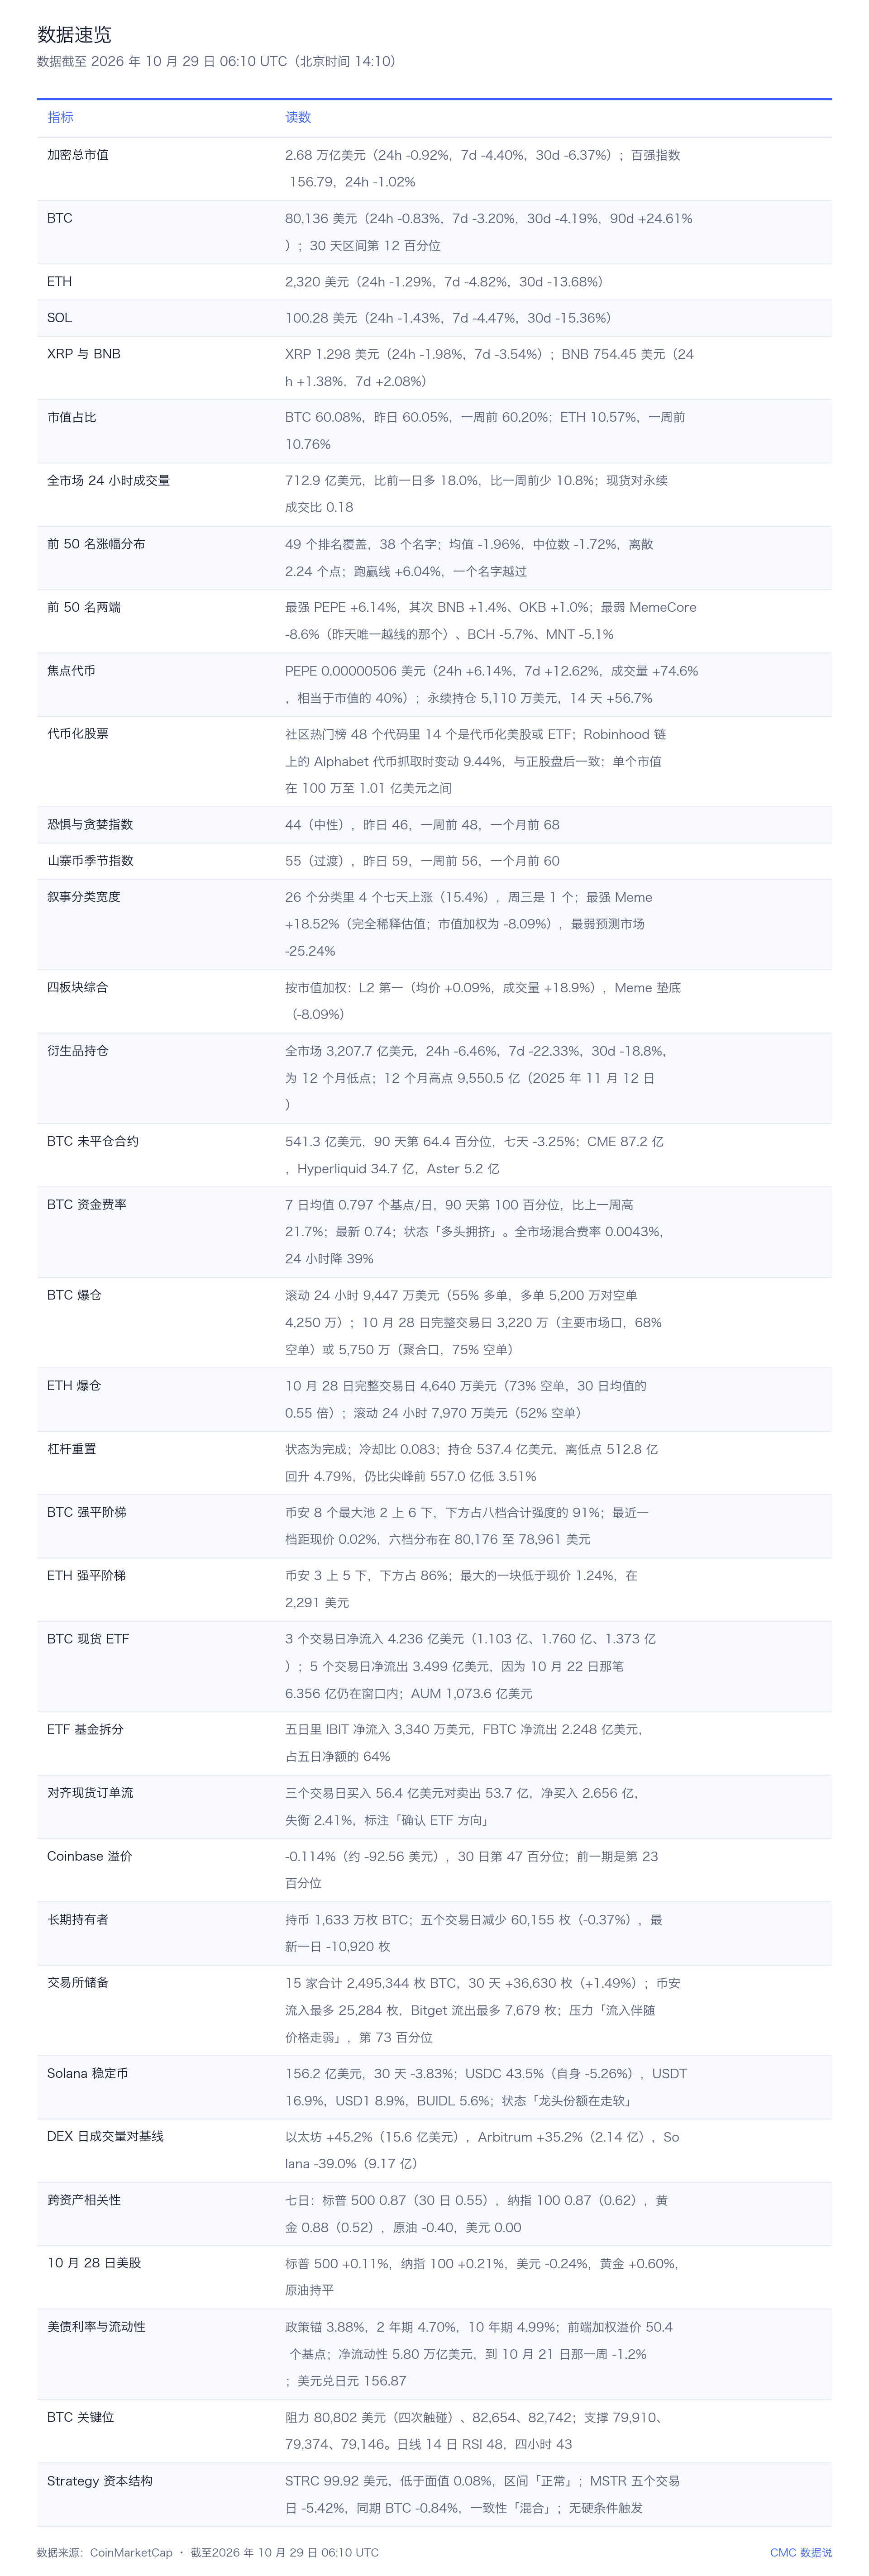
In the latest edition of CMC Data Talk, CoinMarketCap Head of Research Alice Liu wrote that as of 14:10 Beijing time on Oct. 29, 2026, or 06:10 UTC, Bitcoin closed at $80,136, down 0.83% on the day and 3.20% over seven days, placing it in the 12th percentile of its 30-day range. She said Bitcoin briefly moved back above $80,000 on the night of the rate decision, then gave it back before morning. Altcoins did not take over from there. Total crypto market capitalization stood at $2.73 trillion, down 0.38% over 24 hours, and only four names in the top 50 finished in the green.
The report argued that the more meaningful change was in positioning. Its standout observation came from a list where stocks would not normally be expected to appear.
Tokenized U.S. equities moved onto a crypto trending board
The community trending token list had 48 tickers that morning. Fourteen of them were tokenized U.S. stocks or ETFs. The names listed were QQQ, MSTR, SPY, SanDisk, three different Nvidia wrappers, Meta, Alphabet, three different SpaceX wrappers, Amazon, and one wrapper related to Sky.
The one the report singled out was the Alphabet token on Robinhood chain. At the time of capture, it showed a 9.44% move lower, matching both the direction and the size of the after-hours decline in the underlying stock.
According to the column, this was the first time since it began tracking the board that a U.S. stock had appeared on the list as a crypto ticker on the same day as an earnings release.
The report also drew a line between attention and capital. The tokenized stocks on the board had market capitalizations ranging from $1 million to $101 million, which meant they made the list because people were watching them, not because large amounts of money had moved into them. Capital, it said, was still sitting where it had been: the stablecoin complex, which was shown at $273.4 billion in the snapshot, and the major crypto assets.
Put differently, tokenized stocks have become a real object of attention, but not yet a real pool of capital. The gap between those two things is still two to three orders of magnitude.
In derivatives, the most crowded long was crude oil
The derivatives side showed the same shift in sharper form. Liu wrote that the perpetual scanner takes a 200-contract snapshot each round. In this round, 24 contracts were commodity, index, or equity-linked instruments, and the scanner had to filter them out before it could rank altcoins.
The ranking itself was the more telling part. Across the full scan, the most crowded long was a crude oil perpetual contract, not any crypto token, with a 1-hour long/short ratio of 4.74.
The report said this was not a conclusion about oil prices. It was an observation about the edges of the crypto market: those edges are getting less distinct, while the tools used to read the market have not fully caught up.
PEPE crossed the outperformance line without a clear catalyst
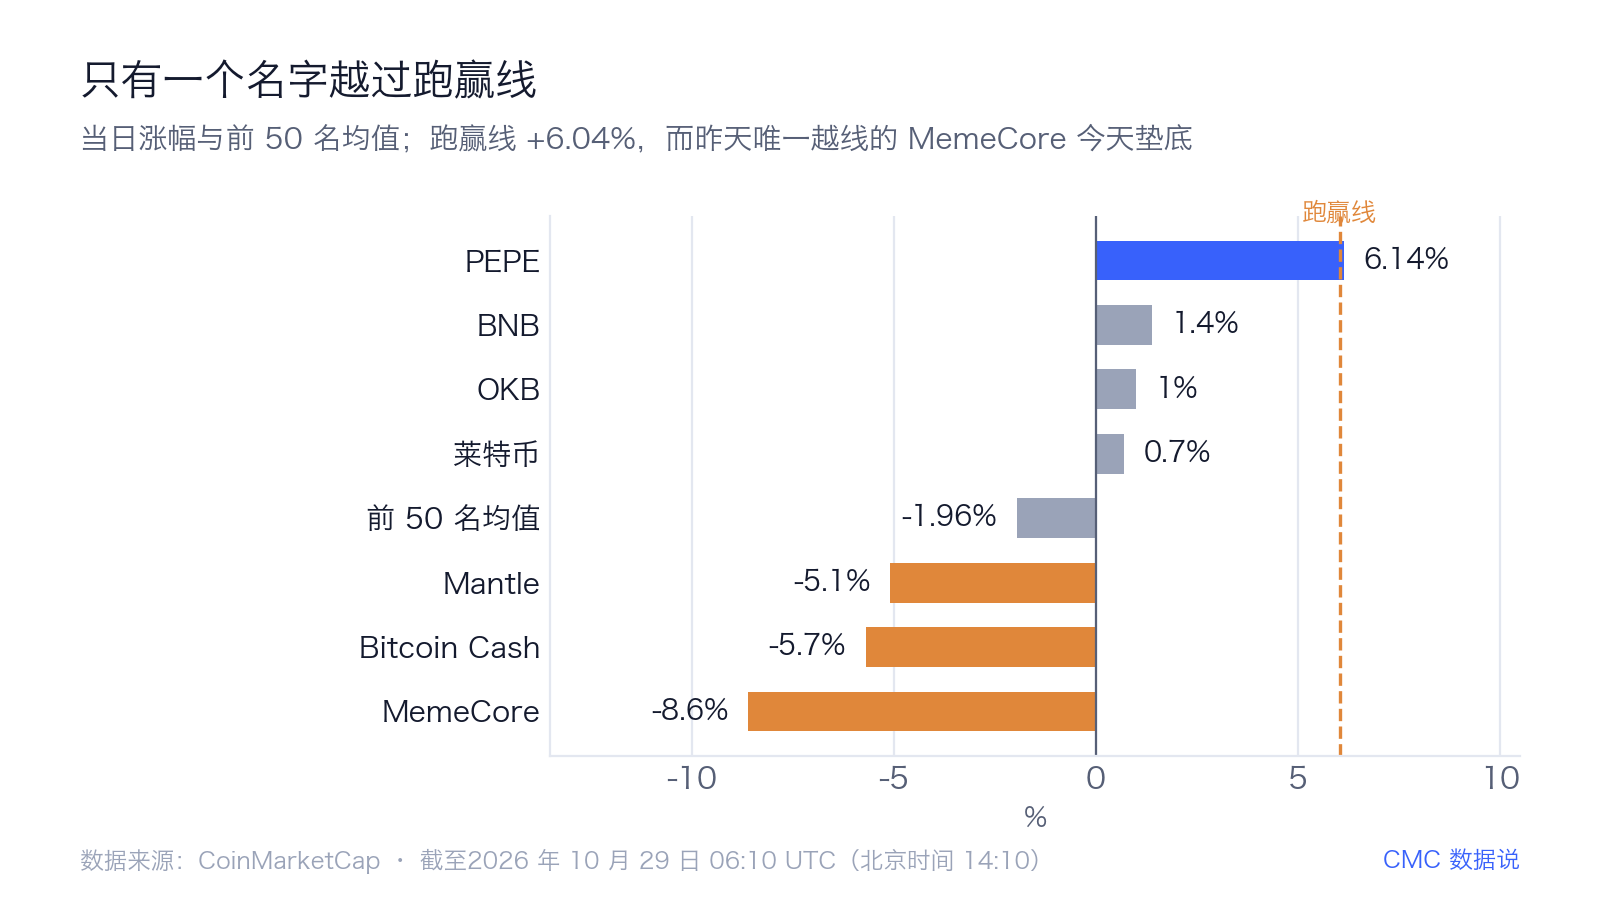
The top 50 moved lower in a fairly uniform way that day. The scan covered 49 ranked assets, with 38 valid samples. The average decline was 1.96%, the median decline was 1.72%, and dispersion was only 2.24 percentage points. The outperformance line was set at +6.04%, and only one name cleared it.
That name was PEPE. It traded at $0.00000506, up 6.14% over 24 hours and 12.62% over seven days, while volume rose 74.6%. Behind it were BNB, up 1.4%, OKB, up 1.0%, and Litecoin, up 0.7%.
The report said the move had no obvious reason. In the official-updates section, the three-day window showed only one routine meme post, with no announcement, no partnership, and no tokenomics change. On that basis, the model classified the price action as unrelated to official communication.
Social signals pointed somewhere else. The report described them as constructive and high-conviction. High-signal trading accounts were aligned on three points: accumulation in holdings attributed to a specific wallet, a break above $0.00000454, and upside expectations after that break. The report added that the wallet attribution came from outside sources and could not be verified. Broader retail discussion was thin, and the risk language being repeated was old material rather than something new.
Positioning data needed to be read separately. PEPE perpetual open interest stood at $51.1 million, equal to 2.45% of its $2.09 billion market capitalization, below the 10% influence threshold, so the move was still spot-led in role terms. But open interest had risen 56.7% over 14 days while price was up only 29% over the same period, and open interest added another 30.7% in 24 hours. In aligned windows, futures order flow was positive, spot order flow was negative, and funding was slightly positive.
Volume came in at $837 million, or 40% of market capitalization. For a $2 billion asset, the report called that a very high turnover rate.
The three-day heat map was the key detail. Its main pressure zone sat 7.5% to 8.9% below the current price, in a long pool rather than above the market. The brief warned that when a rally is pushed by perpetuals, sits on top of its own liquidation pool, and lacks a clear catalyst, the giveback often comes as quickly as the rise.
The comparison on the same table was MemeCore. It fell 8.6% on the day, the worst result among the 38 names, after being the only asset to clear the outperformance line the day before.
Narrative breadth improved from one category to four, but one token did most of the work
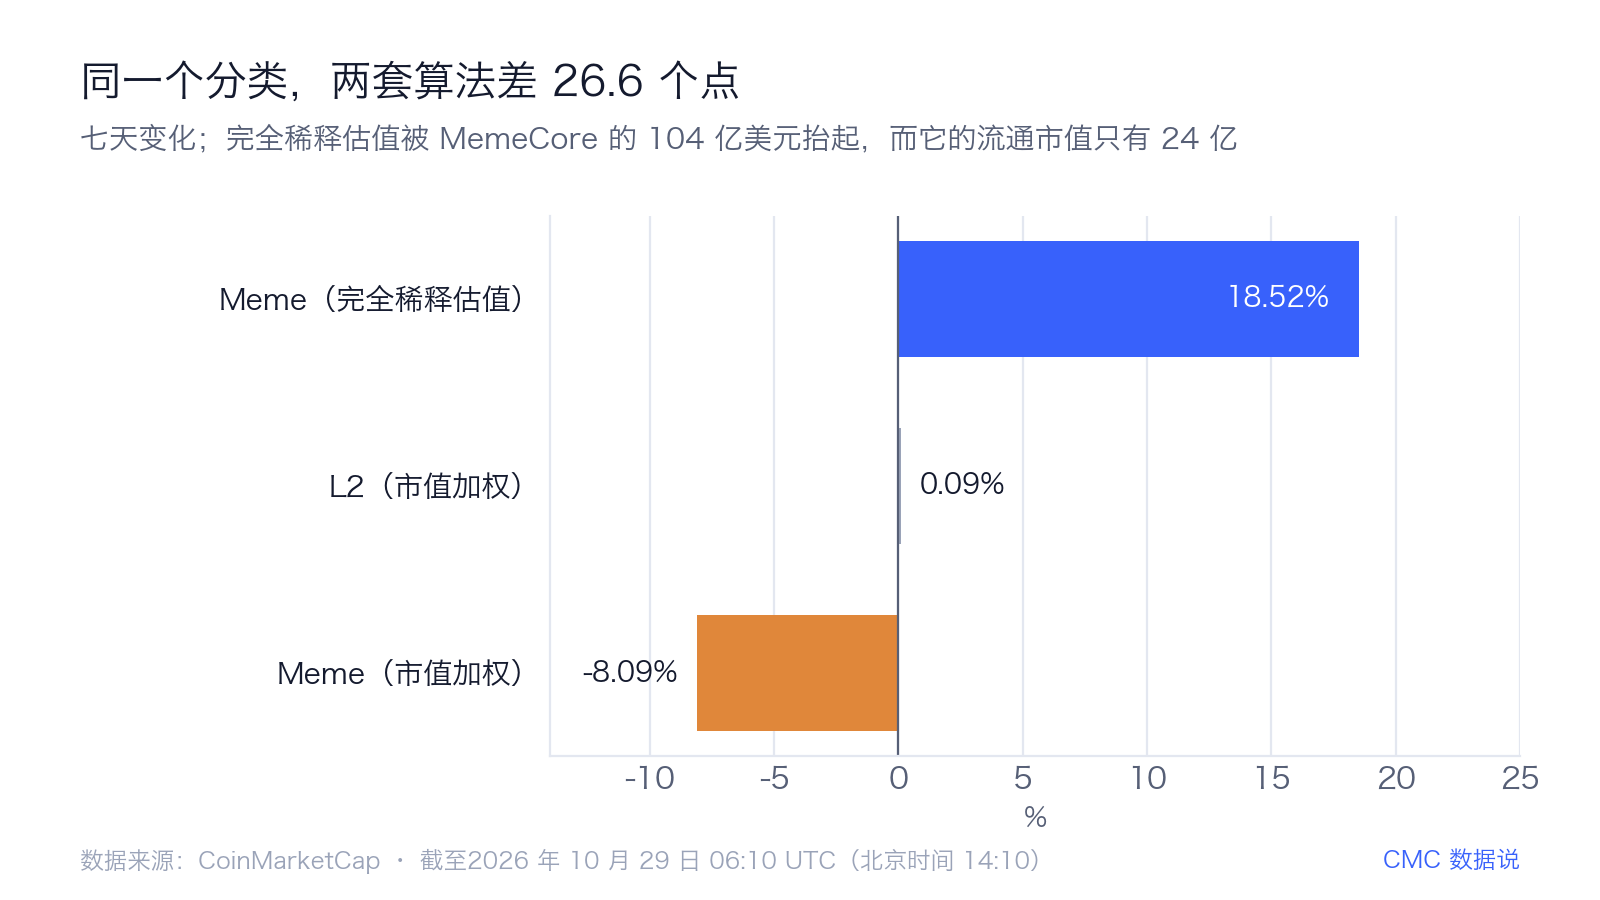
On the surface, narrative breadth looked better. Four of 26 categories posted gains over seven days, or 15.4%, compared with just one category on Wednesday.
The report said that improvement was mostly a window effect plus one token. On the rotation side, the calculation uses fully diluted valuation. MemeCore had a fully diluted valuation of $10.4 billion and was up 32% over seven days, while its circulating market capitalization was only $2.4 billion. That single number lifted the Meme category to a 7-day gain of 18.52%, making it the strongest of the 26 groups.
Switch to the market-cap-weighted four-quadrant scorecard, and the same Meme category drops to last place with a 7-day decline of 8.09%. The top-ranked category there was L2. Its average price gain was only 0.09%, while volume rose 18.9%. It ranked first because others fell more, not because it rallied hard.
The brief published both methods and said the market-cap-weighted version is the better guide to where money actually is. Liu took the same approach: the breadth figure is worth recording, but it is not evidence that rotation has returned.
The category worth watching was centralized exchange tokens. They were up 2.39% over seven days, second-best among the 26 groups and the only mega-cap category still rising. BNB was at $754, up 2.1% over seven days; OKB was at $111; and LEO was at $9.46, up 2.4% on the day. The report said exchange tokens were once again on the defensive side of the altcoin market.
The spread between the strongest and weakest categories was 27.6 percentage points. Centralized exchange tokens were up 2.39% over seven days, while prediction markets were down 25.24%, finishing last for a second straight report. The brief said that kind of gap between the most defensive end and the most speculative end is what a deleveraging week should look like.
The discussion board also saw one membership change. The music category entered the list with a total size of $122 million and a 24-hour volume increase of 108.6%, driven by BEAT, which was up 24.6% over seven days. It replaced the Bitcoin ecosystem category. The other four names on the list remained large-cap regulatory baskets centered on Bitcoin and Ether, down 3.0% to 3.3% over seven days.
Five details from deeper in the tape
The report said positioning, fund-flow, and cross-asset data were current through 06:10 UTC on Oct. 29, and it highlighted five details.
1. Worldcoin was the weakest top-50 name on a seven-day basis
In the weakest tier, the identity category was down 16.02% over seven days, third from the bottom among 26 categories. Its component Worldcoin traded at $0.418, down 3.6% on the day and 23.2% over seven days. The on-chain voting category, which ranked first on Monday, was now down 23.16% over seven days and second from the bottom. Leadership has changed quickly over the past two weeks, the report said, but the groups that fell away have not come back.
2. The assets being discussed were not the same ones being bought
The rotation list of discussed tickers included Bitcoin, BNB, Chainlink, Ether, and Solana. The overlap with the community attention list was only Bitcoin, Solana, and XRP. Just three names matched, and two of them were majors. Attention is spreading out, while the overlap is narrowing, the report said.
3. Fear and Greed was 44, and Altcoin Season was 55
Fear and Greed was 46 the day before, 48 a week earlier, and 68 a month earlier. The Altcoin Season Index was 59 the day before, 56 a week earlier, and 60 a month earlier. Neither reading was at an extreme, yet price was already in the 12th percentile of the 30-day range. Sentiment was milder than positioning in price terms.
4. Strategy preferred stock was trading almost exactly at par
STRC was at $99.92, or 0.08% below par, on the same day shareholders approved daily preferred dividends. MSTR was down 5.42% over five trading days, while Bitcoin was down only 0.84% over the same period. The report labeled consistency as mixed, the capital-structure signal as benign, and said no hard condition had been triggered. The gap between the stock and Bitcoin widened to 4.6 percentage points again.
5. Two sets of Bitcoin levels mattered
Bitcoin’s 30-day range was $79,146 to $87,146, with spot in the 12th percentile. The daily 14-day RSI was 48 and the four-hour RSI was 43. Resistance at $80,802 had already been tested four times, with $82,654 and $82,742 above it. Support sat at $79,910, $79,374, and $79,146.
What the report said to watch next
- On Oct. 29 at 20:30 Beijing time and Oct. 30 at 01:00, the report pointed to September PCE, the first estimate of third-quarter GDP, weekly jobless claims, and a seven-year Treasury auction. The figures listed were: headline PCE expected at 3.6% year over year versus 3.4% the previous month; core PCE at 3.1% versus 3.0%, with core month over month at 0.3%; GDP expected at 3.2% versus a prior 2.2%; jobless claims expected at 199,000 versus 194,000; and the previous seven-year auction at 5.085%. It also noted a report that Coinbase would release third-quarter earnings after the U.S. stock market close, but said that item was unverified.
- On Oct. 30 at 00:30, the next item was remarks from Federal Reserve official Musalem. Another brief was due the same day. The report said the focus was whether ETF inflows could extend to a fourth straight day and whether the five-trading-day window could turn positive. For that to happen, the $137.9 million outflow from Oct. 23 would need to roll out of the window, and Friday itself would also need to be positive.
- On Oct. 31, month-end comes into view. Bitcoin closed September at $83,567 and was now at $80,136. At that level, October would be the second straight down month for October. The report said that statement came from news coverage rather than its own closing-price series.
- On Nov. 3, the U.S. midterm elections were on the calendar. The second-most-viewed community post that day, with 76,600 views, argued that Bitcoin had rallied after every midterm election. The report said the sample was too small and did not adopt the claim.
- The brief said to keep watching PEPE perpetual open interest. It was up 56.7% over 14 days while price was up only 29%, and its own long pool sat 7.5% to 8.9% below spot. Those two facts need to be read together.
- It also said to keep watching the tokenized-stock board. The count was 14 out of 48 tickers that day. If that share rises again in the next report while market capitalizations remain in the million-to-hundred-million-dollar range, attention and capital would still be moving apart.
The report’s closing point was about market boundaries, not price
The brief ended by saying the most important thing to record was not the day’s price action but the changing boundary of the market. Fourteen of the 48 trending tickers were tokenized U.S. equities, and one of them tracked Alphabet’s earnings-night drop with a 9.44% decline. That was a first for the column. At the same time, in a perpetual scan built for crypto, 24 of 200 contracts were commodity, index, or equity-linked products, and the most crowded long was a crude oil contract.
Even so, attention and capital have not converged. Those tokenized stocks still carry market capitalizations between $1 million and $101 million, while money remains concentrated in stablecoins and major crypto assets. The gap is still two to three orders of magnitude.
As for PEPE, the report said the day’s only outperformance move lacked a clear catalyst. Official communication over three days amounted to one routine post, open interest was up 56.7% over 14 days while price was up only 29%, and the token was sitting above its own long liquidation pool. MemeCore, the only name above the line the day before, fell 8.6% and became the worst performer in the sample.
It also said the move in breadth from one category to four was largely the result of one token’s fully diluted valuation. Under market-cap weighting, the same Meme category ranked last.
The article ended with a disclaimer that markets carry risk and the piece does not constitute investment advice. Readers should judge whether any opinion, view, or conclusion fits their own circumstances and bear responsibility for their own decisions.