
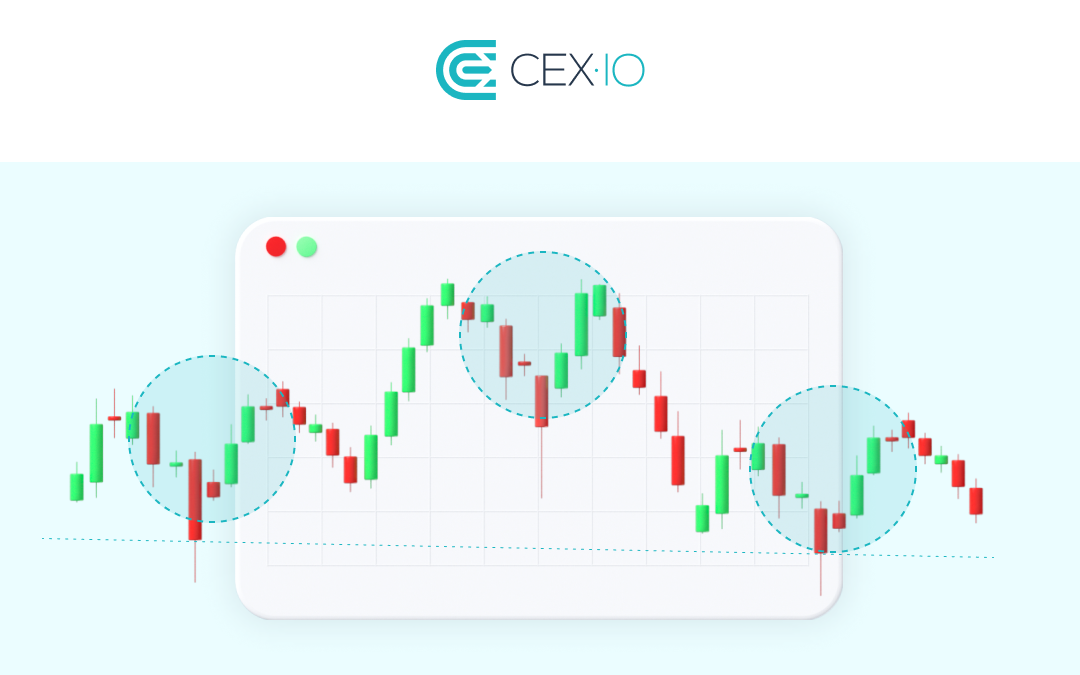
The head and shoulders pattern is widely regarded as one of the more reliable chart structures for spotting a potential trend reversal. It typically appears after a sustained upward move and suggests that bullish momentum may be fading. In its classic form, the pattern consists of three peaks: a higher middle peak known as the head, and two outer peaks of similar height that form the shoulders. The line connecting the reaction lows is called the neckline, and it can slope upward, downward, or remain flat.
How traders identify the pattern
A standard head and shoulders top usually forms near the end of an established uptrend. Its quality is often judged by several factors, including how clearly price overlaps around the neckline, whether the shoulders are reasonably symmetrical, and whether the head is proportionate to the rest of the formation. According to the source material, patterns on higher time frames, with balanced shoulders and a head no more than 2.5 times the shoulder range, are often considered more dependable.
Volume is another key element. A common observation is that the left shoulder forms on the strongest volume, the head forms on lower volume, and the right shoulder forms on the weakest volume, signaling fading buying pressure. This is not a strict requirement, but it can serve as an early warning. When price approaches the neckline after the third peak, a breakout with expanding volume is generally seen as stronger confirmation. If the break occurs on weak volume, the market may retest the neckline before moving further.
Price target and entry logic
In practice, many traders wait until the pattern is fully confirmed before considering a short entry. One common entry is the downside break of the neckline itself. Another is a throwback or pullback to the neckline after the break, followed by renewed weakness. However, if the breakdown happens on strong volume, the market may not offer a retest. The same can happen when the neckline area overlaps with a major support zone, where price may move decisively without revisiting the breakout level.
For price targets, a common method is to project the height of the head from the breakout point. There is no single universal approach: some measure from the highest point of the head to the neckline, while others use a more conservative reference based on the highest candle structure. In either case, the target should be treated as an estimate, not a guaranteed destination. Existing support levels on the chart remain important, as price may stall or consolidate before reaching the projected move.
Stop losses and failed setups
Even though the head and shoulders is considered a strong reversal pattern, it can fail. Failures may occur when volume behaves abnormally or when the broader market structure favors consolidation rather than a meaningful retracement. For that reason, risk management remains essential. The source notes that stop losses can be placed near the high of the candle just before the breakdown, or even higher depending on the average volatility of the asset being traded.
Inverse head and shoulders
The bullish counterpart is the inverse head and shoulders, also known as a head and shoulders bottom. It follows the same structural logic in reverse: three valleys, with the middle one being the deepest and the outer two at similar depths. Its neckline connects the intervening highs, and volume tends to contract during formation before expanding on the upside breakout. As with the bearish version, the upside price objective is only an estimate. If momentum is weak, price may consolidate before reaching the projected target.
Overall, the pattern’s main value lies in helping traders recognize a possible shift in trend, but the source emphasizes that confirmation matters. Rather than anticipating the setup too early, traders may prefer to wait for completion and study the breakout behavior carefully. Volume around the neckline remains especially important in judging whether a pullback is likely. Momentum indicators can also be used as additional confirmation. The original article also includes a reminder that the material is for informational purposes only and does not constitute investment or financial advice.