
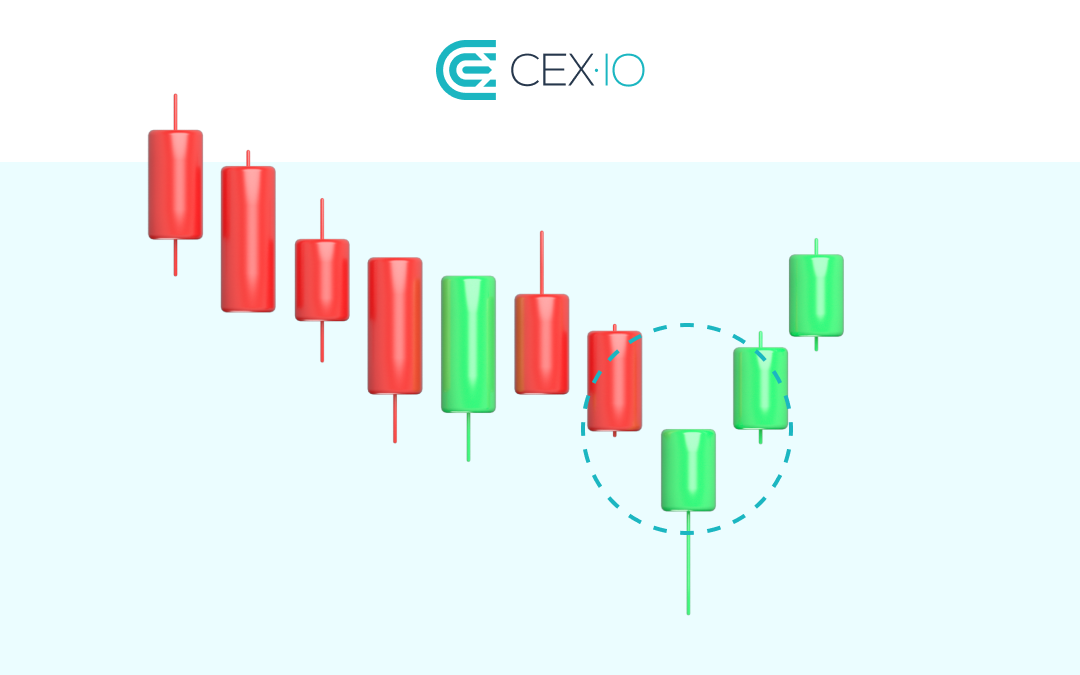
Japanese candlesticks remain one of the most widely used ways to read price action in crypto markets. Each candle compresses a chosen period of trading into open, high, low, and close, giving traders a quick view of how price moved during that interval. The method began in Japan, and the source credits its early development to rice trader Munehisa Homma, who observed that markets were shaped by trader emotions as well as supply and demand.
The approach was refined over time and later reached a much broader audience through the work of Steve Nison, who learned about the method from a Japanese broker and published books under the name “Japanese candlesticks.” That helped turn candlestick analysis into a standard part of modern chart reading. In crypto, it is now one of the default ways traders examine market structure.
What a single candlestick contains
A candlestick always reflects a defined timeframe. On a 1-hour chart, one candle represents one hour of trading; the same format can be applied to periods ranging from seconds to years.
Every candle has four core components. The open is the first traded price in that period. The high is the highest recorded price, the low is the lowest, and the close is the final traded price before the period ends. The distance between open and close forms the candle body, while the lines extending above or below are the shadows, also called tails or wicks.
If the close is above the open, the candle is generally considered bullish and is often shown in green. If the open is above the close, it is bearish and commonly shown in red. The color is a display choice; the real value lies in the four price points.
How traders read bodies and shadows
A candlestick chart can be read as a visual record of the struggle between buyers and sellers. A long body usually shows that one side held control for most of that period. Buying pressure or selling pressure was strong. A short body tells a different story: lighter activity, hesitation, or a more balanced contest between both sides.
Shadows add another layer. Long shadows show that price moved well beyond the open or close before pulling back. Short shadows suggest most of the activity stayed near the body. For example, a candle with a long upper shadow and a short lower shadow can indicate that buyers pushed price higher during the period, but sellers later forced it back down closer to the opening level.
Even so, a single candle has limits. The source notes that candlesticks do not show the sequence of intraperiod moves in detail. Traders can see the final high, low, and close, but not whether the upper shadow or lower shadow came first.
How candlesticks are used in analysis
Much of technical analysis focuses on reading price action from individual candles and, more importantly, from combinations of candles. These patterns may suggest a possible reversal, trend continuation, or indecision. They can appear as single-, double-, or triple-candle formations.
Still, the material is clear on one point: candlestick patterns should not be treated as the only reason to enter a trade. Their reliability varies. Other inputs matter, including volume, analytical indicators, market sentiment, and news. Candlesticks work best as one layer of analysis rather than a standalone signal.
Four mistakes new traders often make
The first mistake is trying to assign meaning to every candle. Real markets are noisy, and not every price move carries useful information for what comes next. A more practical starting point is to pay closer attention to candles forming near important price levels.
The second mistake is using candlestick patterns without checking support and resistance. A reversal pattern that appears at a random level does not automatically mean price will reverse. The source recommends identifying support and resistance first, then looking for patterns near those zones. It gives an example where price failed to break a resistance level and a Three Inside Down pattern formed, reinforcing bearish sentiment and helping shift the trend.
The third mistake is searching only for textbook-perfect formations. Live charts rarely look as clean as illustrations in guides. A pattern that is usually shown as a three-candle setup may take four or even five candles to complete, and a slightly higher or lower shadow does not always invalidate the setup. The more useful approach is to focus on the price action behind the pattern instead of forcing the chart to match a diagram.
The fourth mistake is trading before confirmation. Many patterns are not valid until the candle has closed, and some need an extra candle to confirm direction. The source uses the Piercing Line as an example, noting that this double-candle pattern can point to a bearish-to-bullish reversal when it is followed by a bullish confirmation candle. Before the close, the setup is still incomplete.
For crypto traders, Japanese candlesticks are a basic language for reading market behavior. They can reveal pressure, hesitation, and reactions around key levels, but they do not explain everything on their own. Their value increases when they are read with context, location, and confirmation.