
June moved from liquidation to early signs of seller exhaustion
Monera Digital said June was both a public dismantling of conviction and a textbook rehearsal for bottom building. After May exposed a failed liquidity transmission story, June answered what comes next: internal distribution gave way to capitulation, the strongest cycle narrative around corporate treasuries began to negate itself, and macro conditions shifted from “good news doesn’t lift price” to outright tightening being priced in.
Still, the report did not frame the month as one-way collapse. It said long-term holders returned to net accumulation after several months, and stronger hands began buying into panic, leaving what it called an initial confirmation of seller exhaustion by month-end.
BTC started the month at $73,764 and ended near $59,624, down about 19.2%. The two key lows, $59,130 on June 5 and $58,201 at the end of the month, left Bitcoin down 54% from the cycle peak of $126,000 on Oct. 2025. ETH fell from $2,007 to $1,572, a monthly drop of about 22%, with a low of $1,505.
Monera Digital grouped the month into three major threads: a public break in the institutional-buying model, the worst month on record for spot ETF redemptions, and a full microstructure transition from capitulation to accumulation.
Strategy changed from a structural buyer to a possible source of supply
The report put Strategy at the center of the month’s industry narrative. At the start of June, the company cut 32 BTC, breaking its “never sell” commitment. By mid-month, its mNAV had fallen to 1.02, and both equity and credit financing channels had effectively shut. At the end of the month, Strategy announced its Digital Credit capital framework, with board approval to monetize as much as $1.25 billion in BTC.
Monera Digital said that turned “sell coins to pay income” from a tail risk into an institutionalized possibility. A buyer that had been one of the largest price-insensitive sources of demand over the past two years may not only fail to return, but could also become a reverse supplier of roughly 20,000 BTC.
The report added more detail. On June 1, Strategy sold 32 BTC. By mid-June, mNAV had compressed to 1.02, STRC traded at a discount of more than 24%, and its implied yield rose to 15.19%. That left both equity issuance and preferred-share refinancing channels blocked while annual dividends at the $2 billion scale still had to be paid. Later in the month, the company completed a $1.5 billion OTC transaction with BSTR to raise dollar reserves. On June 29, it formally unveiled the Digital Credit capital framework, lifted STRC dividends to 12%, set two separate $1 billion buyback tracks, and authorized BTC monetization of up to $1.25 billion.
Monera Digital said the framework extends coverage to about 26 months and supports preferred shareholders, which it described as responsible capital management. For BTC, though, the market consequence is harsh: the only large price-insensitive buyer over recent months has become a potential structural seller. The one offsetting point was market behavior itself. BTC did not set a new low on the day the announcement landed.
Macro turned from a rate-cut debate into a rate-hike trade
Monera Digital said June brought three direct blows to easing expectations.
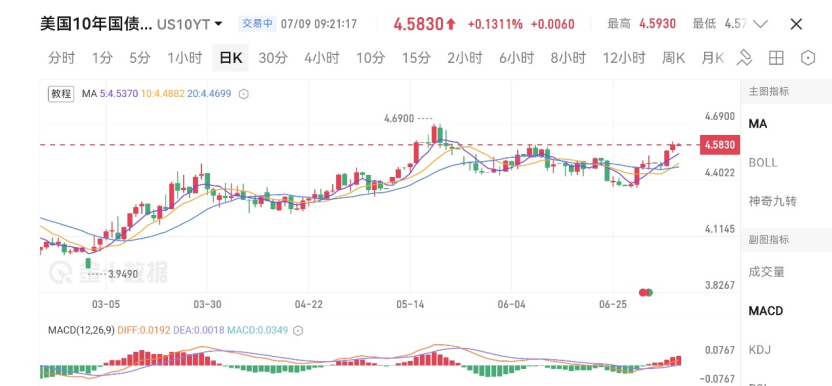
The first came from economic data. JOLTS job openings on June 2 came in at 7.62 million, a near two-year high and 750,000 above expectations, pushing the 10-year Treasury yield back above 4.45%. On June 6, a hot May payrolls report wiped out hopes for rate cuts. The market immediately priced in a 25 bp hike before December and put October hike odds near 60%. U.S. equities sold off sharply that day, with the Nasdaq down 4.18% and the Philadelphia Semiconductor Index dropping as much as 10% intraday. On June 11, May CPI rose 4.2% year over year, the highest since April 2023. On June 25, core PCE hit 3.4%, the highest since October 2023, while headline PCE rose 4.1%, the first reading above 4% in three years.
The second came from the June 18 FOMC meeting. The Federal Reserve kept rates unchanged for a fourth straight meeting at 3.5% to 3.75%, but the SEP shifted in a stagflationary direction. The median 2026 rate forecast was raised from 3.4% to 3.8%, the PCE forecast moved up to 3.6%, and GDP was revised down to 2.2%. New Chair Warsh said in his first press conference that “persistently high prices are a burden on the public.”
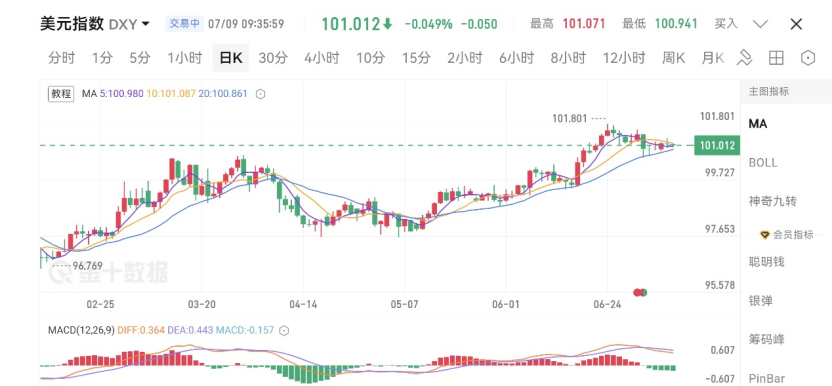
The third was the return of dollar strength. DXY moved back above its 200-day moving average in late June, reaching 101.80 versus 98.72. Monera Digital said the negative relationship seen in 2022 and 2023, where a stronger dollar weighed on crypto, reasserted itself after a period of decoupling. By month-end, the S&P 500 had recovered its year-to-date decline and reclaimed its own 200-day average, while BTC still traded 18% below its 200-day average of $76,466.
The report also noted that the Bank of Japan raised rates by 25 bp to 1.00% on June 16, the highest level since 1995. The yen, however, kept weakening and broke below 162 by month-end, its weakest level in nearly 40 years.
Geopolitical swings failed to lift BTC
Monera Digital described the Middle East backdrop as a full cycle of rupture, combat, signing, renewed conflict, and another ceasefire.
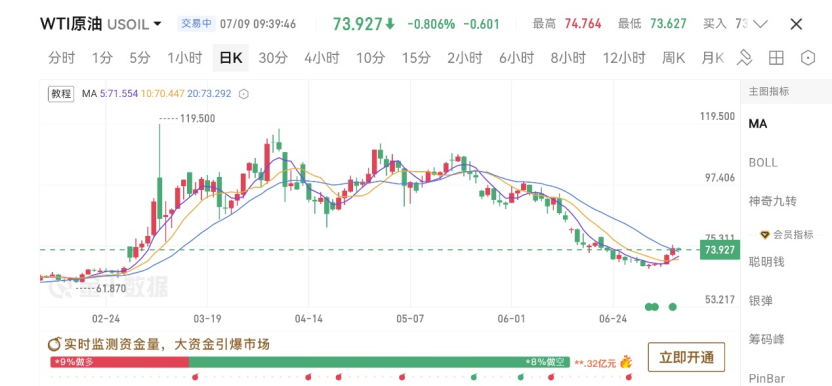
In early June, tensions moved quickly from negotiations to direct military action. On June 2 and 3, the U.S. and Iran exchanged strikes. On June 10 and 11, U.S. forces launched multiple airstrikes on Iranian territory, Iran announced the closure of the Strait of Hormuz, more than 160 oil tankers were stranded, and the IMO for the first time advised merchant shipping not to pass through. WTI crude climbed to $96.
The picture then reversed in mid-June. On June 14, Trump announced a “birthday gift” agreement and full reopening of the strait. On June 17, a memorandum of understanding was signed remotely and took effect immediately. Oil dropped from $86 to $76, safe-haven premium in gold evaporated, and BTC only recovered to the $65,000-$66,000 range.
Tensions rose again late in the month. A cargo ship was hit by drones on June 25. On June 26, the U.S. launched another round of airstrikes and Iran retaliated against U.S. positions. Another ceasefire was announced on June 28 alongside plans for talks in Doha, but Iran later denied it and Israel threatened to act independently.
Gold fell from $4,483 at the start of the month to below $4,000 by the end, a drop of about 10%. Monera Digital said precious metals priced each injection and withdrawal of geopolitical premium, while BTC refused to absorb relief and fully participated in each risk-off leg. In its reading, the “digital gold” trade was disproved during June, and Bitcoin was traded as a high-beta risk asset.
ETF outflows hit records as U.S. channels stayed under pressure
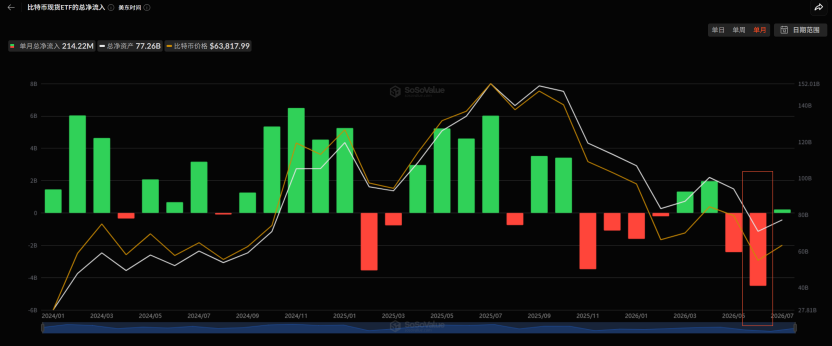
Spot BTC ETFs saw about $4.51 billion in net outflows for the month, the largest monthly drawdown since the products launched. The report broke the month into three widening waves. During the early-month collapse, 11 straight sessions saw combined outflows of $3.45 billion, with a one-day peak of $520 million. Mid-month relief brought only two or three weak inflow days in the tens of millions, while the run of outflow sessions became the longest on record. In late June, redemptions worsened again even as geopolitical pressure eased, with a single-day outflow of $696 million on June 25.
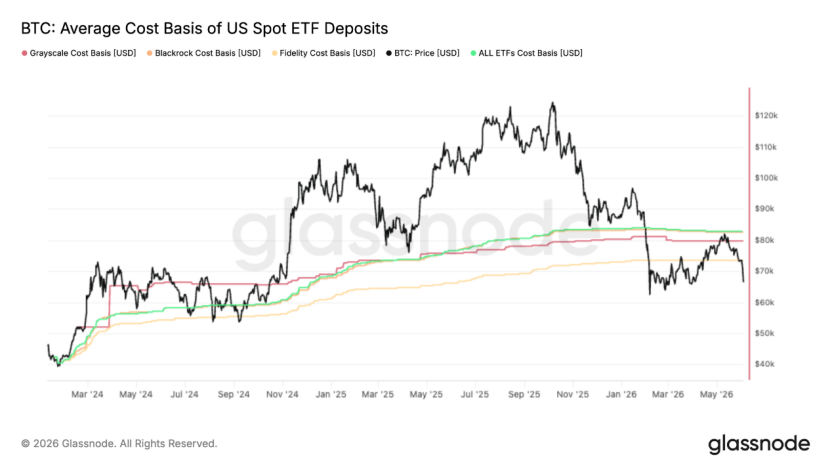
Monera Digital said the pattern looked more like orderly profit-taking by institutions that had built positions at much lower prices than panic selling. Even so, the conclusion stayed the same: favorable developments failed to pull money back, while negative news accelerated exits. The report also noted that BTC’s rebound to $82,800 in mid-May was rejected almost exactly at the ETF aggregate cost basis of $83,000, leaving the average ETF investor underwater through June and creating overhead supply from trapped holders selling into rallies.
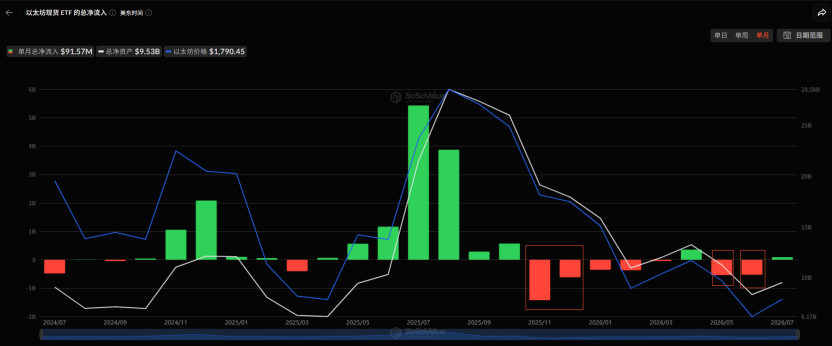
Spot ETH ETFs posted about $550 million in net outflows in June. The report said the only offset came from the DAT side. Bitmine added about 280,000 ETH over the month to bring total holdings to 5.7 million ETH, while Sharplink resumed accumulation after eight months. Even there, industry DAT assets under management had shrunk from $220 billion to $140 billion, and financing had largely stalled outside the top two or three players. Corporate-treasury net inflows, which had peaked above $500 million per day in April and May, fell to near zero in June.
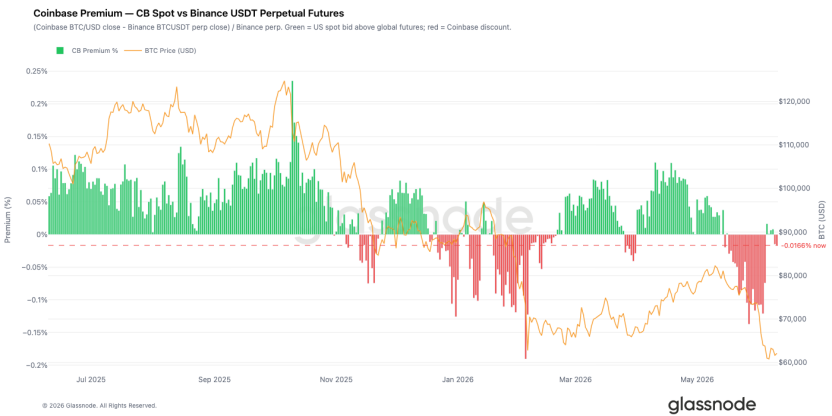
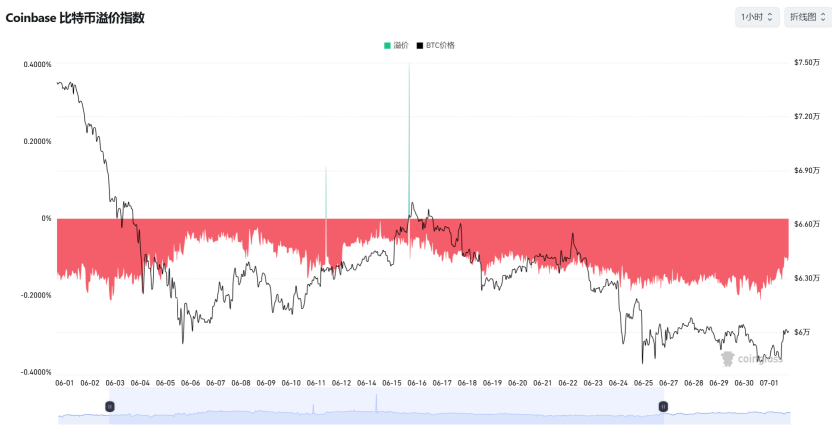
One important shift appeared near month-end. Coinbase premium stayed deeply negative for most of June, but after BTC fell below $62,000, Coinbase spot CVD bias turned positive before Binance did. Binance remained negative, and its order-book imbalance shifted to the strongest buy-side reading in months. Monera Digital took that as a sign that U.S. institutional spot buyers had started to absorb supply at lower levels while offshore speculative flows remained defensive.
On-chain signals shifted from failed rebound to broad accumulation
The report described June’s on-chain path as a sequence of invalidation, capitulation, repair, and accumulation.
At the start of the month, rebound hopes broke down quickly. The 7-day average of realized profit/loss ratio fell from 3.16 to 0.29, while the 90-day average never reached the 2.0 threshold. That confirmed the move back toward $82,000 as a bear-market bounce rather than a structural change. The short-term holder cost basis fell below the true market mean for the first time since January 2022, which the report called a formal late-bear-market structure. Daily realized loss expanded to $1.35 billion, with $770 million coming from investors who bought near the cycle top and then sold at a loss.
Capitulation deepened after that, but not to historical extremes. AVIV z-score fell as low as -1.09, entering an extreme discount band. The share of profitable short-term holder supply dropped to just 0.6%, versus a four-year average of 55%, meaning more than 95% of new buyers were underwater at the same time. STH-SOPR z-score bottomed at -1.86, only 0.14 standard deviations from the -2 threshold associated with severe capitulation.
Repair signs appeared in the second half of the month. The short-term holder cost basis fell to $71,400, marking the first systematic entry by new buyers below the cycle average. That, the report said, is an early condition for bottom formation. Net Realized P/L’s 90-day average held at negative $205 million per day, and price kept gravitating toward the realized price of $53,400. The report marked the $66,800-$70,700 range as the clearest overhead resistance zone because of concentrated short-term supply there.
The most important change came at month-end, when accumulation appeared in broad cross-cohort form. Long-term holder net position change returned to positive territory, ending a long period of distribution. Accumulation Trend Score also rose sharply: the under-1 BTC cohort and the 100-1,000 BTC cohort both approached full-score accumulation, and 1,000-10,000 BTC holders also shifted back to net buying. The long-term holder supply share rose to 88.1%, a multi-year high.
Another milestone appeared at the same time. Loss-making supply reached 10.83 million BTC and exceeded profitable supply of 9.22 million BTC for the first time. Monera Digital said that kind of collapse in the profit structure has historically created the conditions for large-scale coin migration from weaker hands to stronger ones.
Valuation indicators also moved to extremes. Ahr999 fell to 0.283 at the end of June, a level seen only in a few episodes including late 2011, the 2018 bear-market bottom, the March 2020 crash, and the 2022 FTX collapse. On the ETH side, the share of supply sitting on gains above 3x dropped to 11%, the lowest since February 2017.
Derivatives ended the month with a short trap
Monera Digital divided June deleveraging into four stages. Liquidations across the market totaled $743 million on June 1. They rose to a one-day peak of $1.78 billion on June 3, affecting 278,100 traders, with longs making up nearly 90% of the total. On June 6, the payroll-driven sell-off hit 348,000 traders. In the second half of the month, repeated geopolitical shocks added several more days with liquidations between $400 million and $1 billion. Total open interest shrank by more than $2.3 billion over the month, while funding rates moved around flat.
What mattered most at the end of June was the difference between two OI episodes. The June 24 breakdown was spot-led: a sharp drop in spot CVD pushed BTC to $58,100, and the related OI spike was cleaned up within days. The June 30 move to a new monthly low of $57,800 was short-led instead. Spot selling had already dried up, spot CVD flattened out, and funding briefly dipped, exposing a derivatives-driven decline. Shorts chased the move twice around the $57,800 low.
Options also changed character over the month. Implied volatility moved in a 65% to 35% to 45% pattern. Twenty-five delta skew showed deep put premium for most of June, and the 14-day put/call traded volume ratio rose above 1.0, the highest in a year, showing that hedging remained dominant. By month-end, gamma structure had shifted in a way the report viewed as critical. After the negative gamma concentration slid from $75,000 lower through the month, market makers turned long gamma between two positive gamma clusters at $60,000 and $64,000. That changed hedge flows from volatility-amplifying to volatility-suppressing and implied that the options market was no longer pricing for accelerated downside, but for consolidation inside a $60,000-$64,000 range.
DVOL recovered modestly from historical lows but remained far from panic extremes, which the report said looks more like the early stage of bottom building than the end of the process. For ETH, it highlighted $1,472 as the key on-chain liquidation cluster to watch.
Bottom region, not confirmed bottom
Monera Digital’s overall judgment was that the deep bear market moved from the middle of the clearing phase into deeper water and delivered an initial confirmation of seller exhaustion at month-end. It cited three pieces of evidence: panic had been released to a large degree, with Ahr999 falling to 0.283 and loss-making supply outnumbering profitable supply; stronger hands had returned to net accumulation, with long-term holder supply reaching 88.1%; and market structure changed late in the month, as BTC refused to make a lower low on the day of the Strategy announcement and market makers turned long gamma between $60,000 and $64,000.
Even so, the report said none of the three axes needed for a reversal had been met by month-end. ETF outflows had not stopped, the dollar had not turned lower, and price had not reclaimed key resistance. STH-SOPR also remained 0.14 standard deviations away from the severe-capitulation threshold, while past cycle lows often came with one final spike in capitulation-style volatility.
That is why Monera Digital drew a distinction between a bottom region and a bottom date. June, in its view, delivered an initial confirmation of seller exhaustion. It did not deliver a final confirmation of a cycle low.