
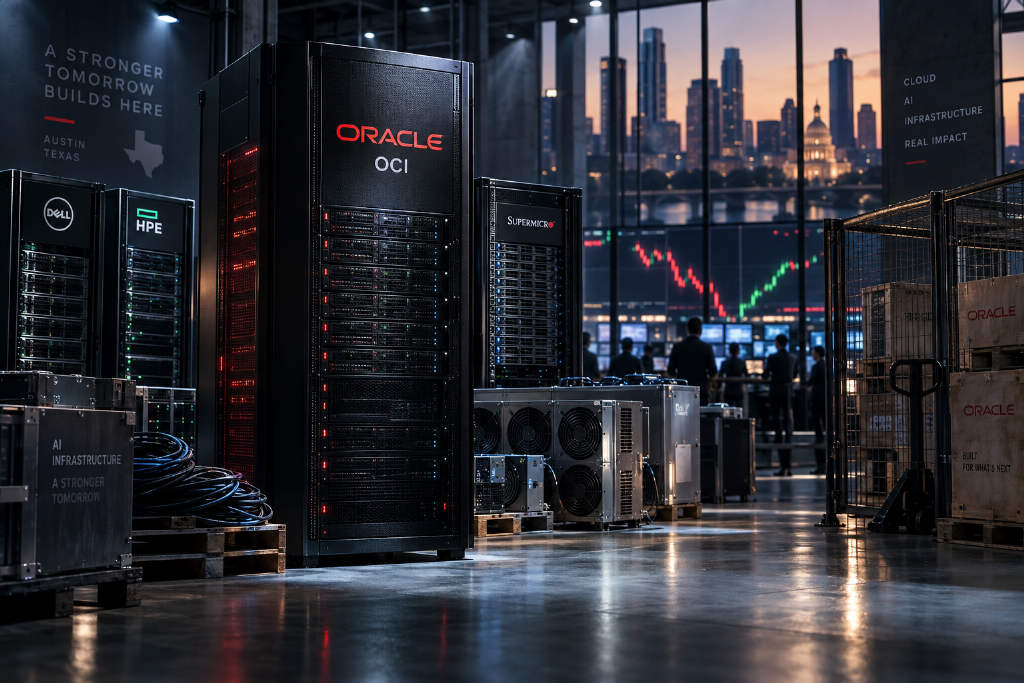
Oracle posted better-than-expected results, but the numbers that sent hardware names higher were not enough to keep Oracle shares in positive territory. On Sept. 11, the first trading day after the company released its latest earnings, Oracle opened 7.5% higher at $164.43 and reached an intraday high of $165.99. The move did not last. The stock fell through the session and closed at $150.28, down 1.74%, with an intraday swing of more than 10%.
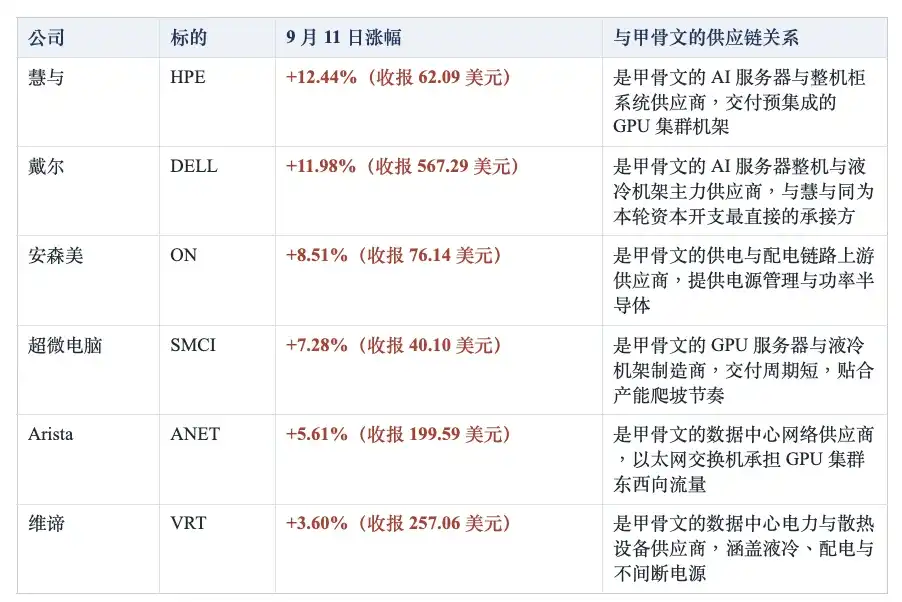
Its supply chain moved the other way. Hewlett Packard Enterprise rose 12.44% and Dell gained 11.98%, making them the top performers in the S&P 500 that day. Super Micro Computer climbed 7.28%, Arista added 5.61%, ON Semiconductor rose 8.51%, and Vertiv advanced 3.60%. Server hardware was the strongest pocket of the market. CoreWeave and Nebius, both AI compute cloud providers that also require heavy capital spending, were up roughly 4% intraday before both turned negative by the close, tracing a pattern close to Oracle’s own move.
$90 billion to $95 billion in capex gave suppliers the cleanest read-through
Oracle released fiscal 2027 first-quarter results after the close on Sept. 10. Revenue came in at $19.345 billion, up 30% year over year and above expectations of about $19.14 billion. Adjusted earnings per share were $1.92, ahead of the $1.74 consensus.
Nearly all of the growth came from cloud. Cloud revenue reached $11.6 billion, up 62%, and accounted for about 60% of total revenue. Within that, Oracle Cloud Infrastructure, or OCI, generated $7.4 billion, up 121%. Traditional on-premises software revenue fell 3%.
Delivery metrics were also strong. Oracle added 850 megawatts of data-center capacity during the quarter, shipped more than 300,000 GPUs, and reported infrastructure utilization of 97.9%. It also said expiring GPU contracts were being renewed or resold at prices about 20% above the original contracts on average. For the full year, Oracle guided to at least $90 billion in revenue and adjusted EPS of $8.1.
The figure that most directly moved supplier shares came from the earnings call. At 5 p.m. Eastern on Sept. 10, Oracle’s CFO said, 「full-year capital expenditures are still expected to be $90 billion to $95 billion, with net cash capital expenditures not exceeding $70 billion.」
That spending has a clear physical destination: racks, switches, liquid cooling systems and power equipment. On Oracle’s income statement and cash flow statement, it shows up as cost. On a supplier’s books, it is revenue. The market’s first response on Sept. 11 was to price in that distinction.
The original report noted that all stock moves and closing prices cited were based on Sept. 11, 2026 closing data. It also said the industry-chain roles assigned to companies were based on public business descriptions. Oracle did not disclose a supplier list, and some companies mentioned may not have a confirmed direct supplier relationship with Oracle.
Why Oracle’s stock rose first and then sold off
The answer was not in the headline earnings beat alone. Investors spent more time on the details behind contract visibility, cash flow quality and financing structure.
One focal point was remaining performance obligations, or RPO. Oracle reported RPO of $664 billion, up $209 billion from a year earlier, and said new AI cloud contracts signed in the quarter exceeded $30 billion. That figure represents contracted revenue that has not yet been recognized.
The MarsBit report argued that the number needs to be separated into at least three layers. First, it is a ceiling on future revenue, not revenue itself, and conversion depends on when capacity is delivered. Second, it says nothing about cost, which means contract size does not translate directly into shareholder returns. Third, its quality depends on counterparty concentration and contract terms. The report said the market broadly estimates that close to half of the $664 billion RPO is tied to a single customer. The larger the order book gets, the more important delivery capacity and customer concentration become.
Free cash flow was another pressure point. Oracle reported fiscal 2027 first-quarter free cash flow of negative $5.4 billion. That was much better than expectations for negative $9.56 billion, but operating cash flow included $11.36 billion in customer prepayments. The report said the cash is real, but economically it is tied to services Oracle still has to deliver, making it a liability rather than already earned profit.
That prepayment structure sits alongside other arrangements, including customers bringing some of their own hardware and suppliers taking part in financing. Those mechanisms do shift part of the funding burden outward. After adjusting for them, net cash outlay was about $18 billion, below the headline capex figure of $28.5 billion. Even so, the central question remains how much cash these fast-growing AI contracts will ultimately leave for shareholders.
Ellison’s sale plan surfaced with earnings, then was canceled
Another overhang came from a filing tied to Oracle Executive Chairman and Chief Technology Officer Larry Ellison, who is 82. According to the report, a 10b5-1 trading plan disclosed alongside the quarterly results showed that Ellison had adopted the plan on June 22 and could sell up to 50 million Oracle shares.
Placed next to a quarter with negative free cash flow, record capex and a recently completed $20 billion share offering, the disclosure was easy for the market to read negatively.
The story changed over the weekend. On Sept. 12, Oracle’s investor relations website published a statement titled Larry Ellison Cancels His Plan to Sell Oracle Stock. It said, 「Larry Ellison, Executive Chairman of the Board and Chief Technology Officer, has canceled his 10b5-1 plan to sell Oracle stock. No Oracle stock was sold under that plan, and he has no other plans to sell any of his Oracle stock holdings.」
Only one day separated disclosure and cancellation. In weekend off-exchange trading after that statement, Oracle shares were at one point up more than 2%.
Around 19x forward P/E looks reasonable, until debt enters the frame
Using Oracle’s fiscal 2027 guidance of at least $90 billion in revenue and adjusted EPS of $8.1, the report put the stock at roughly 19x forward earnings.
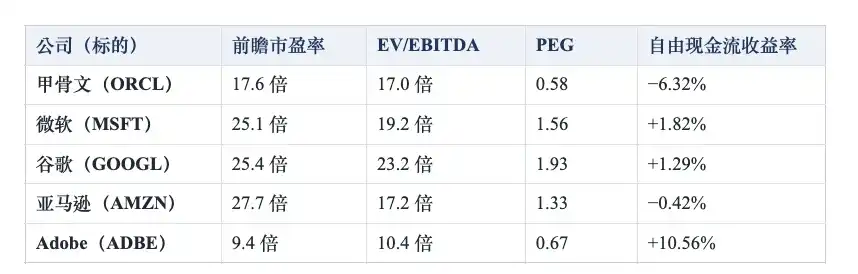
If EPS growth were to remain above 30% from here, that multiple would fall to about 14x one year later and about 11x two years later. Consensus for the following fiscal year points to about $10.97 in EPS, implying roughly 13.7x, close to that math. This is also why Oracle’s PEG was cited at just 0.58, the lowest among peers. For a company with OCI revenue up 121% and RPO up $209 billion in a year, that growth path does not look impossible on paper.
But P/E has an obvious blind spot: the numerator is equity value, not enterprise value, so debt is excluded. Oracle’s net debt has reached $132.1 billion. Its enterprise value stands at $586.5 billion, about 29% above its $454.4 billion market capitalization. On an EV/EBITDA basis, Oracle is around 17.0x, compared with about 17.2x for Amazon and 19.2x for Microsoft. Change the numerator, and the stock looks much less obviously cheap.
The report also said Oracle’s 17.0x EV/EBITDA is below Microsoft’s 19.2x and Alphabet’s 23.2x, and roughly in line with Amazon’s 17.2x, placing Oracle at the lower end of that group. Based on market expectations for fiscal 2027, its EBITDA could rise from about $36.5 billion in the previous fiscal year to about $52.4 billion, which would mechanically push forward EV/EBITDA to a little above 11x.
That metric has its own caveats. Most of Oracle’s $28.5 billion in quarterly capex will become GPU and data-center assets that depreciate over the next several years. Interest expense has already risen from $923 million to $1.428 billion, a gain of more than 50%. For a company getting more asset-heavy while relying on debt financing, adding back depreciation and excluding interest can move two major burdens out of view.
There is also movement on both sides of the ratio. EBITDA growth sits in forecasts. Net debt growth, by contrast, is tied to capex commitments already made. The report said the market expects Oracle’s net debt to climb above $160 billion by fiscal 2028. Even if EBITDA arrives as expected, the decline in the forward multiple may be slower than static math suggests.
AI is shifting software valuations from growth alone to capital efficiency
Sept. 11 also exposed a broader market pattern. Hardware led. Software mostly did not. The report said printed circuit boards and computer wholesalers were among the best-performing industry groups that day, while Adobe fell, and Cloudflare and Rubrik also closed lower.
Adobe, which reported on the same day as Oracle, offered a near-mirror-image case. Its third-quarter revenue was $6.76 billion, up 13%. AI-related annualized recurring revenue grew by more than 150%, and platform users topped 1 billion. The stock still fell because next-quarter guidance did not clear investor expectations.
The contradiction is plain: AI revenue can grow at a triple-digit rate and user numbers can scale into the billions, but if the company’s overall growth rate remains at 13%, the market may not reward it. In the report’s framing, AI is moving the valuation anchor for software companies away from revenue growth and toward capital efficiency. It is also pushing value toward two ends of the chain: the infrastructure layer that actually absorbs capex, and the workflow layer after the model where replacement is harder. The middle layer, where pricing power depends mainly on seat count and subscription increases, is under more pressure.
Oracle and Adobe were presented as examples of those two paths. Oracle is turning itself into an infrastructure company. Its chain is orders, then capacity, then cash. Demand is not the issue. Proof that demand can become free cash flow per share is. The cost is negative free cash flow, higher debt and continued dilution. Adobe remains in software. Its chain runs from free users to habits to willingness to pay. It does not need massive capex and its cash flow remains healthy, but the market still wants stronger evidence that users can be converted into revenue.
That difference helps explain the split market reaction. With Oracle, investors are willing to believe the demand will convert. With Adobe, they see the growth but remain unconvinced that it will sustain at the company level. The report added that if AI models eventually become a cheaper and more commoditized base capability, the decisive layer may not be the model itself, but the editing, collaboration, asset management and delivery workflow that comes after generation. Much of that still happens inside Adobe’s software.
What matters next is not just order volume
For Oracle, the report said several indicators now carry more weight than the headline order total.
- Whether utilization can stay high after hundreds of additional megawatts of capacity come online. If utilization drops as expansion continues, that would suggest buildout is running ahead of realized demand.
- The share of customer prepayments in operating cash flow, and the share of new contracts that use prepayments or customer-supplied hardware. A rising ratio would mean more risk-sharing is being pushed outside Oracle.
- When capex as a share of revenue peaks. The report called this the clearest leading indicator for a turn to positive free cash flow.
- How quickly the quarterly free cash flow gap narrows, and whether management starts giving any timeline for breakeven or positive free cash flow.
- Whether dilution and interest expense are growing faster than operating profit.
- Whether customer concentration in the order book comes down as new contracts are signed, and whether the October investor day provides a more detailed roadmap for delivery and cash flow.
The original article ended with a standard caution that the piece was for reference only and did not constitute investment advice or a product offer. It said the data were current as of Sept. 13, 2026, Eastern Time, and were based on public information.