
WuBlockchain has republished a Q2 2026 review by @agintender that rechecks trading data for centralized exchanges. The piece revisits three questions: a fresh run of Vol/PoR, a fresh run of OI/PoR, and a quarter-over-quarter comparison between Q1 and Q2 to identify which ratios converged and which deteriorated.

The author notes that a similar analysis was published about three months ago using on-chain data to evaluate spot and derivatives activity at several CEXs. That earlier work drew criticism from readers who argued that a single snapshot was not enough, or that incentive campaigns and temporary fee cuts could distort the picture and then fade. This Q2 update is presented as the follow-up test.
Hyperliquid remains the benchmark
The formulas are unchanged:
- Vol/Reserve = 30-day total trading volume ÷ 30 ÷ core reserve assets (BTC + ETH + USDT + USDC)
- OI/PoR = total open interest ÷ core reserve assets
The benchmark remains Hyperliquid, which the author describes as the venue with the highest cost of faking activity. The logic for using it as the reference point was covered in two earlier posts and is not repeated here.
Hyperliquid’s own Q2 figures moved in the opposite direction of the broader industry. TVL rose from $4.88 billion to $6.11 billion, up 25%, while 30-day derivatives volume increased from $206.8 billion to $237.7 billion, up 15%. Because capital grew faster than volume, the benchmark ratio fell from 1.44x to 1.30x. With a 15% tolerance band, the Q2 threshold is set at 1.49x, down from 1.66x in Q1.
The report says it also ran a sensitivity check using both the new Q2 threshold and the old Q1 threshold of 1.66x, to address the objection that lower thresholds can make exchanges look worse by construction.
Reserves shrank across the sector
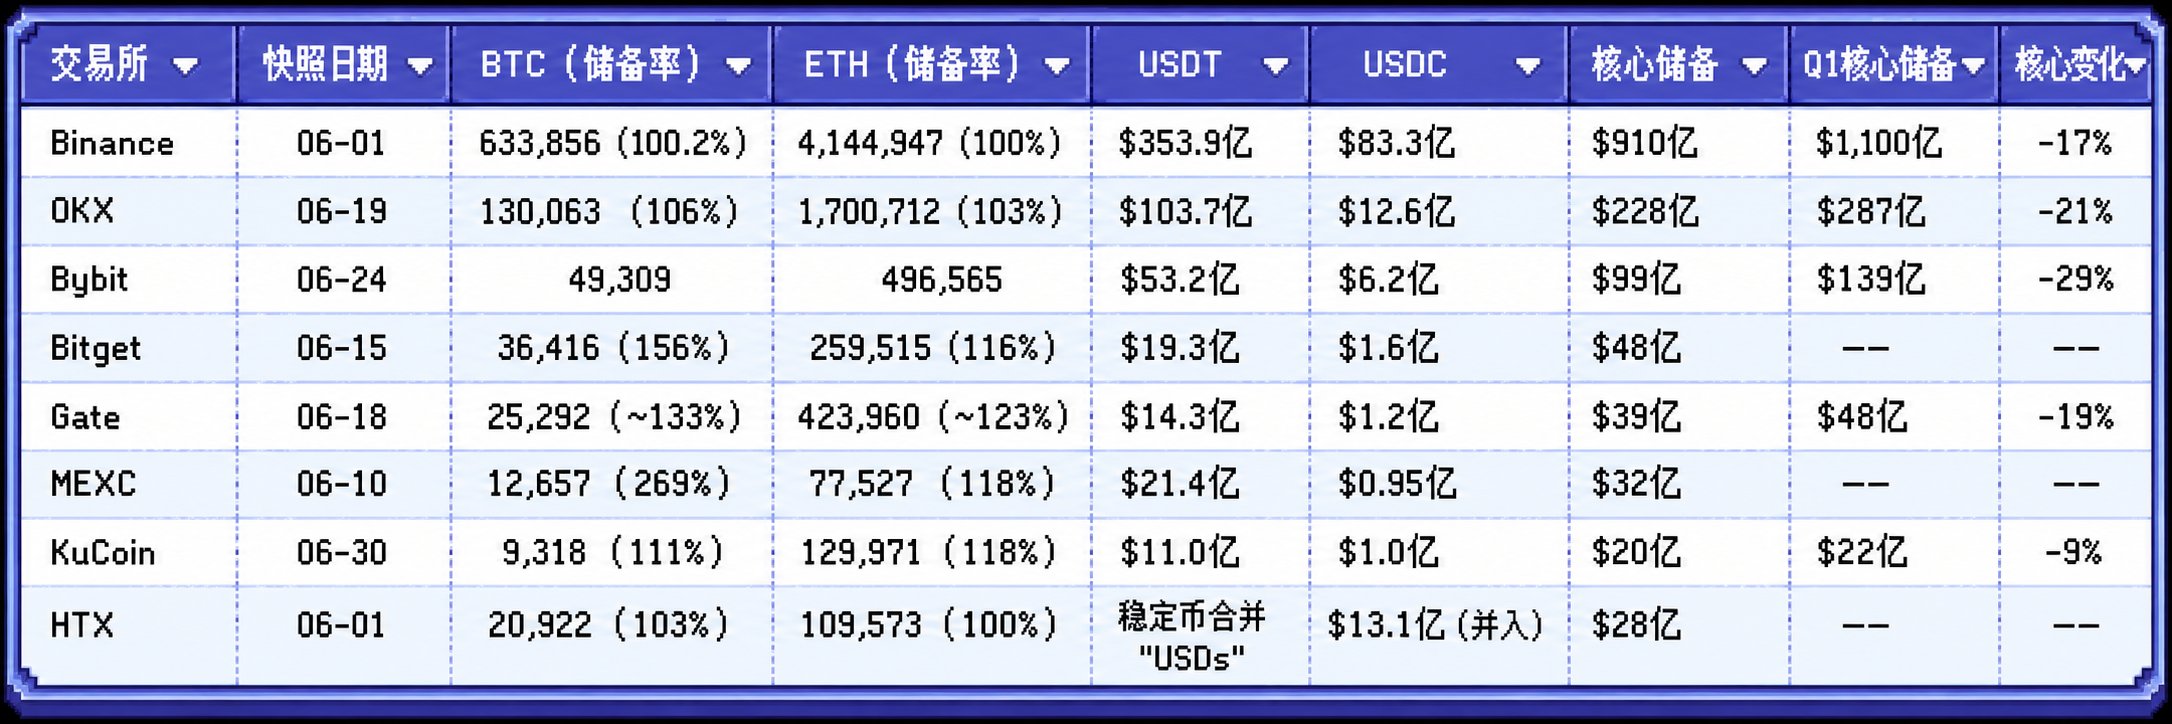
The denominator in both ratios is reserves. The report says all reserve data came from exchange PoR pages using June 2026 snapshots, with BTC marked at $63,001 and ETH at $1,769 for a standardized conversion.

It makes three broad observations.
First, reserves generally declined. Binance was down 17%, OKX 21%, and Bybit 29%. The author ties that to two forces moving in the same direction: lower crypto prices, which reduced the dollar value of coin-denominated reserve assets, and actual capital outflows. The conclusion is that the industry’s capital pool is receding.
Second, Bitget’s excess reserves retreated. In Q1, Bitget’s BTC reserve ratio stood at 237%; in Q2, it fell to 156%. The report says platform-owned BTC was pulled out of the reserve pool by a substantial amount. It frames that as a smaller issue in itself because the assets were the platform’s own funds, but one that matters directly for ratio calculations later in the analysis.
Third, MEXC’s excess reserves barely changed. Its BTC reserve ratio was 269%, almost identical to 270% in Q1. The detail the author highlights is that user BTC deposits on the platform totaled only 4,699 BTC. For an exchange reporting nearly $400 billion in monthly trading volume, aggregate user BTC deposits below 5,000 coins stand out. The report adds that some market participants would argue MEXC is stronger in altcoins, which offers at least a partial explanation.
The study period runs from June 6 to July 6, 2026, covering 30 days. The sources cited are exchange Proof of Reserves pages, CoinGlass, CoinGecko, and DefiLlama. The author also makes clear that this is a sample of eight exchanges rather than a market-wide census, so the findings carry unavoidable error.
Vol/PoR review: which exchanges still sit above the line
For the volume section, the report uses CoinGecko daily series data and converts each day’s figures with that day’s BTC price. It notes that this reflects a source change in methodology. The benchmark used here is 1.30x and the threshold is 1.49x.

Binance: still comfortably low
Binance remained, in the author’s words, the exchange that “does not need explaining.” Its total ratio was 0.59x, meaning each $1 of reserves corresponded to $0.59 of average daily volume. Its derivatives ratio was 0.51x, less than half the benchmark. That was higher than 0.44x in Q1, but the report attributes the increase to a 17% drop in the denominator rather than a surge in the numerator. Spot came in at 0.078x, nearly unchanged from 0.081x in Q1. The reading is that large pools of inactive customer assets remain parked on the platform, which the author treats as a normal pattern for a mature exchange.
OKX: stable and clean
OKX posted a derivatives ratio of 0.93x and a total ratio of 1.01x, roughly $1 of average daily trading for every $1 in reserves. Cross-checking produced a 0% deviation, which the report calls the most solid dataset among the eight exchanges sampled. Reserves fell 21% and volume declined in step, leaving the ratio broadly unchanged.
HTX: below the threshold on volume
HTX’s total ratio was 1.07x, below the threshold. The report flags that self-reported volume appears roughly 50% high in cross-verification, but says that any downward revision would only make HTX look healthier on this measure. Its real issue, according to the author, shows up in OI rather than trading volume.
Bybit: still inside the range, but only just
Bybit recorded a total ratio of 1.42x, one step below the 1.49x threshold. The exchange’s reserves fell 29% in the quarter, the steepest decline in the sample. The report says the ratio rose not because volume was abnormal, but because the denominator collapsed faster. It calls Bybit the clearest case of “denominator risk” right now: not guilty on volume, but vulnerable if reserves continue to leave while trading activity does not retreat in parallel.
KuCoin: a sharp reversal from Q1
KuCoin is presented as the most revealing set of figures in the report. Monthly spot volume fell from $65 billion in Q1 to $32.4 billion in Q2, nearly halving. Its spot ratio dropped from 0.98x to 0.536x, while its derivatives ratio fell from 1.27x to 0.98x, now below the on-chain benchmark. Total ratio landed at 1.52x, just 0.03 above the threshold, which the author says leaves suspicious volume close to zero.
The Q1 analysis had attributed KuCoin’s earlier spot anomaly to trading incentives. With those campaigns fading, the data also came down. The author treats that as a direct confirmation of the original Q1 call.

Bitget: moved from healthy into a gray zone
Bitget’s derivatives ratio increased from 1.33x in Q1 to 1.68x in Q2, and its total ratio reached 1.90x. On the surface, that looks like clear deterioration. The report argues that the move needs to be split into components because the exchange’s BTC excess reserve ratio fell from 237% to 156%, pulling a large portion out of the denominator.
In the author’s framework, a worsening ratio can come from two paths: higher reported volume or lower reserves. Bitget, the report says, is at least half in the second category, meaning platform capital left the reserve pool rather than trading activity alone being inflated. Cross-verification also suggests its volume may be overstated by roughly 30%. If that adjustment is applied, the derivatives ratio would fall back to around 1.2x, near the normal range.
Gate: total ratio jumped from 2.03x to 3.25x
Gate’s total ratio rose from 2.03x in Q1 to 3.25x in Q2. Its derivatives ratio climbed from 1.75x to 2.77x. The report argues that the more difficult part of the picture is this: reserves fell 19%, but trading volume barely moved down at all.
MEXC: spot cooled, derivatives stayed elevated
For MEXC, the Q1 report had linked the exchange’s 2.95x derivatives ratio to trading incentives and zero-fee campaigns. In Q2, that ratio rose again, reaching 3.73x, close to three times the on-chain benchmark. At the same time, its spot ratio did retreat from 0.81x to 0.447x. The author reads that as evidence that spot-side incentives may really have been reduced, while the push shifted toward derivatives.
The conclusion is adjusted accordingly: “This is not a campaign. This is the business model.” The report adds another ratio to drive the point home. With only 4,699 BTC deposited by users, MEXC still produced $354.4 billion in monthly derivatives volume, equivalent to $75 million in monthly derivatives turnover behind every single BTC deposited by users.
OI/PoR review: the stock measure looks even starker
Trading volume is flow; open interest is stock. The author writes that every open contract requires real collateral to be posted. Because CoinGlass had not yet published its Q2 quarterly report when this piece was written, the OI section uses a real-time snapshot from July 4, 2026 rather than a quarterly average, making it different in methodology from the Q1 comparison.

The benchmark here is Hyperliquid’s OI/TVL of 1.16x, calculated as $7.09 billion divided by $6.11 billion.
MEXC: OI caught up with Bybit
MEXC’s open interest stood at $9.69 billion versus $9.64 billion at Bybit. The report points out that an exchange with $3.2 billion in reserves was carrying nearly the same amount of open interest as one with $9.9 billion in reserves. MEXC’s OI/PoR came in at 3.06x, the highest in the entire sample.
The author repeats a line from Q1: “You can fake volume without spending money, but you cannot create OI out of thin air.” Faced with the updated numbers, the report says the possibilities are either that MEXC users are collectively running very high leverage, or that another explanation is needed.
Gate: 2.33x and still rising
Gate’s OI/PoR ratio reached 2.33x, up from 2.25x in Q1. The raw figures cited are $9.07 billion in OI against $3.9 billion in core reserves. In Q1, the report had warned that Gate’s liquidation system could face pressure under extreme market conditions. That sentence is repeated in Q2, with what the author says is stronger emphasis.
KuCoin and HTX: unusually high position-to-volume ratios
KuCoin and HTX share what the report describes as the same odd feature: position-to-volume ratios that are unusually high. KuCoin is at 3.74 and HTX at 4.44. In practical terms, the platforms’ open interest would require three to four days of total trading volume to fully turn over.
For comparison, Binance sits at 0.81 and Hyperliquid at 2.35, with the latter linked by the author to on-chain market-making incentives. When positions are much larger than turnover, the report says, that usually points to one of two things: zombie positions or OI figures that have been cosmetically improved. KuCoin’s OI dimension, meanwhile, stayed fixed at 2.76x. The author’s point is that flow can be easier to smooth than stock.

Quarter-over-quarter comparison: suspicious volume kept growing
Looking at both quarters together, the report compares the amount of suspicious volume above the threshold. A likely objection is that suspicious total volume rose from $295 billion to $519 billion only because the threshold was lowered. The answer given is no. Even if the old Q1 threshold of 1.66x is reused, MEXC and Gate still show suspicious volume in the range of $240 billion and $180 billion respectively.
The report says the real driver is the divergence between shrinking reserves and reported trading activity in a bear market. Capital is leaving, but the reported numbers are not retreating in line, and in some cases still edge higher. That, in the author’s framing, is where the gap becomes visible.
On market share, the real share held by the top three venues rose from 75.6% to 79.3%. The report says bear markets tend to favor concentration, with capital moving toward the pools that appear least likely to run into trouble.
RWA and tokenized equities: hot products, but not enough to change the call
The report also addresses an issue that picked up in Q2: stronger activity in tokenized US stocks and RWA-related trading across crypto exchanges.
It notes that MEXC’s homepage carousel featured SKHYNIX, KIOXIA, and SAMSUNG; Bybit launched a TradFi section with gold, crude oil, and the Nasdaq shown prominently; Gate placed “Stocks” next to Polymarket in its navigation; and Binance kept promoting bstock. The question then becomes whether this burst of RWA and tokenized stock activity can account for the ratio outliers.
The author lists three observations.

First, the scale is real. On active days, aggregate RWA derivatives volume reached $22.3 billion per day. Storage-related stocks were the biggest drivers: SanDisk accounted for about $6.4 billion and SK Hynix for about $4 billion, with the pair representing nearly half of all RWA activity. The report says the DRAM supercycle is now being traded with leverage by global retail users through crypto perpetuals.
Second, RWA does not explain away the elevated ratios. One detail the author calls an interesting coincidence is that Hyperliquid’s own RWA share was 20.6%, almost identical to Binance’s 20.7%. That suggests exchanges trading the same underlying products are seeing roughly similar product mixes rather than one venue being uniquely skewed by RWA.
The report then runs an extreme sensitivity test. If MEXC’s entire 26.2% RWA share is stripped out, its derivatives ratio falls from 3.73x to 2.75x. But if the benchmark is adjusted in the same way by removing Hyperliquid’s 20.6% share, the threshold also drops to 1.19x, leaving MEXC still 2.3 times above the line. Gate shows the same pattern. Its RWA share is 12.1%, and after removal it still remains twice above the threshold.
Third, the denominator effect remains small. Tokenized stock perpetuals use USDT as collateral, which the report says keeps the formula fair. Spot trading in tokenized equities across the whole market reached only $330 million per day, with user holdings smaller still, not enough to distort the core reserve measure.
Methodology and disclaimer
The report closes by repeating that it is based on public data from exchange Proof of Reserves pages, CoinGlass, CoinGecko, and DefiLlama, and does not constitute investment advice.
It also restates three methodological caveats: OI is a real-time snapshot from July 4, 2026 rather than a quarterly average; trading volume reflects exchange-reported data aggregated by CoinGecko; and the exercise samples eight exchanges only, so it should not be read as a full measure of market share across the entire sector.