

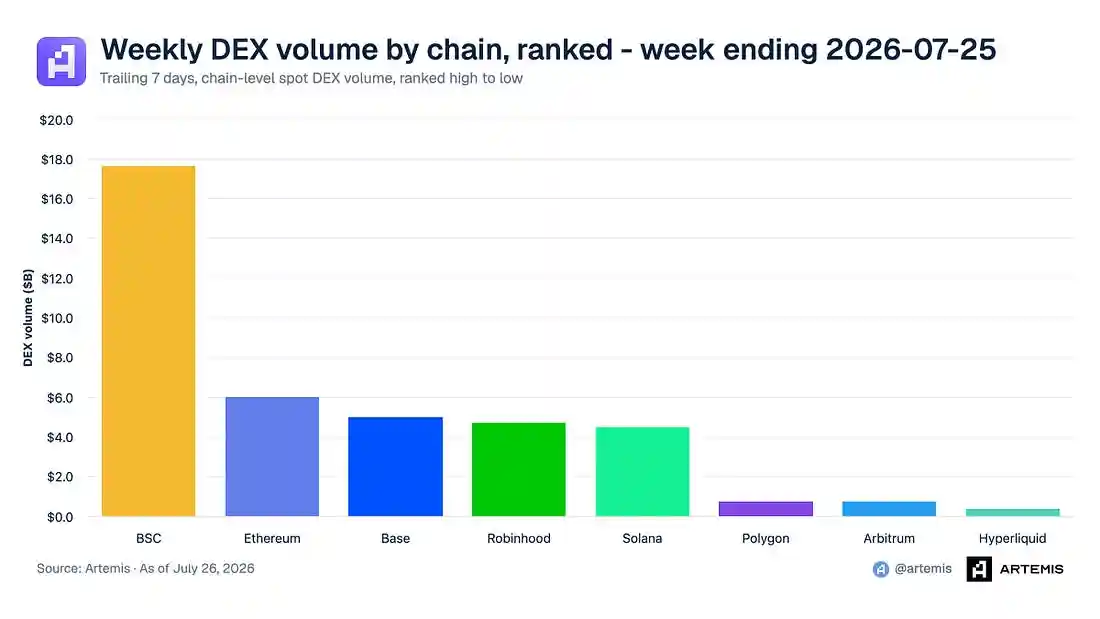
Artemis Analytics said in its weekly review that S&P Dow Jones Indices and Pantera Capital launched the S&P Pantera Digital Asset Index, or SPPDA, on July 20, while Robinhood Chain rose to fourth place in weekly DEX volume between July 18 and July 25 with $4.7 billion, behind BSC, Ethereum and Base, and ahead of Solana.
Market snapshot
Risk assets were largely flat on the surface, but internal positioning shifted sharply, according to the report. Bitcoin closed at $64,444, down 0.7% for the week, while Ether rose 0.6%.
Six straight weeks of ETF outflows came to an end. Spot Bitcoin ETFs recorded net inflows of $75.5 million for July 13-17 and $33.9 million for July 20-24. Total assets under management for Bitcoin ETFs stood at $78.9 billion. Ether ETFs took in about $104 million a week over the past two weeks.
Artemis said the bigger repricing happened in rates. The probability of a Federal Reserve hike for July 28-29 jumped from 10.7% on July 15 to nearly 35% on July 22, a move the report tied almost entirely to the Iran conflict pushing Brent crude close to $100.
Across the tracked assets, crypto and equities/ETFs were mixed, with eq-DELL up about 10%. Semiconductor names bounced back after the previous week. Dell gained 10.4% and Micron rose 8.5%, which Artemis described as a sharp reversal in memory names after Micron had fallen 28% from its June high. Nvidia added 2.0%, outperforming the Nasdaq 100, which fell 1.5%. DeFi tokens also extended gains, with UNI up 2.9% and AAVE up 2.3%.
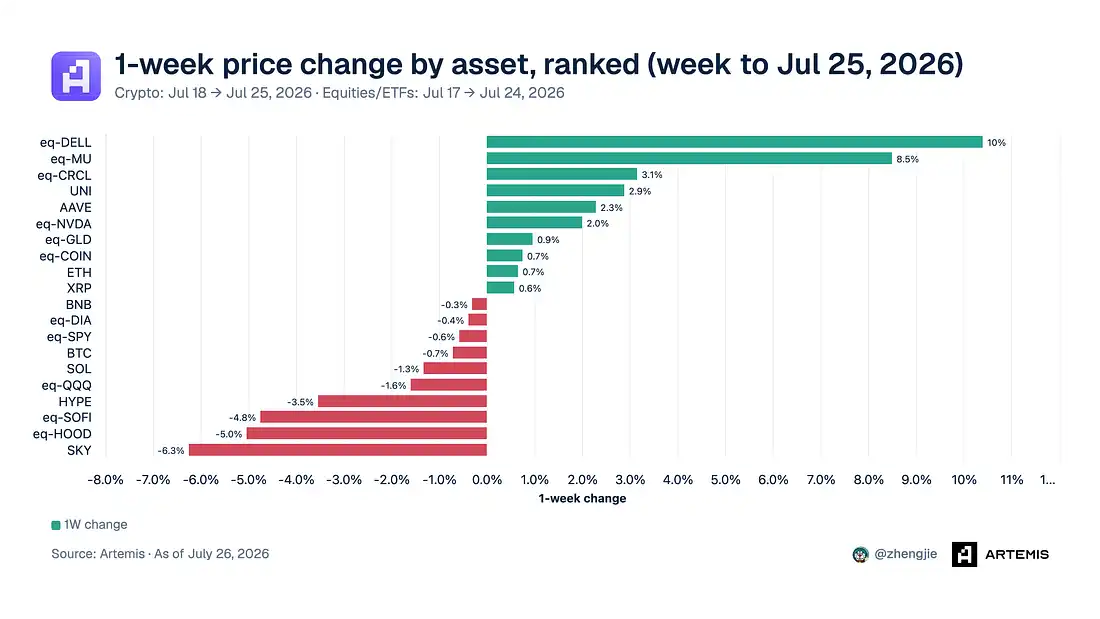
Crypto-linked equities were mixed. Circle rose 3.2% and was the only stock in the group to post what the report called a meaningful gain. Coinbase added 0.75%, but that move still left it having fully given back the 9.6% surge it saw on July 21 after the CLARITY Act.
The weakest area was retail fintech. SKY fell 6.2%, HOOD lost 5.0%, SOFI dropped 4.8% and HYPE declined 3.5%. Bitcoin was down 0.7%, while broader markets barely moved, with SPY down 0.5% and the Dow off 0.3%. Artemis said its basket of stocks rose 0.41% on average, with a median gain of 0.18%.
S&P Pantera Digital Asset Index goes live
S&P Dow Jones Indices and Pantera Capital introduced the SPPDA on July 20. The benchmark includes 18 tokens. It starts with the S&P Cryptocurrency Broad Digital Market Index universe, filters for projects with protocol revenue, and then applies capped market-cap weighting.
Artemis provides the revenue classification, circulating supply and total supply data used in the methodology. Lukka supplies pricing. The top five components by weight are ETH, BNB, SOL, TRX and HYPE.
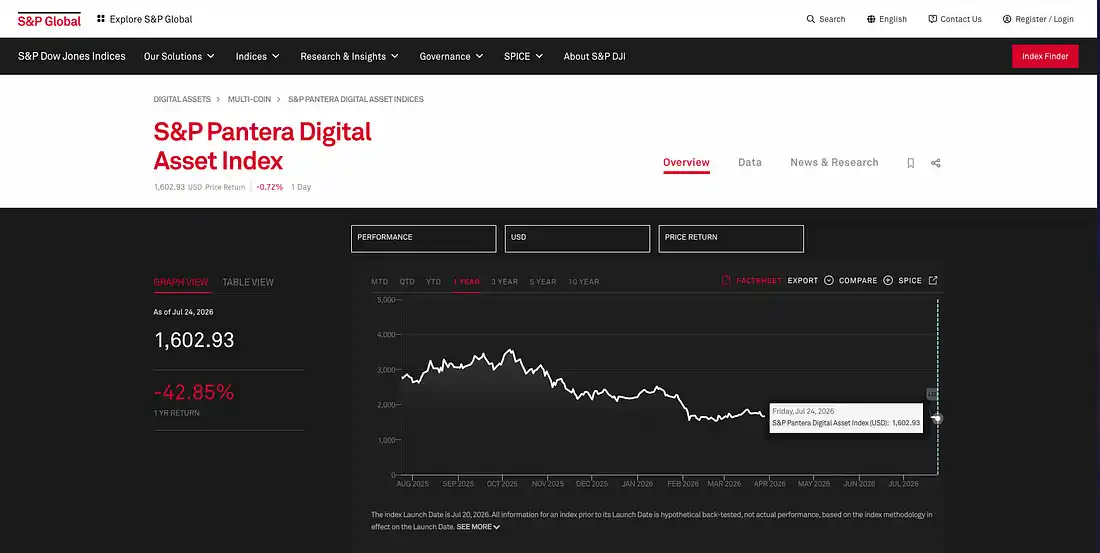
Bitcoin and XRP did not pass the revenue screen. Artemis compared XRP’s roughly $16 million in total burn history over 14 years with the more than $3 billion in annual revenue generated by the 18 included tokens.
S&P framed the index cautiously. The methodology describes protocol revenue as an “objective, rules-based measure of economic activity,” while also stating clearly that it does not imply investment return or cash flow.
In practice, revenue determines eligibility and market capitalization determines portfolio weight. Artemis noted that anyone reading headlines as if the index simply holds the highest-earning crypto assets would be reading it incorrectly.
There is another requirement: at least 30% of a token’s supply must be circulating for it to qualify. The report said that rule runs on Artemis circulating supply data and quietly screens out projects whose valuations rely heavily on still-locked tokens. The first constituent rebalance will be determined on the third Friday of August and take effect on Sept. 18.
Robinhood Chain: what the activity actually looks like
Artemis described Robinhood Chain as an Arbitrum Orbit L2 that launched on July 1. In its framing, Robinhood is renting Ethereum security while operating its own fast, low-cost execution layer.
The stated pitch is tokenized real-world assets, including stocks, ETFs and private equity. Robinhood customers are meant to trade them around the clock, including in places where opening a U.S. brokerage account is not possible. What went live in practice, Artemis wrote, looked more like a memecoin casino, and the chain is now slowly moving toward the RWA tokenization use case it was originally supposed to represent.
For the full week of July 18-25, Robinhood Chain handled $4.7 billion in DEX volume, ranking fourth across chains, behind BSC, Ethereum and Base, and ahead of Solana.
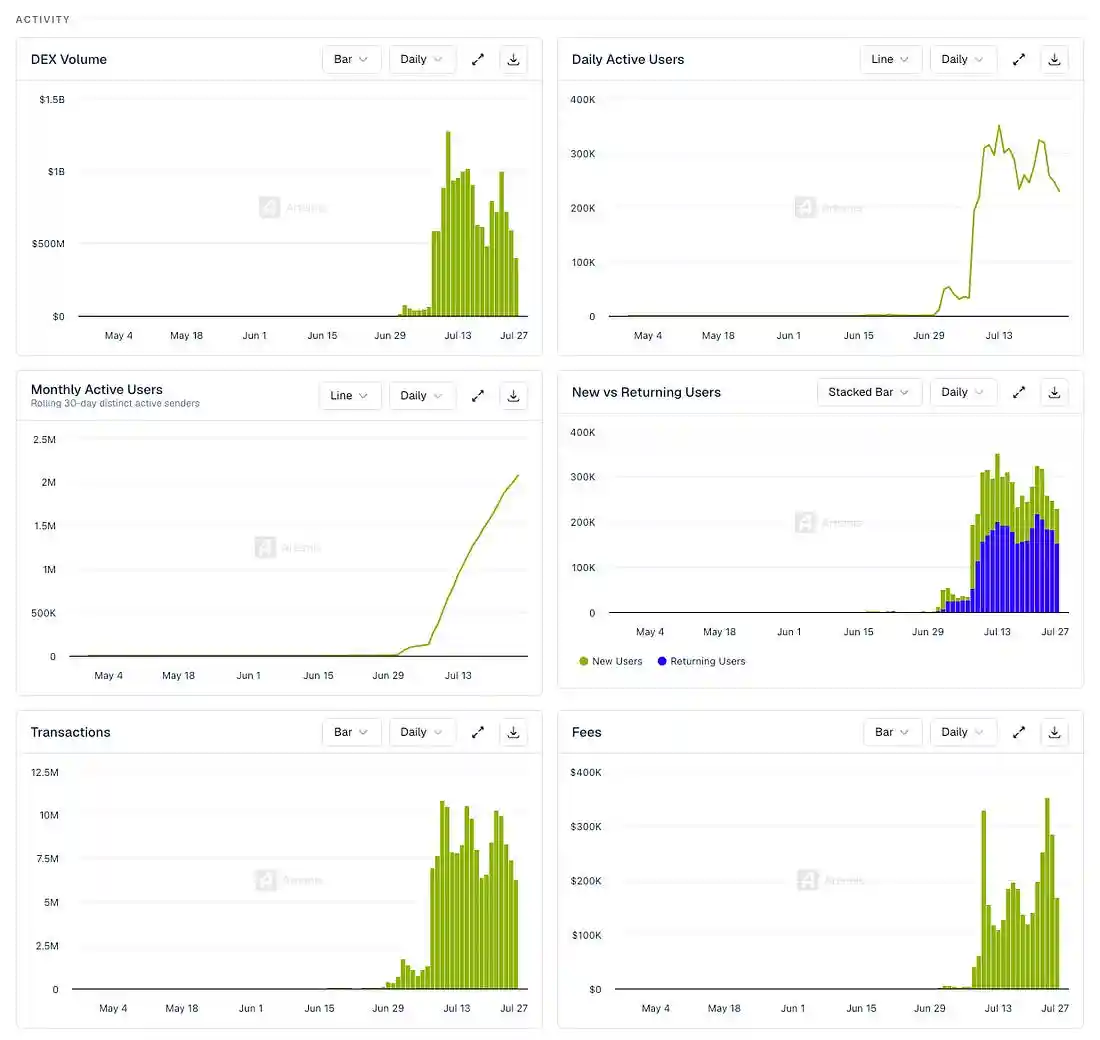
Activity metrics were strong. Daily average DEX volume was about $500 million. Daily average active users came in around 250,000, while monthly active users hit a record 2.1 million. Roughly two-thirds of daily active users were returning users. The chain also averaged about 6 million transactions a day and around $200,000 in daily fees.
TVL composition shows where the capital sits
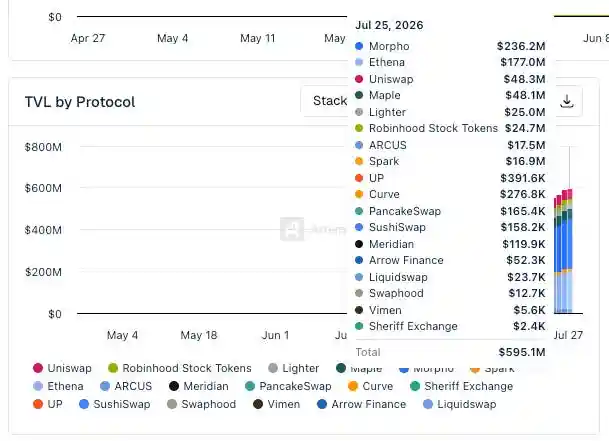
As of July 25, total value locked on Robinhood Chain was $595.1 million, up from almost zero in mid-June. Artemis said the composition matters more than the headline growth.
- Morpho: $236.2 million
- Ethena: $177 million
- Uniswap: $48.3 million
- Maple: $48.1 million
- Lighter: $25 million
- Robinhood stock tokens: $24.7 million
Morpho and Ethena together accounted for 70% of the capital on the chain. Robinhood stock tokens represented just 4.2% of TVL.
Uniswap dominates trading, memecoins still dominate flow
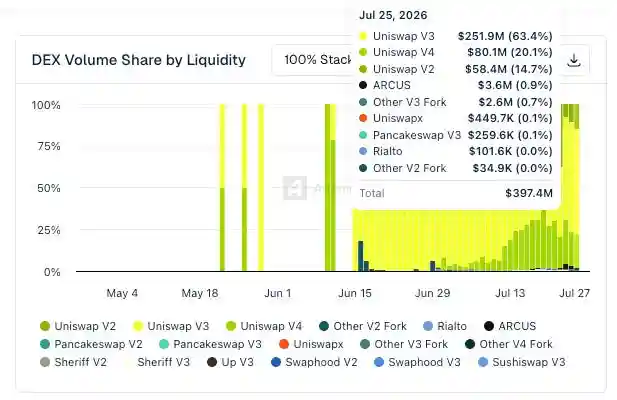
Robinhood Chain recorded $397.4 million in DEX volume on July 25. Of that total:
- Uniswap V3 handled $251.9 million
- Uniswap V4 handled $80.1 million
- Uniswap V2 handled $58.4 million
- All other protocols combined handled less than $7 million
That leaves Uniswap with 98% of the market on the chain, according to the report. Arcus, PancakeSwap and all other forks split the rest.
By pair type, memecoins still made up most of DEX trading:
- Memecoin pairs: $297 million, or 74.7%
- Ether pairs: $64.2 million, or 16.1%
- Robinhood stock-token pairs: $36 million, or 9.1%
- Protocol-token pairs: $219,600, or 0.1%
One launchpad accounts for most of the application-layer activity
On July 25, pons.family dominated launchpad activity on Robinhood Chain.
- It generated $99.7 million out of $155.8 million in launchpad volume, or 64%
- It accounted for 1.3 million of 1.6 million launchpad transactions, or 81%
- It deployed 11,200 of the 17,600 tokens launched that day, or 64%
The second-largest platform, Bankr, generated $13.1 million.
Over seven days, pons.family produced $7.86 million in total fees on $826 million in volume. During the same period, total chain gas fees were about $1.51 million. Artemis said application-layer revenue was roughly five times that of the L2 itself.
The use case Robinhood built for remains small, but it is growing quickly
Total on-chain tokenized market value on Robinhood Chain reached $24.8 million. The breakdown was:
- Stocks: $19.1 million
- Private equity: $1.9 million
- ETFs: $1.5 million
- Commodities: $1.2 million
- U.S. Treasuries: $800,100
That total is about 4.5 times the roughly $5.5 million recorded on June 29, in less than one month. Holders of tokenized equities rose from 29,407 to 48,470 within five days. Stock-token pairs now account for 9.1% of DEX volume, or about $36 million a day, while memecoins remain at 74.7%.
Artemis’ conclusion was that Robinhood built distribution, but third parties captured the economics. Morpho and Ethena hold deposits. Uniswap clears the trading. pons.family collects fees. Robinhood earns roughly $78 million a year in base fees.
The report described this as an example of the “fat app, thin chain” thesis playing out with the income statement of a public company attached.
Charts of the week and other items on Artemis’ radar
One chart in the weekly note showed Hyperliquid open interest reaching a record $11.4 billion on July 24. Another showed Ether ETF net inflows of about $104 million over the past two weeks, while Bitcoin flows were more volatile.
The report also listed several additional developments:
- The London Stock Exchange announced LSE 24 on July 21, a 24/5 trading venue that supports native access for AI agents and on-chain settlement. Two days later, the U.S. Securities and Exchange Commission said it would hold a roundtable on 24-hour U.S. equity trading on Sept. 17.
- Strategy sold $263.5 million of MSTR stock between July 13 and July 19, went a fourth straight week without buying Bitcoin, and raised its dollar reserves to $3.225 billion against roughly $1.76 billion in annual preferred stock and interest obligations.
- Nine companies, including Strategy, BlackRock, Coinbase and Galaxy, pledged $15 million over three years for post-quantum Bitcoin research. More than 7 million BTC sit in outputs with exposed public keys.
- Regulators missed the July 18 rulemaking deadline under the GENIUS Act. None of the six agencies issued final rules, pushing full implementation to Jan. 18, 2027, while stablecoin supply still grew 18.6% to $308.1 billion.
- PayPal’s board formally rejected a $60.50-per-share bid from Stripe and Advent, hired Goldman Sachs and Evercore, and was seeking a price closer to $70 ahead of earnings on July 28.
- The CLARITY Act still has not seen a cloture motion filed, with the Aug. 7 recess serving as the key date to watch.