

Jim Paulsen says the S&P 500 Low Volatility Index has done something over the past six months that it had not done before: it has risen on average on days when the S&P 500 falls and declined on average on days when the S&P 500 rises. In his reading of data back to 1990, that kind of signal has often pointed to weaker performance ahead for both the broader stock market and technology shares.
The piece, translated by TechFlow, frames the move as a sign that investors are caught between two anxieties at once. One is fear of missing out, or FOMO. The other is fear of not getting out in time, which the article calls NBO. Paulsen argues that the market is not being driven by simple bullishness or bearishness, but by a mix of both impulses pulling capital in opposite directions.
Why the low-volatility index stands out now
The S&P 500 Low Volatility Index tracks the performance of the 100 least volatile stocks in the S&P 500. According to the article, those names tend to be defensive shares with traits such as stable earnings, safer dividends, high quality, and lower price beta. Under normal conditions, low-volatility stocks usually rise less when the S&P 500 is advancing and fall less when the benchmark is under pressure.
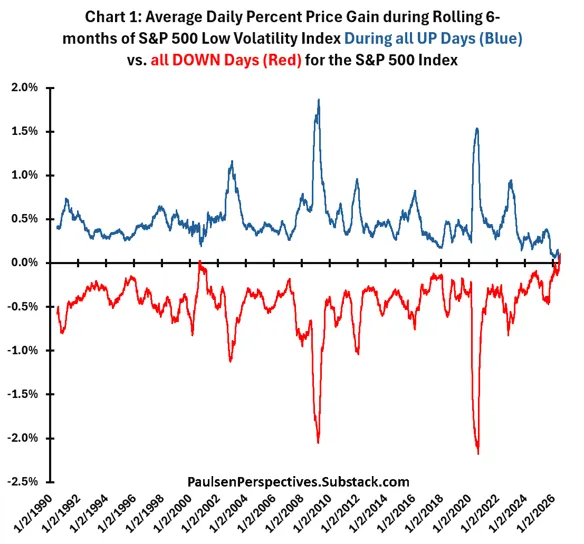
That pattern has broken down in the latest six-month window. Paulsen writes that low-volatility investing has not merely lost less on down days. It has posted average gains when the S&P 500 fell. On up days for the broader index, these stocks did not just lag. Their prices, on average, actually declined. He describes that as a first in the historical record covered in the article.
His interpretation is that this reflects a market in which investors buy higher-risk stocks and sell low-volatility names on strong days, then reverse course when the market weakens. In that setup, the same investors do not want to miss AI-driven upside, but they are also increasingly uneasy about valuation, concentration, and exit timing.
A comparison with data since 1990
Chart 1 in the article shows the average daily percentage price change in the S&P 500 Low Volatility Index over rolling six-month periods, split between all S&P 500 up days and all S&P 500 down days since 1990. Paulsen says that in almost every rolling six-month period, the average change for the low-volatility index was positive when the S&P 500 was up and negative when the S&P 500 was down.
He notes that, aside from the current period, only 2000 briefly showed an unusual reading of its own, but the article says there had never been a case in which the low-volatility index posted a positive average return during S&P 500 down days like it has now. In other words, the latest six months stand apart from anything else in the data: the low-volatility index has risen on average across all S&P 500 down days and fallen on average across all S&P 500 up days.
Paulsen says that could reflect a milestone, or at least very rare, shift in investor psychology. His explanation is the FOMO and NBO mix.
The key spread has turned negative
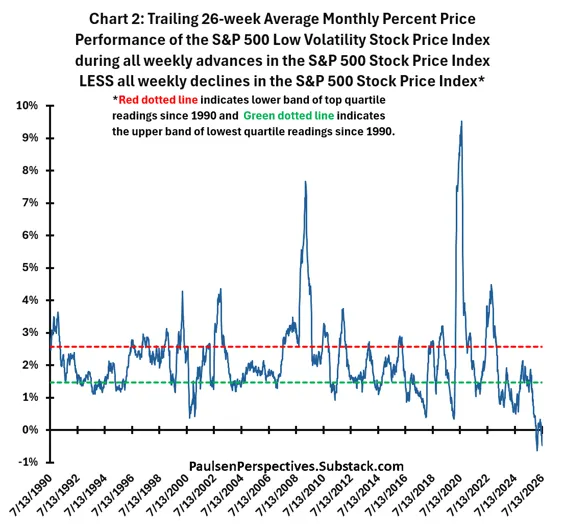
Chart 2 looks at the same behavior from another angle. It measures the difference in the low-volatility index’s average performance over the past 26 weeks during S&P 500 up weeks versus S&P 500 down weeks. That is effectively the gap between the lines shown in Chart 1. According to the article, that spread is now uniquely negative, meaning the low-volatility index has gained less during rising market periods than it has during falling market periods.
Paulsen writes that while the spread has not turned negative in the same way before, it has often fallen into its lowest historical quartile near several major market peaks. The dates cited in the article are mid-2000, 2007, 2018, early 2020, and late 2021. By contrast, the spread has often surged into its top quartile near important market lows, including early 1991, late 2002, March 2009, mid-2020, and late 2022.
What the signal has meant for future S&P 500 returns
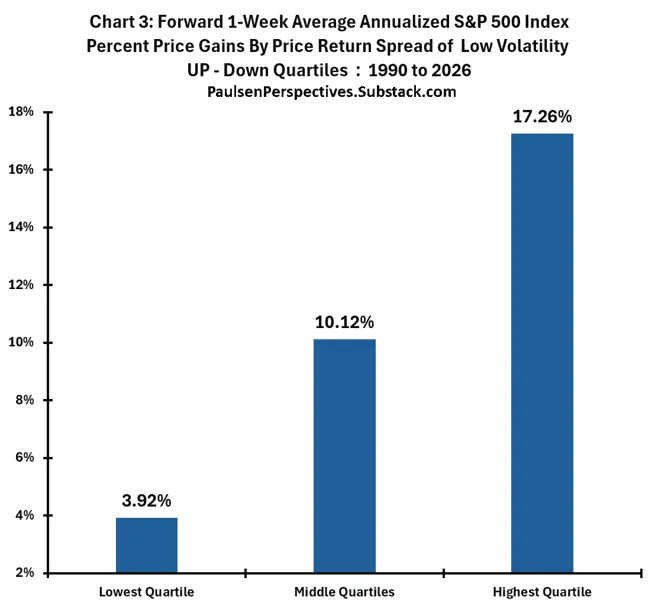
Paulsen then links that spread to forward market performance. In Chart 3, using data since 1990, he says the S&P 500’s future one-week average annualized price gain has been highly sensitive to the quartile of the low-volatility spread. When the spread was in the top quartile, the S&P 500’s future one-week average annualized price gain was 17.26%. When it was in the middle two quartiles, the figure fell to 10.12%. When the spread was in the bottom quartile, the future one-week average annualized gain dropped to 3.92%.
His conclusion is that the relative performance of low-volatility investing in rising and falling markets has long mattered for the S&P 500’s near-term path. When low-volatility investing holds up much better in rising markets than in falling ones, the benchmark has generally produced solid returns. When low-volatility investing does better on down-market days than on up-market days, later performance for the S&P 500 has usually been much weaker.
He also treats the indicator as a proxy for investor psychology. In his telling, when low-volatility investing performs far better in falling markets than in rising ones, investors are placing more weight on capital preservation and are more worried about not getting out in time. The current configuration goes a step further: low-volatility prices are negative on up days because FOMO pushes investors toward more aggressive alternatives, and positive on down days because declines revive the fear of being trapped.
Sector implications: old economy stronger, tech and communication services weaker
Chart 4 compares the performance of the S&P 500’s 10 major sectors since 1990, excluding real estate because of its shorter history, when the low-volatility spread sat in the bottom quartile versus the upper three quartiles. Paulsen says that, apart from utilities, the bottom-quartile environment has been especially favorable for old economy sectors. New economy sectors, which he defines here as technology and communication services, have usually performed much better when the spread was in the upper three quartiles.
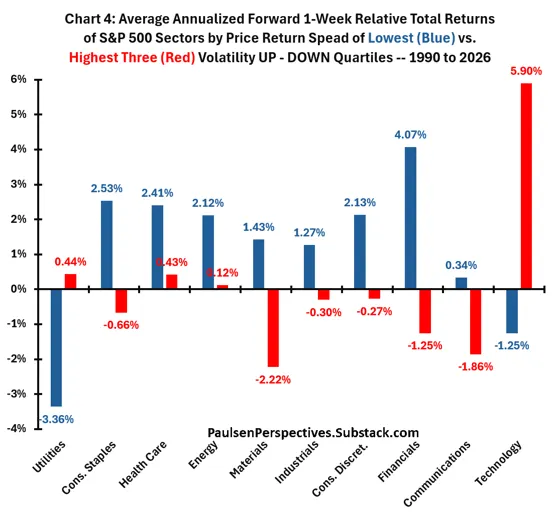
Based on that history, he says that if the low-volatility spread stays in the bottom quartile, investors should not only expect weaker S&P 500 performance, but may also want to consider higher exposure to old economy sectors and take a more cautious stance on overweight positions in technology and communication services.
Paulsen’s view on the current bull market
He closes by arguing that this is the first real blemish in the new economy trade during the current bull market. Technology and communication services are still leading equities and have recently drawn strong support from the AI narrative, but market volatility has risen. The article points to a near-20% drop in the S&P 500 in spring 2025 and a near-10% decline in the first quarter of 2026 as evidence.
At the same time, he says earnings, especially for new economy companies, remain strong. Even so, the performance of S&P 500 technology shares and the Mag 7 index since mid-2024 has only been slightly better than the overall market. Over the past year, broader market segments such as small caps, value stocks, and international equities have also moved closer to new economy stocks in relative performance.
On sentiment, the article says CNN’s Fear & Greed Index is slightly below average, while the AAII sentiment index is slightly above average. Paulsen’s bottom line is that investors do not want to miss the AI trade, but many are increasingly uneasy about high valuations, concentrated positioning, and aggressive assumptions for future earnings. With that backdrop, the performance spread between low-volatility stocks on up days and down days has turned negative for the first time, and he says that may be a reason for greater caution in the months ahead.