

The S&P 500 Low Volatility Index has done something over the past six months that, according to Jim Paulsen, has not shown up in the historical record since 1990: it has, on average, risen on S&P 500 down days and fallen on S&P 500 up days. In the Odaily article translated by TechFlow, Paulsen says the move points to a market driven by two fears at the same time — fear of missing out on the AI-led rally and fear of not getting out in time.
His broader argument is that this is more than a defensive pocket outperforming in a shaky tape. Historically, he writes, this kind of behavior from low-volatility stocks has often served as a warning sign for both the broader equity market and for technology-heavy leadership.
What the low-volatility index tracks
The S&P 500 Low Volatility Index measures the performance of the 100 least volatile stocks in the S&P 500. Those names usually share defensive traits: higher quality, steadier earnings, safer dividends, and lower price beta.
The index is built to do two things. It tends to lag in strong up markets, and it tends to lose less in down markets. That makes it a natural home for investors who still want equity exposure but are uneasy about being unable to exit at the right time.
Under normal conditions, that means the low-volatility index usually posts positive average price changes on S&P 500 up days, though with smaller gains than the benchmark, and negative average price changes on S&P 500 down days, though with smaller losses. Paulsen says the past six months have broken that pattern.
An unprecedented reversal in the last six months
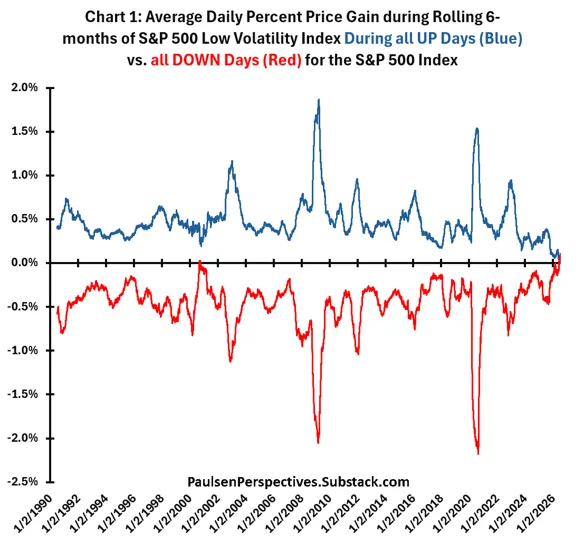
In chart 1, Paulsen looks at the average daily percentage price change of the S&P 500 Low Volatility Index over rolling six-month periods since 1990, split between all S&P 500 up days and all S&P 500 down days.
He writes that in almost every rolling six-month period, the average price change for the low-volatility index was positive when the S&P 500 rose and negative when the S&P 500 fell. Outside the current period, he says only a brief episode in 2000 hinted at an abnormal reading, and even that did not match what is happening now.
The current stretch is different because both relationships have flipped at once. Over the last six months, the low-volatility index has averaged gains on all S&P 500 down days and losses on all S&P 500 up days. Paulsen calls that unique relative to any other period since 1990.
His explanation is that investors are not acting out of simple optimism or simple fear. On up days, money chases higher-risk assets and low-volatility stocks get sold to fund that move. On down days, those same investors buy back low-volatility names to protect capital. Put together, that creates the unusual pattern of low-volatility stocks falling when the market rises and rising when the market falls.
FOMO and NBO as the market’s two competing impulses
Paulsen describes the setup with two labels: FOMO, fear of missing out, and NBO, fear of not getting out.
If the market were being driven by one-sided bullishness, low-volatility stocks would mostly lag. If it were being driven by heavy risk aversion, low-volatility stocks would mostly lead. But when investors are trying to participate in the AI narrative while also worrying about stretched valuations, concentrated positioning, and aggressive earnings expectations, low-volatility stocks can be sold on rallies and bought on declines.
That is why Paulsen treats the index as a proxy for investor psychology. Investors have not abandoned risk, but their focus on capital preservation has risen enough to produce a split market response.
The spread between up periods and down periods has moved into rare territory
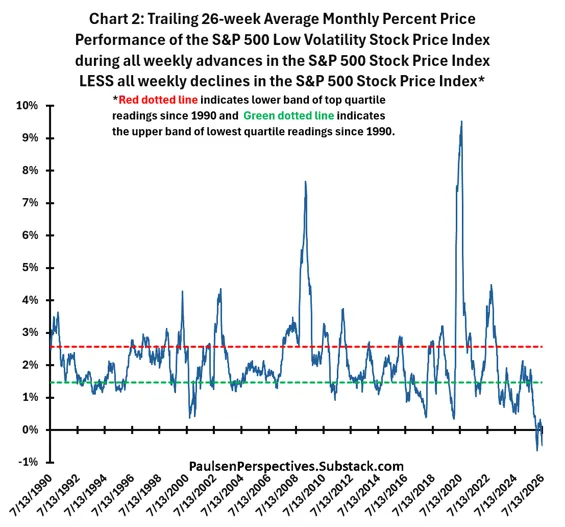
Chart 2 approaches the same issue from a different angle. It tracks the difference in average performance for the low-volatility index over the past 26 weeks between all S&P 500 up weeks and all S&P 500 down weeks — effectively the gap between the two lines in chart 1.
Paulsen says that spread is now uniquely negative. In other words, the low-volatility index has performed worse during periods when the S&P 500 is rising than during periods when the S&P 500 is falling. He says the historical record has not shown a negative reading like the one seen today.
He adds that while the spread has never been as negative as it is now, readings in the lowest historical quartile have appeared near several major market peaks, including mid-2000, 2007, 2018, early 2020, and late 2021. By contrast, the spread has often pushed into the highest quartile near important market lows, including early 1991, late 2002, March 2009, mid-2020, and late 2022.
Historical returns weaken sharply when the spread falls into the bottom quartile
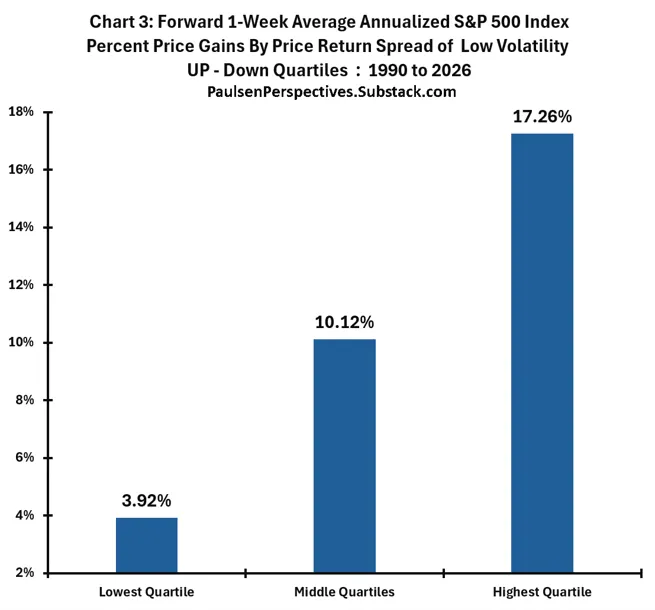
Chart 3 links the signal to forward returns for the S&P 500. Based on Paulsen’s data set going back to 1990, the average annualized one-week price gain for the S&P 500 has been highly sensitive to which quartile the low-volatility spread falls into.
- When the spread is in the top quartile, the S&P 500’s average annualized one-week price gain is 17.26%.
- When the spread sits in the middle two quartiles, the average annualized one-week gain drops to 10.12%.
- When the spread is in the bottom quartile, the average annualized one-week price gain falls to 3.92%.
Paulsen’s takeaway is straightforward. When low-volatility investing performs much better in rising markets than in falling ones, the S&P 500 has usually gone on to deliver firmer returns. When low-volatility investing does relatively better in down markets than in up markets, later index performance has tended to struggle.
Sector read-through: old economy groups look better than tech in this setup
Chart 4 extends the analysis to the S&P 500’s 10 major sectors. Paulsen notes that real estate is excluded because its history is shorter.
His historical comparison shows that when the low-volatility performance spread sits in the bottom quartile, the setup has been especially favorable for older-economy sectors across the S&P 500, with utilities as the main exception. New-economy groups — especially technology and communication services — have generally done much better when the spread sits in the upper three quartiles.
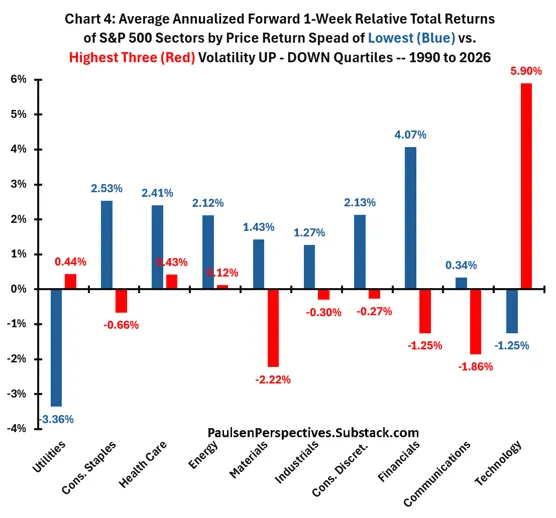
That leads to a sector-level implication in the article: if the low-volatility spread remains in the bottom quartile, investors should not only brace for weaker S&P 500 performance, but also be more careful about overweight positions in technology and communication services and think about adding exposure to older-economy sectors.
Paulsen’s closing view on the current bull market
In the final section, Paulsen places the signal in the context of the current U.S. equity cycle. He says this is the first real blemish in the new-economy trade during the present bull market.
Technology and communication services still lead the market, and he says they have continued to benefit from the AI story. But volatility has increased. The article cites an almost 20% drop in the S&P 500 in spring 2025 and another decline of nearly 10% in the first quarter of 2026.
At the same time, earnings — especially from newer-economy companies — remain strong, yet S&P 500 technology stocks and the Mag 7 index have only slightly outperformed the broader market since mid-2024. Over the past year, broader market segments such as small caps, value stocks, and international equities have also performed more closely to new-economy stocks, which Paulsen says is a first for this bull run.
The article adds that sentiment gauges are not showing outright extremes. CNN’s Fear & Greed Index is slightly below average, while the AAII sentiment index is slightly above average.
Paulsen’s conclusion is that investors do not want to miss the chance that AI changes the world, but many are also becoming more uneasy about high valuations, concentrated holdings, and aggressive assumptions for future earnings. In his view, that is what pushed the spread between low-volatility performance on up days and down days below zero for the first time on record. If history is any guide, he says, the next few months may call for more caution.