

State Street Investment Management said in its July Monthly Gold Monitor that it is maintaining its target for gold to reach $5,000 per ounce by early 2027, even after spot gold dropped 11.7% in June and repeatedly tested support around $4,000 an ounce.
The report did not present that target as a clean upside path. Silver fell 22.2% in June, Bitcoin fell 20.4%, and U.S.-listed gold ETFs saw about $5.3 billion in net redemptions during the month. Rate expectations also moved against gold: the U.S. OIS curve is now pricing in about 1.5 rate hikes in 2026, compared with expectations for two to three rate cuts back in February.
Even so, State Street argued that the sharp drop has not changed the market structure that has supported gold in recent years. Central banks are still adding to reserves, fiscal and debt pressures are still climbing, and demand from China and the broader Asia-Pacific region is still absorbing part of the outflows from Western investors. In its base case, the firm still assigns a 70% probability that gold trades in a $4,750-$5,500 range over the next six to nine months. It raised the probability of a more conservative consolidation scenario to 25%, with a range of $4,000 to $4,750.
$4,000 is support, but not necessarily the bottom
State Street said the $4,000 level now faces a three-way test from technical signals, ETF flows and rate expectations.
After the June sell-off, U.S.-listed gold ETFs recorded about $5.3 billion in net redemptions. North American investors had put a record seasonal $11.5 billion into gold funds in January and February, but over the past four months they then liquidated $18.7 billion. The report said that points to weakening tolerance among Western investors for gold at elevated levels.
Regional flow data in the report show the split clearly. North America posted net outflows of $18.7 billion over the past four months, while China saw $5.9 billion of net inflows this year and Asia-Pacific posted about $12.6 billion of net buying in the first half.
Rate pressure is more immediate. Rising real yields and a stronger dollar increase the opportunity cost of holding gold. State Street also noted that money market fund assets have climbed to $7.9 trillion, making cash itself more attractive.
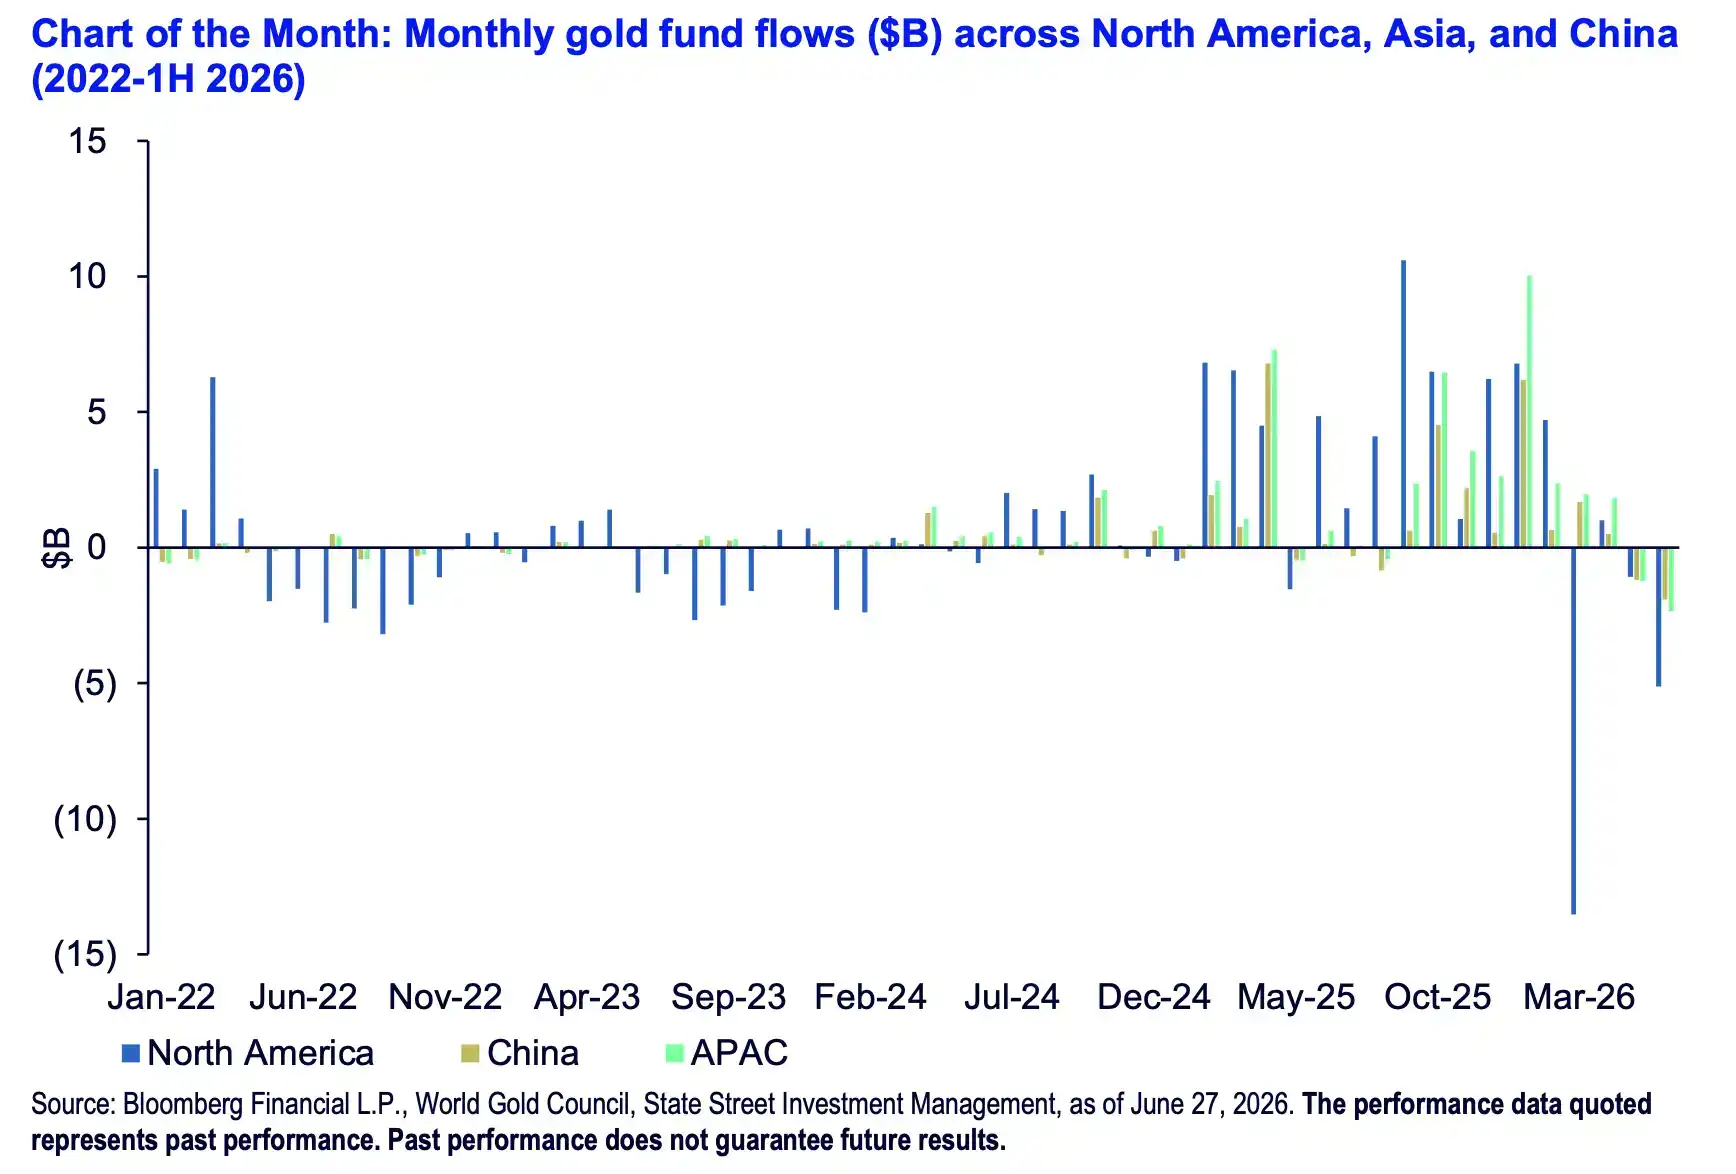
That is why the firm did not dismiss the risk of further downside in the short term. It placed strong support in a $3,750-$4,000 range and raised the probability of a $4,000-$4,750 consolidation scenario to 25%. Bank of America technical analyst Paul Ciana also recently said gold may still test support around $3,600, though he added that pullbacks at lower levels could offer staged buying opportunities for longer-term investors.
The $5,000 case still rests on central bank buying
State Street said the most stable source of demand on the bullish side remains central banks.
World Gold Council data showed that global central banks bought a net 244 tonnes of gold in the first quarter of 2026. State Street said that was up 17% from the previous quarter, up 3% from a year earlier, and 8% above the five-year quarterly average. It expects full-year 2026 net central bank buying to come in between 680 and 820 tonnes, with a base forecast of 765 tonnes. If that happens, it would mark the 17th straight year of net purchases since the global financial crisis.
The firm said this type of demand does not have to push prices higher every day to matter. It provides steadier buying support near the bottom of the market. Central bank purchases are typically reserve allocation decisions rather than short-term trades, with the aim of reducing concentrated exposure to the U.S. dollar and U.S. Treasuries while adding an asset that does not depend on an issuer’s credit.
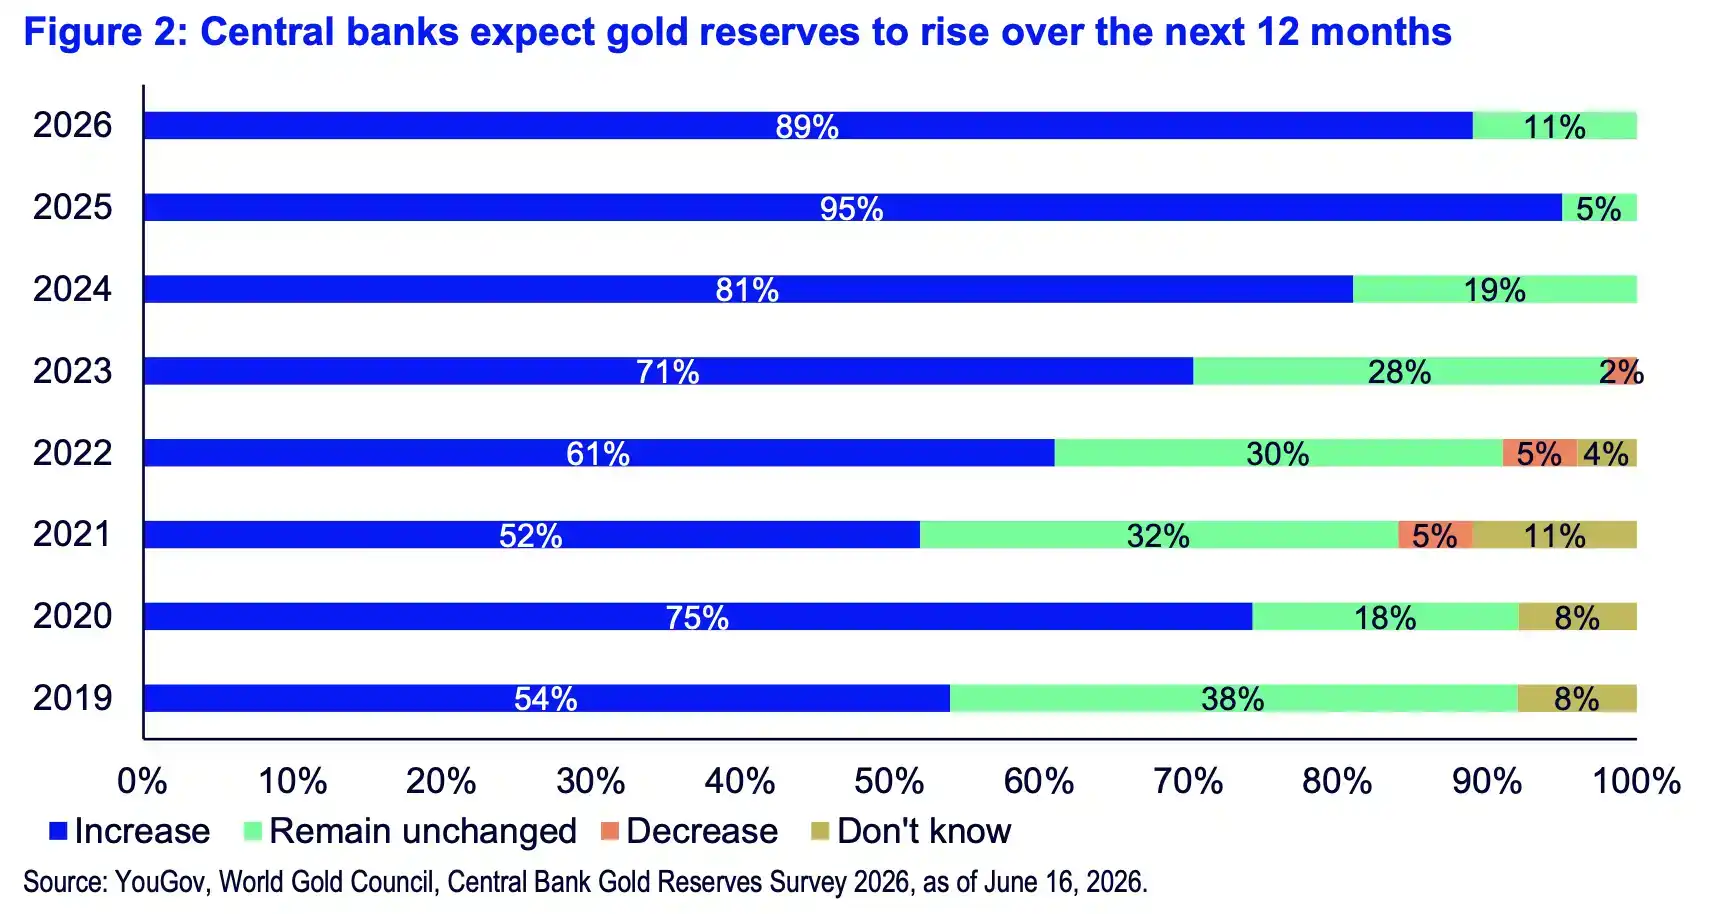
A 2026 World Gold Council survey on central bank gold reserves reinforced that view. Among surveyed central banks, 89% expect global gold reserves to rise over the next 12 months, 45% expect their own institution to add gold, 84% expect gold to account for a larger share of total reserves over the next five years, and 74% expect the share of dollar reserves to fall.
Specific buyers are still active. The report said Poland bought 14 tonnes in April, taking its year-to-date purchases to 45 tonnes. The People’s Bank of China had added 10 tonnes by May, bringing its holdings to 2,332 tonnes after 19 consecutive months of gold purchases at that point.
The broader macro backdrop has not eased either. In the first half of 2026, total global debt rose to $353 trillion, with government debt making up close to one-third. State Street’s argument is that as long as fiscal deficits, inflation impulses and reserve diversification demand persist at the same time, demand for gold as a monetary hedge is unlikely to disappear because of a single correction.
Gold’s share in reserves has moved above U.S. Treasuries
The longer-term shift highlighted in the report is happening inside official reserve portfolios.
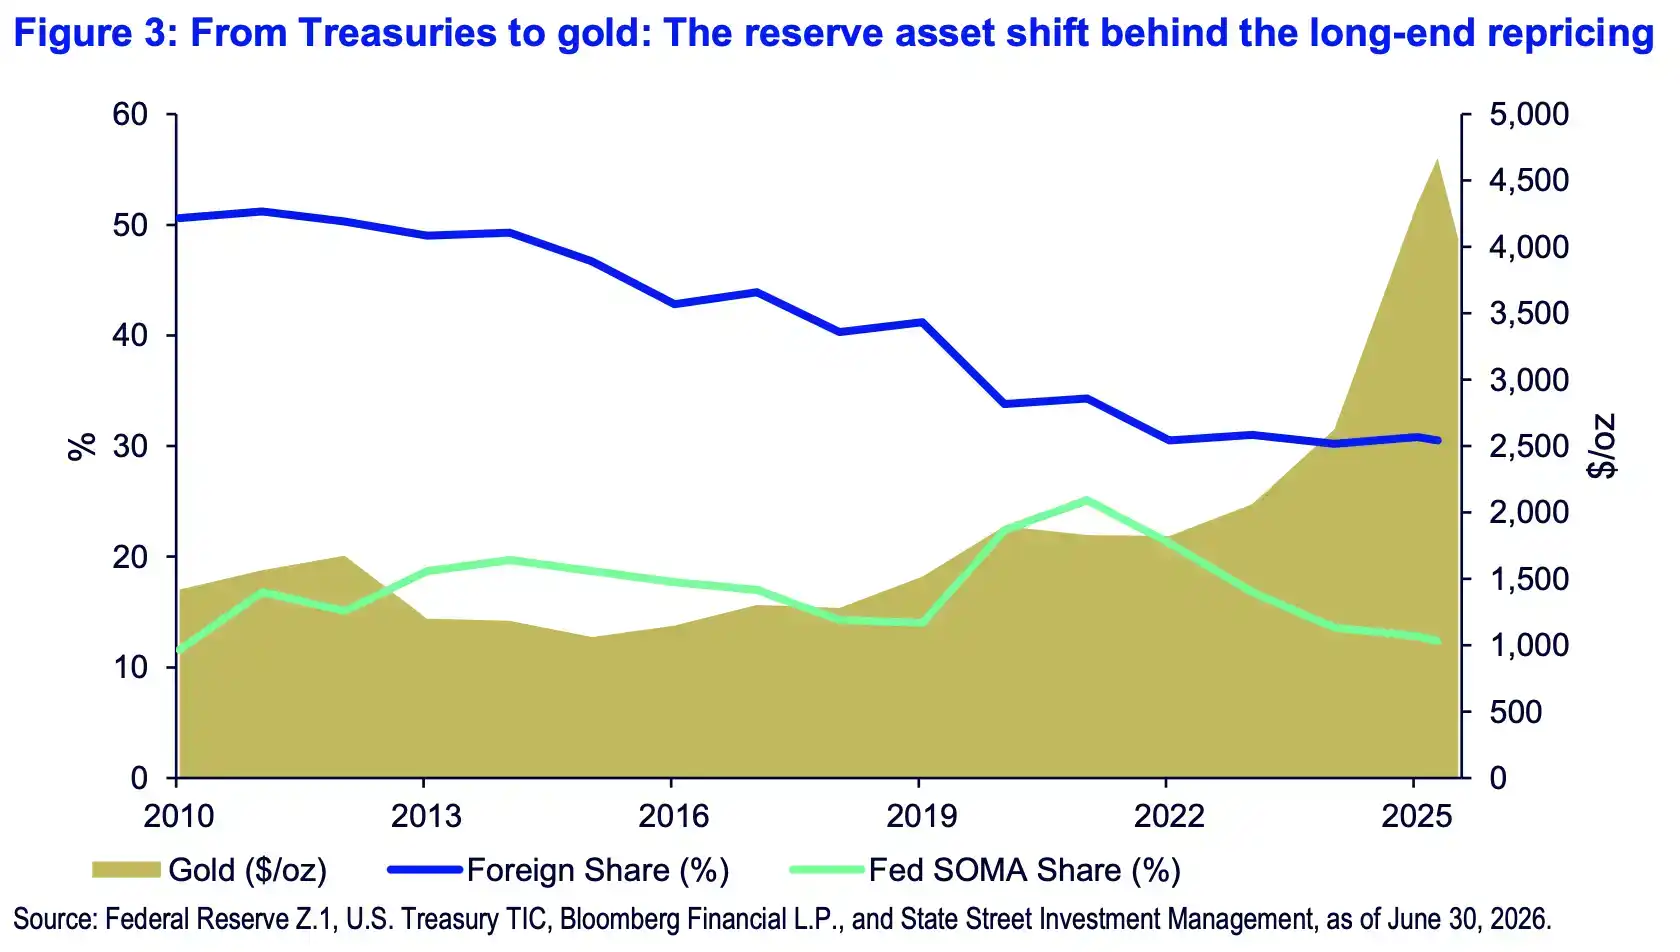
Citing European Central Bank estimates, State Street said gold accounted for about 27% of global official reserves by the end of 2025, overtaking U.S. Treasuries at 22% for the first time. In 2026, that share moves closer to 28%, while the dollar’s share of reserves falls to about 40%.
The firm said this affects gold prices in two ways. First, central bank buying means gold demand no longer depends entirely on retail investors and ETF flows. When Western funds sell in the short term, official-sector demand and Asian physical buying can cushion the decline. Second, the buyer base for U.S. Treasuries has changed. Foreign ownership of U.S. Treasuries has fallen from about 50% to 31%, while the Federal Reserve’s SOMA share has dropped from a 2021 peak of 25% to 13%. With U.S. debt still expanding and traditional outside buyers taking a smaller role, reserve managers have a stronger incentive to shift part of their portfolios into gold.
That reserve reallocation is one of the main pillars behind State Street’s $5,000 target. In the firm’s view, gold is not being supported only by safe-haven demand. It is also being supported by reserve structure changes, debt pressure and central bank allocation.
China and Asia-Pacific demand can support the market, but ETF flows still matter
Beyond central banks, the report said Chinese physical demand and regional fund flows form another support line.
China’s non-monetary gold imports reached 160 tonnes in April, up 25% year on year, and 163 tonnes in May, up 63% year on year. The average premium in China’s local gold market was 1.0% in June, the highest level since April 2025.
State Street said those numbers suggest the local market in China has not fully weakened even as global gold prices pulled back. Rising premiums usually point to stronger domestic buying, and imports are still being supported.
Fund flow data show the same split seen elsewhere in the report. North American money has been leaving gold funds, but China has posted $5.9 billion in net inflows this year and Asia-Pacific has seen about $12.6 billion of net buying in the first half. Asia also saw about $3.6 billion of selling in May and June, though stronger local premiums leave room for flows to return in the second half.
Still, the report set limits on that support. Strong physical demand does not mean ETF money will automatically come back, and higher local premiums do not mean an immediate rebound in international prices. For the $5,000 target, the more important question is whether Chinese physical demand can continue to translate into fund buying and whether redemptions from Western gold ETFs stop getting larger.
Long-term support remains, but high rates are slowing the move
State Street’s bottom line is that long-term buying has not disappeared, but the near-term carrying cost of gold has risen.
If expectations for Federal Reserve rate hikes keep building, real yields continue to rise and the dollar stays firm, gold may struggle to break free from pressure around $4,000 in the near term. The firm’s decision to raise the probability of a $4,000-$4,750 consolidation range to 25% reflects that resistance.
Its base case remains a $4,750-$5,500 range with a 70% probability. The probability of an extreme bull-case scenario has been cut to 5%, implying a $5,500-$6,250 range. The $5,000 target remains in place, but State Street said the path higher is more likely to come through a choppy repair phase rather than a straight one-way rally.
The most immediate risk in this correction, according to the report, is that Western gold ETF redemptions continue to grow while the dollar and real yields keep weighing on gold valuations. If those pressures do not ease, central bank buying and Chinese demand may still provide support, but gold could first spend time digesting the June sell-off inside a wider trading range.