

Author: marlon
Translated by Saoirse, Foresight News
On-chain options might be one of the biggest open lanes still left in crypto, based on a translated analysis published by MarsBit. The piece makes a simple argument: if total addressable market is the way you look at this, then options becoming a core market product is a timing question, not a feasibility question. Put differently, mature financial systems tend to end up leaning into options, and crypto now looks close to that bend in the road.
In traditional finance, retail appetite for options is already well established. On-chain, the article argues, the main bottleneck is no longer regulation or basic infrastructure. Market-maker liquidity is better, request-for-quote systems can handle bigger trades, and more players are showing up. Still early, though. Current on-chain options volume is only 6.9% of Deribit’s options volume. Interest is climbing fast, but the big issue now is distribution.
The piece reduces the whole thing to one point: if on-chain options want real breakout growth, they need a reliable stream of retail buy-side order flow. And when it looks across market history, it reaches a sharp conclusion: every options market that grew fast got there because retail traders pushed it there.
Scale in options markets starts with retail access
The article starts by taking aim at a familiar Crypto Twitter line: "Retail investors do not understand options, so they will never trade options on-chain." It dismisses that argument flatly. Yes, Greeks, payoff structures, and pricing mechanics take effort to learn. But that complexity has never stopped people from wanting the product.
Retail traders buy options because the upside is easy to understand, the article says. Most people are not sitting there carefully modeling theta decay. Lower the barrier. Make the interface easy. Then retail options volume can get big. That is the hook: convexity, or upside without a hard cap.
From there, the article goes wider. Its claim is that options are the retail market’s favorite derivatives product. To make that case, it runs through the U.S., India, and South Korea.
Case A: U.S. retail traders helped drive a post-2017 surge
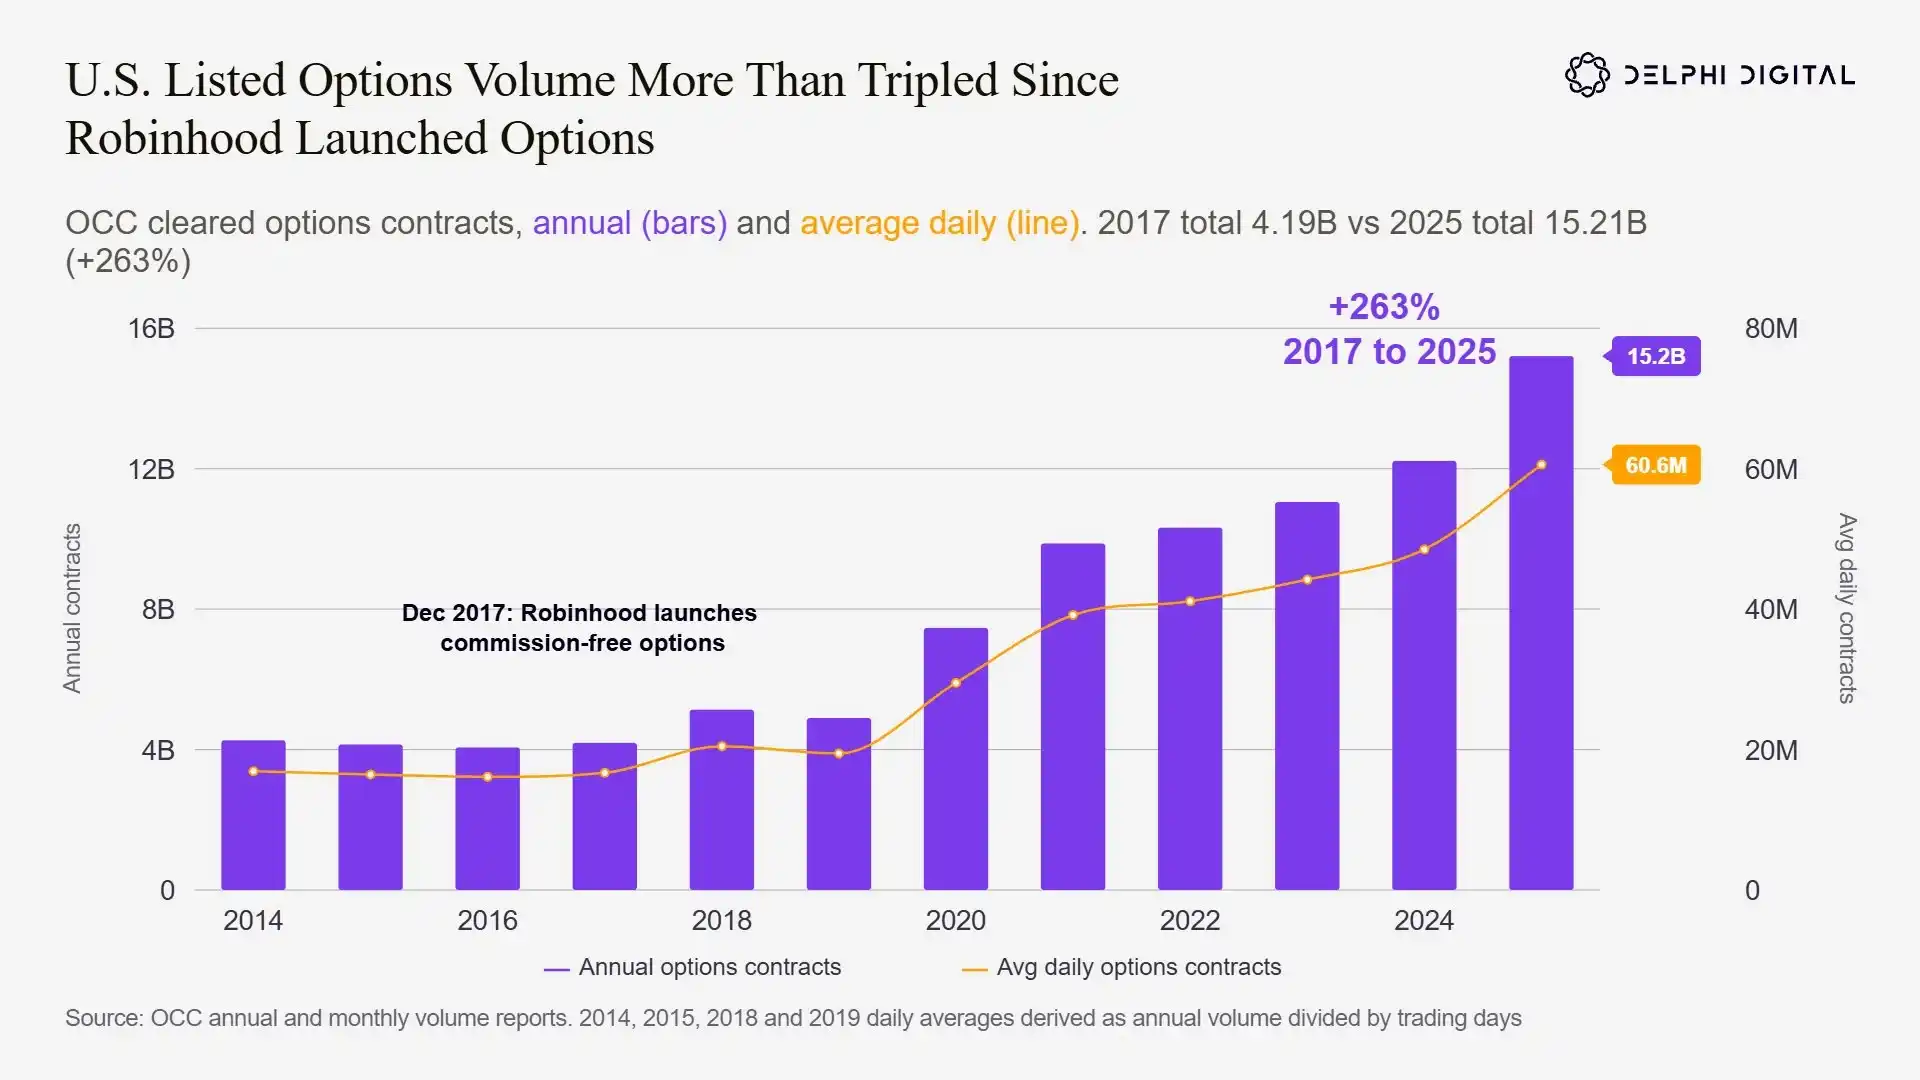
The U.S. is presented as the cleanest early case. From around 2014 to 2017, the options market was still led by institutions, growth had flattened out, and annual contract volume was roughly 4 billion. Retail participation was close to nonexistent.
Then things changed. In December 2017, Robinhood rolled out commission-free options trading. Other brokers copied the move. Then came the pandemic. The article says lockdown conditions, a sharp early drop in asset prices, broad marketing, and growing public interest in investing all worked together to pull a large wave of ordinary investors into finance apps. Options activity surged with them.
After Robinhood launched zero-commission options in December 2017, annual listed U.S. options volume climbed from 4.19 billion contracts to 15.21 billion, up 263%, and average daily volume increased too. Elsewhere in the article, the same span is described as 2017 to 2025, with annual volume rising from 4.19 billion to 15.2 billion contracts, also a 263% gain.
Once trading took off, institutional volume increased as well, the piece says, because market makers needed more hedging tools and more participants were chasing convex payoffs. But the main driver of that expansion was retail. That is the point.
Case B: SPX 0DTE share rose roughly 12-fold over a decade
The retail effect showed up in short-dated options too. Retail traders like convexity, the article says, and shorter expiries offer more upside when volatility jumps.
One of the highest-risk categories is 0DTE, meaning same-day expiry options. These expire and stop trading before the close of that trading day. The article also points out that any option is technically 0DTE on its final trading day.
Over the past decade, retail demand kept speeding up while exchanges kept adding supply through more expiry dates. The article says retail behavior looks much the same across markets: contracts expiring in 0DTE to three days are usually the busiest. Institutions rarely bother with this kind of lottery-style trading, so short-dated volume becomes a handy stand-in for retail participation.
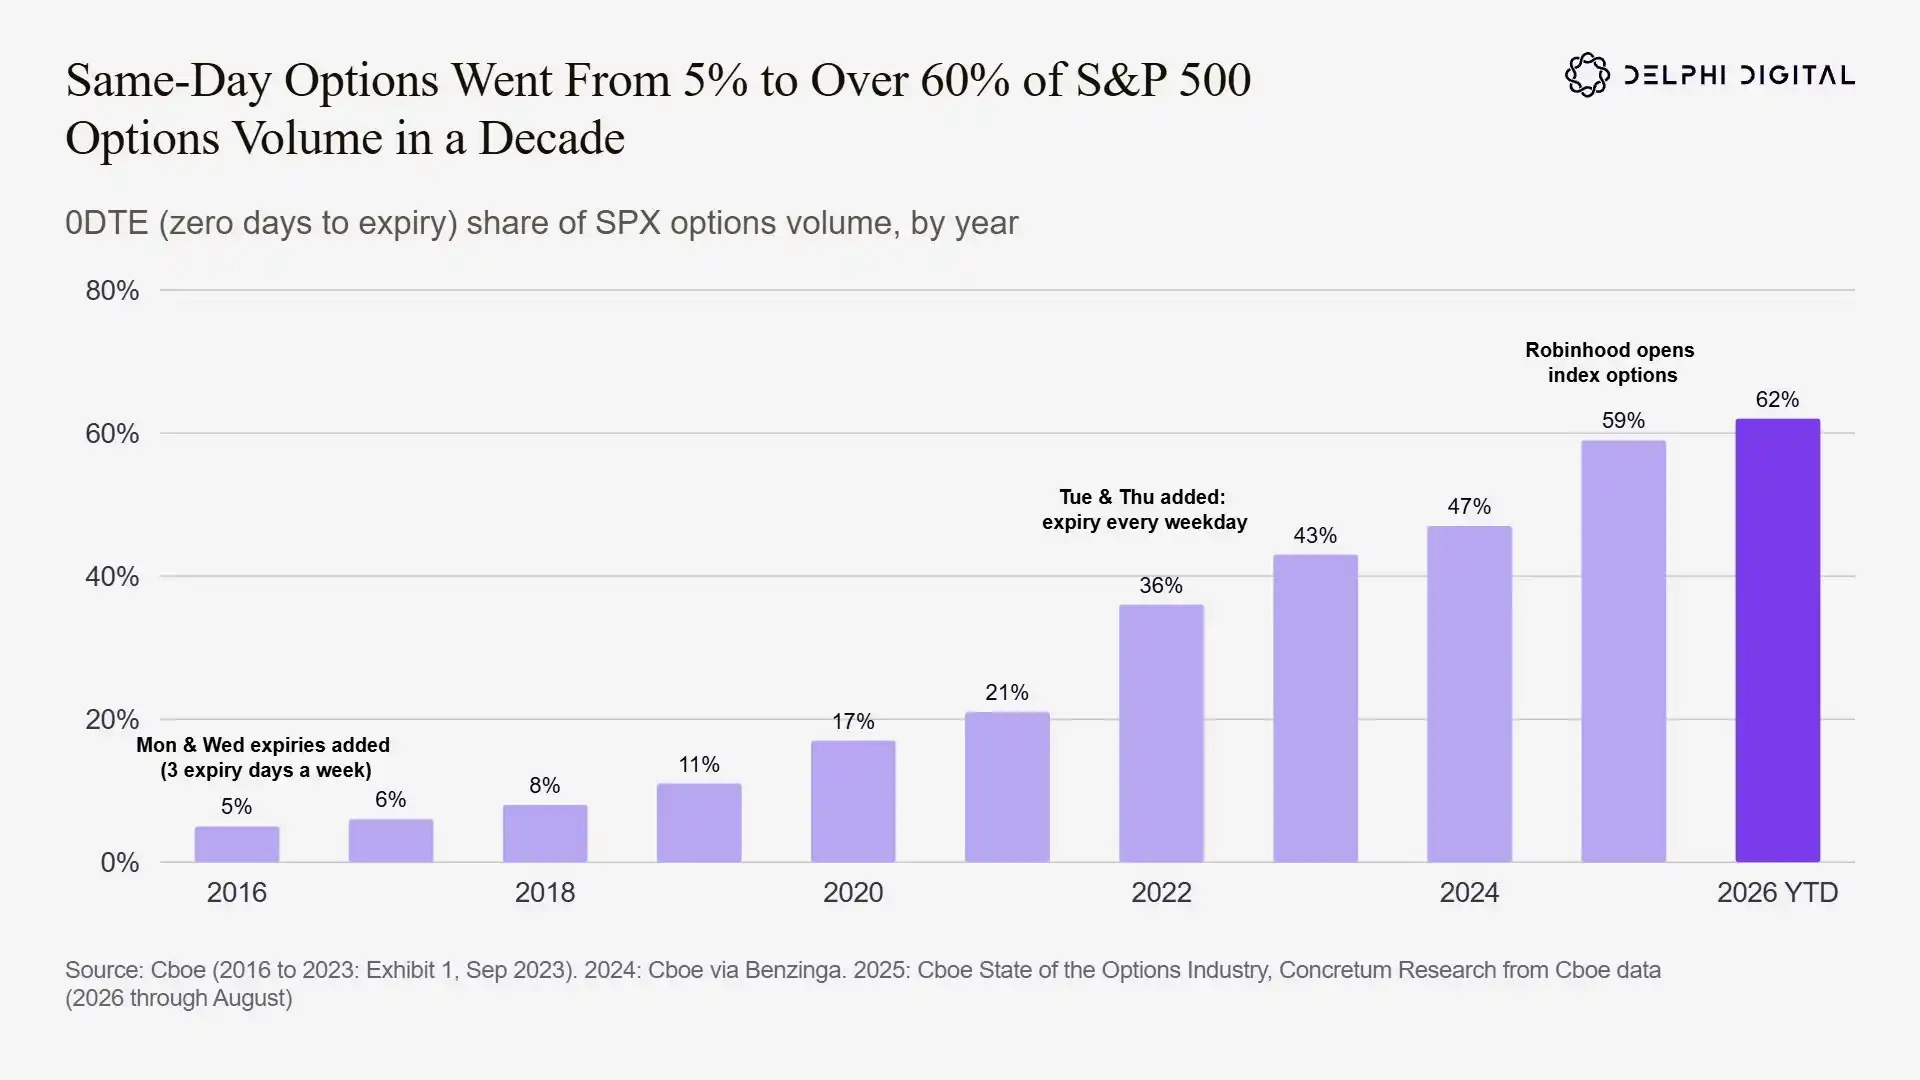
In SPX, same-day expiry options went from 5% of volume to 62% over ten years. Another line in the article says SPX 0DTE volume rose more than 12-fold in that period and increased from 5% to above 60% of all SPX options turnover.
Supply changes mattered too. SPX options had Friday expiries starting in 2005. Cboe added Monday and Wednesday expiries in 2016, then Tuesday and Thursday expiries in 2022, giving the market an expiry on every trading day. Each new expiry, the article argues, brought in more demand.
Robinhood then opened index options to all customers in January 2025. Cboe data, the article says, showed 0DTE share jumping to a then-record 56% the next month. Same pattern again: give retail traders cheap, short-dated options, and they will trade them in size.
Case C: Short-dated contracts came to dominate SPX options
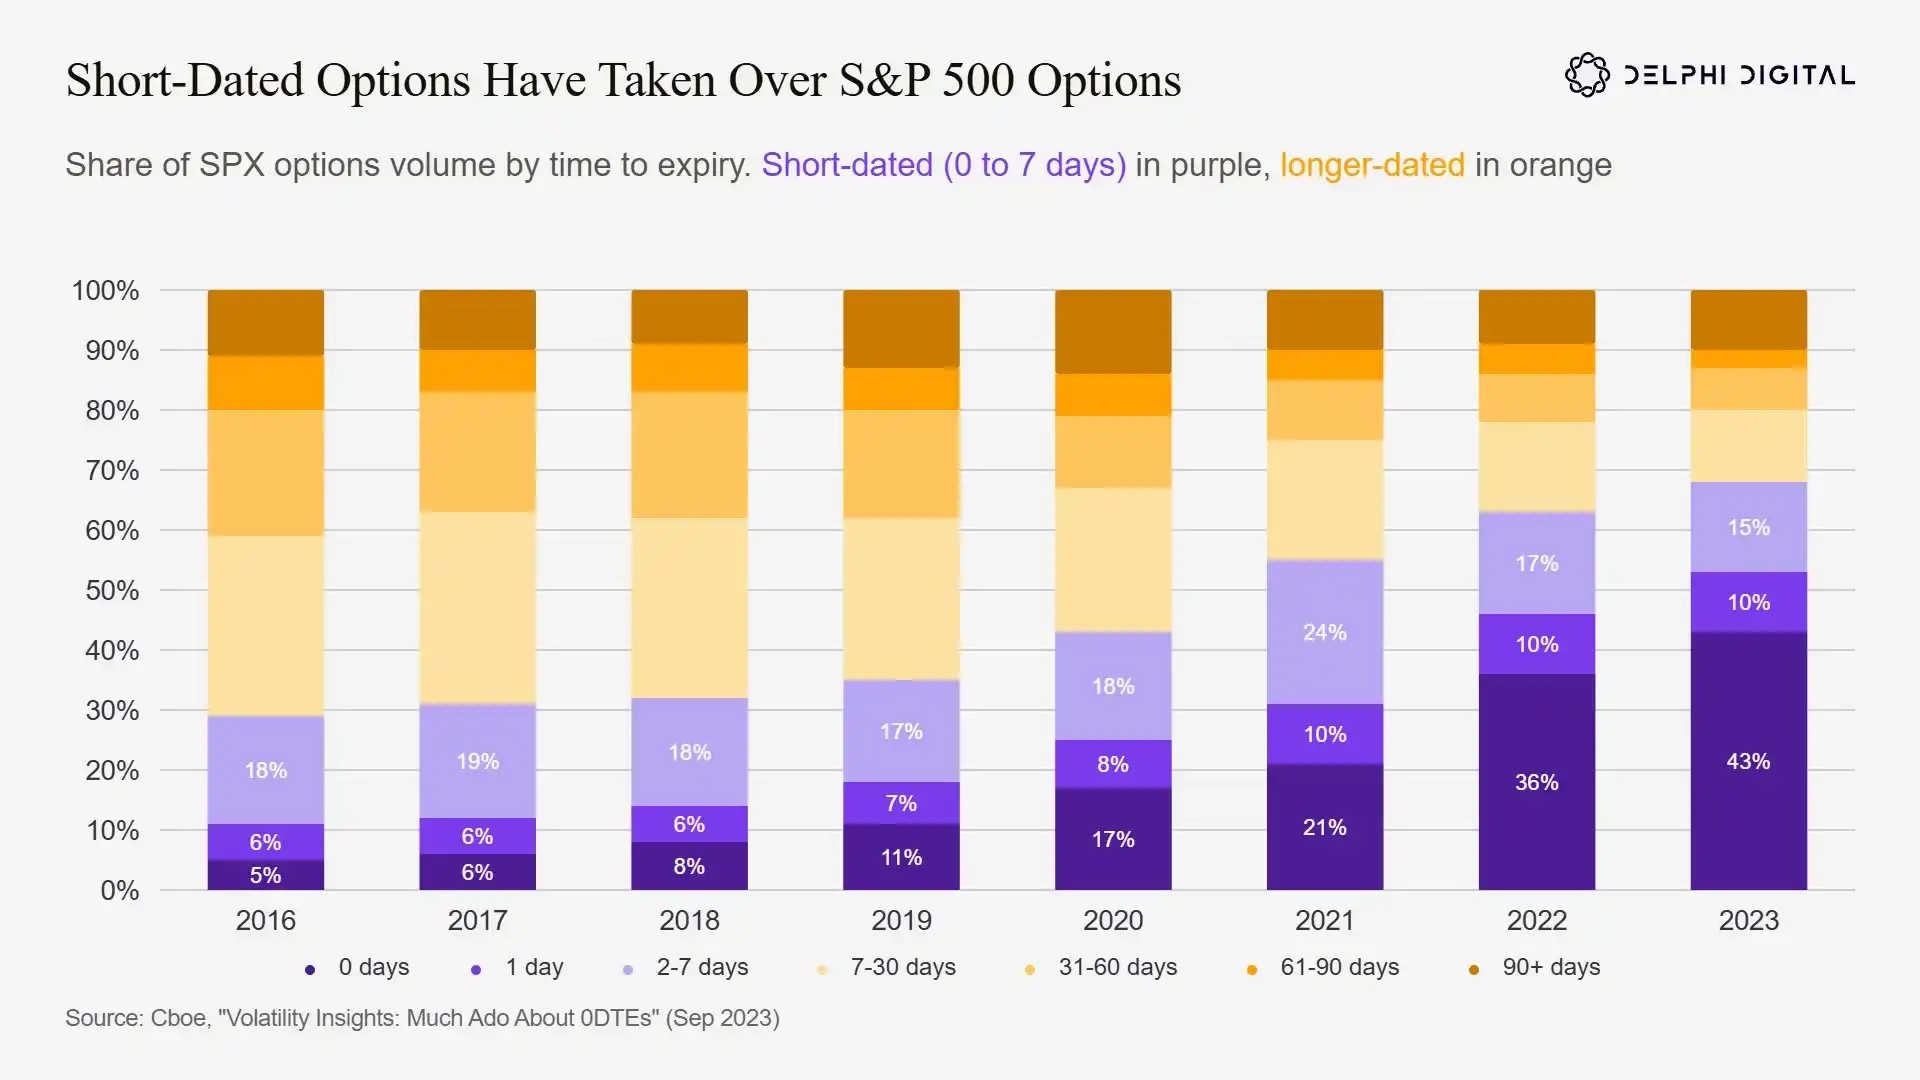
The change was bigger than same-day expiry alone. Between 2016 and 2023, the structure of the SPX options market flipped toward very short maturities. Contracts expiring in 0 to 7 days took a much bigger share, and 0DTE alone made up 43% of all volume by 2023, while medium- and long-dated options lost ground.
In 2016, options expiring within one week accounted for 29% of SPX volume. Contracts expiring in one week to one month were the biggest bucket at 30%, and maturities longer than one month made up 41%.
By 2023, that structure had reversed:
- Within one week: 68% of volume, including 43% in 0DTE
- One week to one month: down to 12%
- Longer than one month: down to 20%
In seven years, the market shifted from one built around medium- and long-dated positioning to one where roughly two-thirds of contracts expired within days. The article puts that shift on retail traders too. It cites a 2023 SSRN study saying that for retail traders, same-day expiry options were basically the whole trade: more than 75% of SPX options traded by retail were 0DTE.
Case D: Options remain Robinhood’s largest trading revenue line
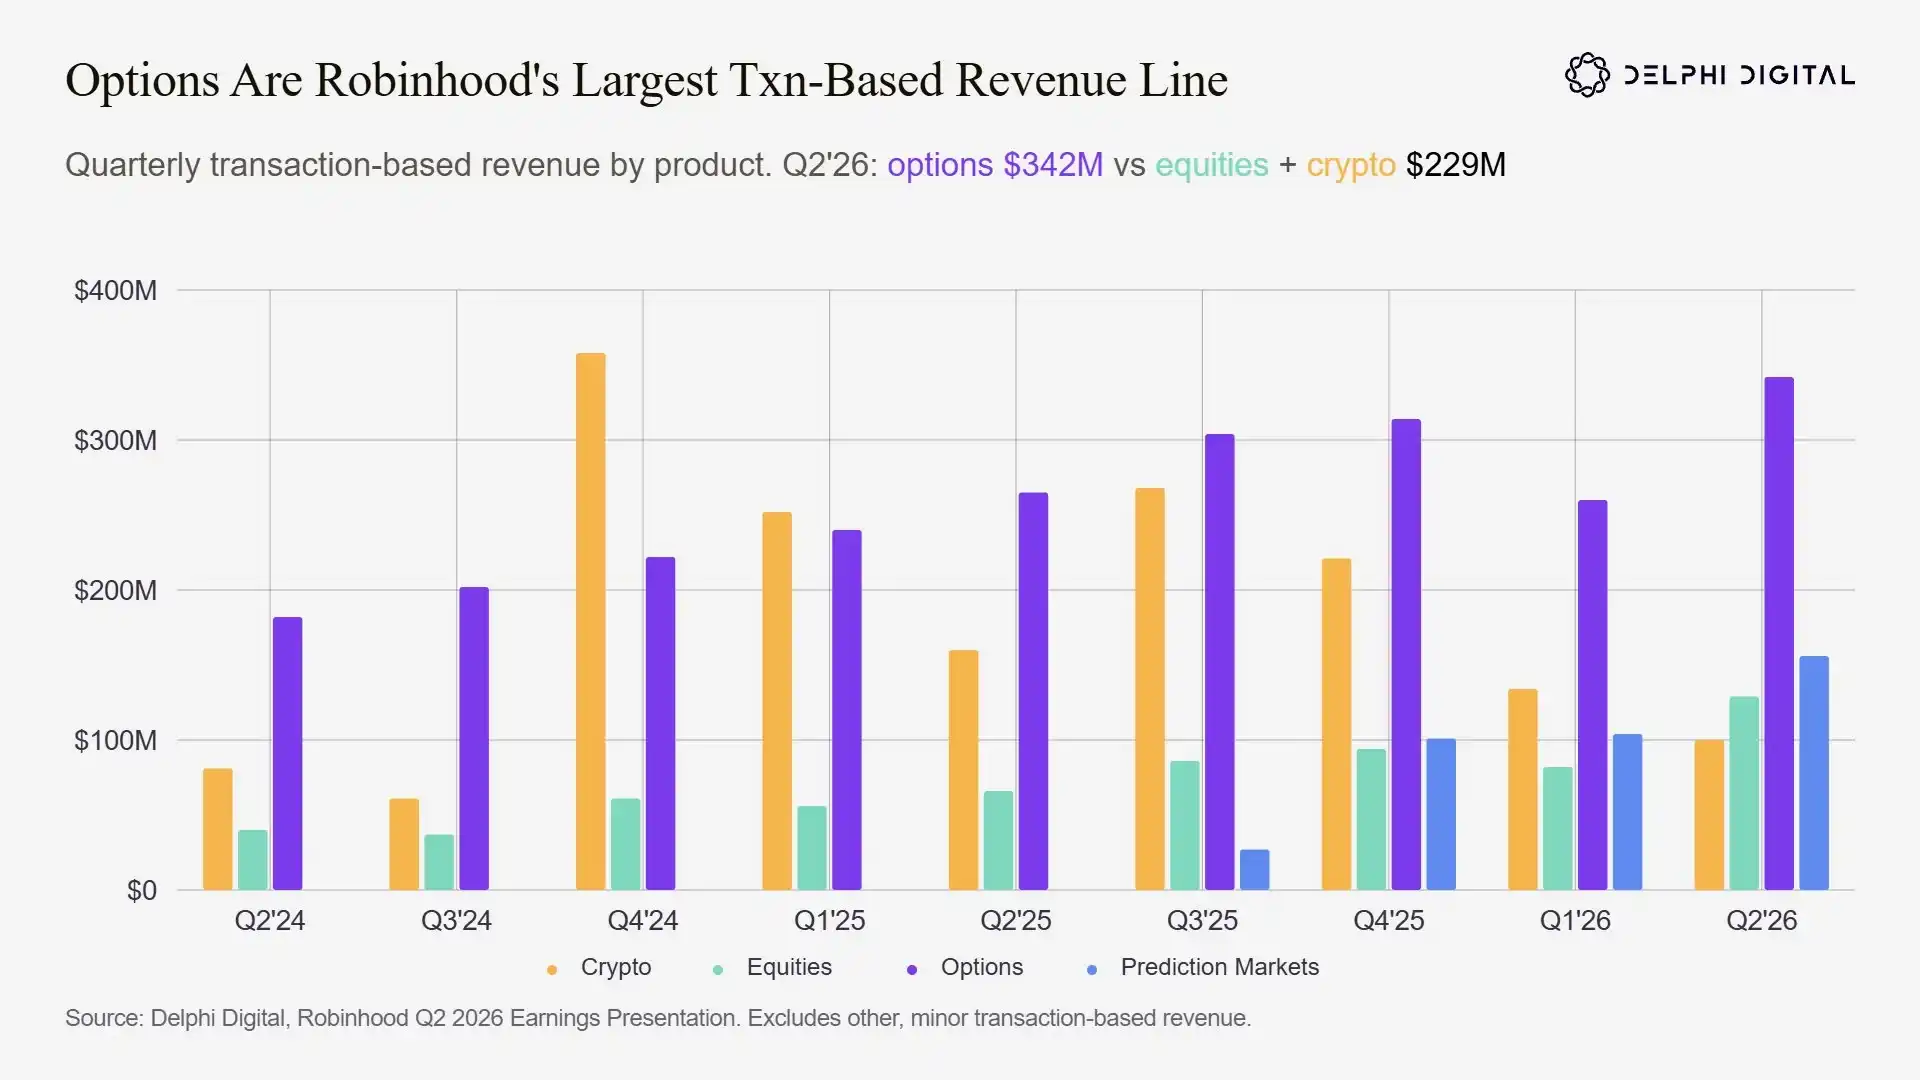
Robinhood is used here as a stand-in for U.S. mobile retail trading. The article says options have consistently been the company’s biggest source of trading revenue. Unlike crypto revenue, which swings around more, options revenue has stayed on top.
The latest example it gives is Q2 2026. Robinhood generated $342 million in options trading revenue that quarter, above the combined $229 million from equities and crypto. The article says options revenue often beats the total from stocks and crypto put together.
It also points to the trend over time. Options revenue rose from $182 million in Q2 2024 to $342 million in Q2 2026, an 88% increase over two years.
Case E: India’s retail traders dominate global options activity by contract count
No retail group is as obsessed with options as India’s, the article says, which makes the country a useful test case for retail derivatives demand.
Before getting into the figures, the article splits apart two metrics people often mix up: premium and notional.
- Premium: the actual cash paid to buy an option. The article uses a simple example: if a trader pays $200 for a call option, that $200 is the premium. It reflects real money changing hands and is presented as the more objective way to measure platform trading scale.
- Notional: the face value of the underlying exposure, equal to contract multiplier times underlying price. In the article’s example, a $200 premium can control $10,000 of exposure. So notional is much larger than the cash exchanged and is more useful for judging market size than turnover.
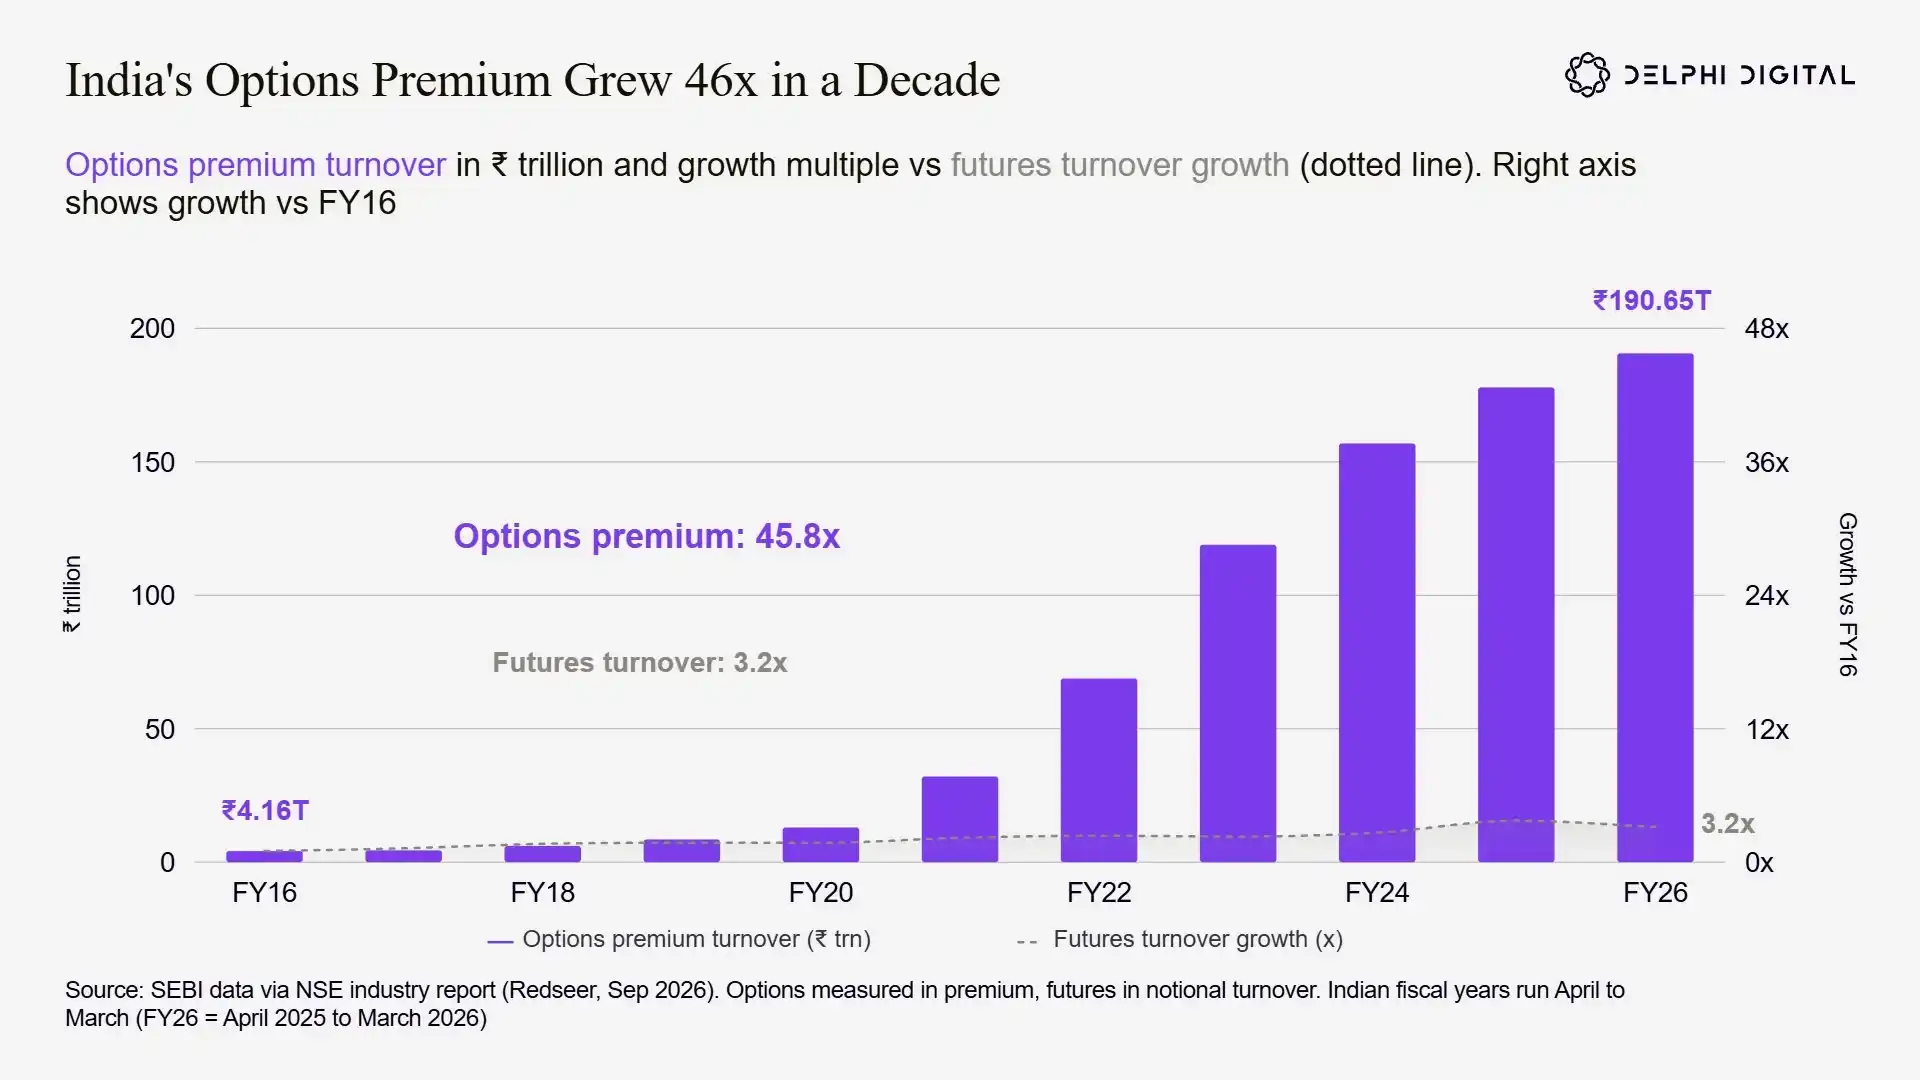
In India, options premium turnover increased 45.8x from FY16 to FY26, reaching INR 190.65 trillion, far ahead of futures turnover, which rose only 3.2x. In FY16, which the article defines as April 2015 to March 2016, Indian traders paid INR 4.16 trillion in stock options premium. By FY26, that number had reached INR 190.65 trillion.
At the end of 2024, the Securities and Exchange Board of India, or SEBI, introduced rules that raised minimum contract size from INR 500,000 to INR 1.5 million and limited exchanges to weekly expiries on just one benchmark index. Even so, options premium still increased, up another 7% in FY26.
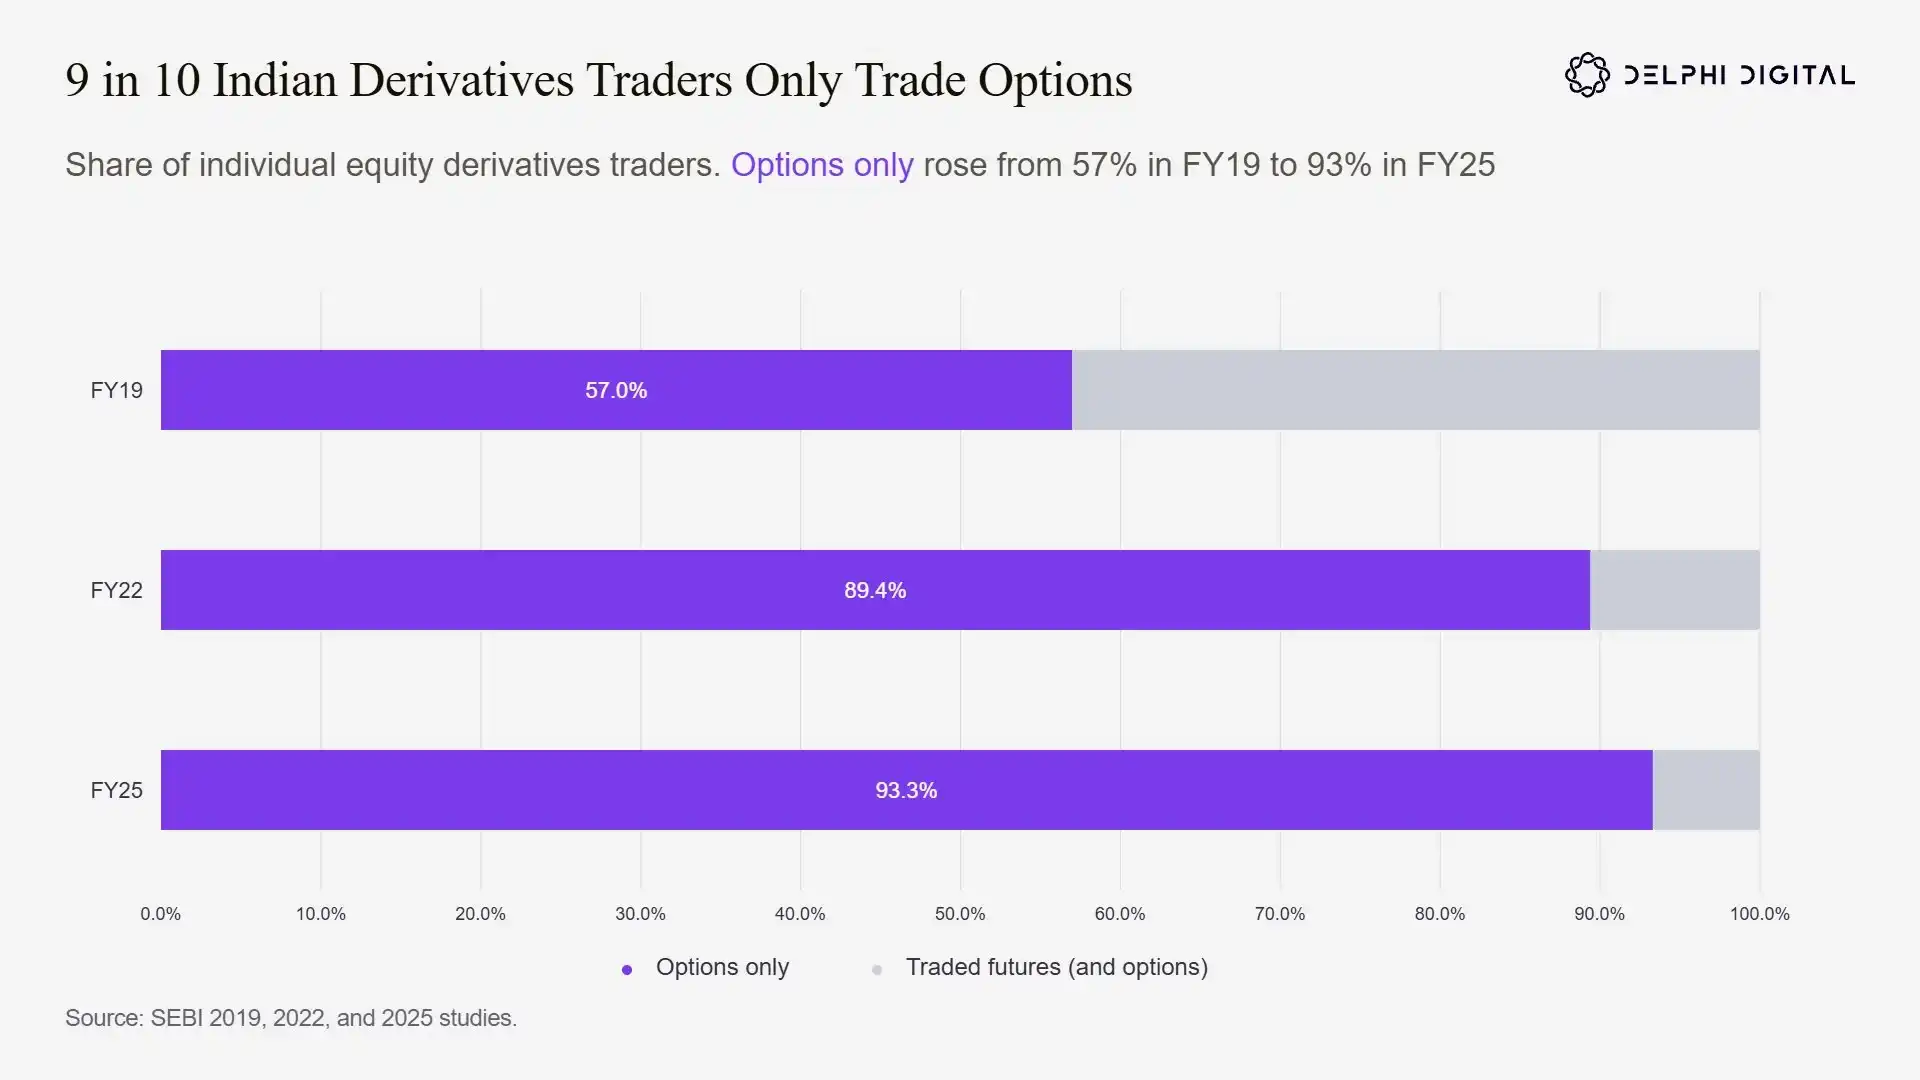
The article says options are the overwhelming first choice for Indian retail derivatives traders. More than 90% of retail participants in derivatives trade only options. Among individual traders in single-stock derivatives, the share trading only options and not futures rose from 57% in FY19 to 93.3% in FY25.
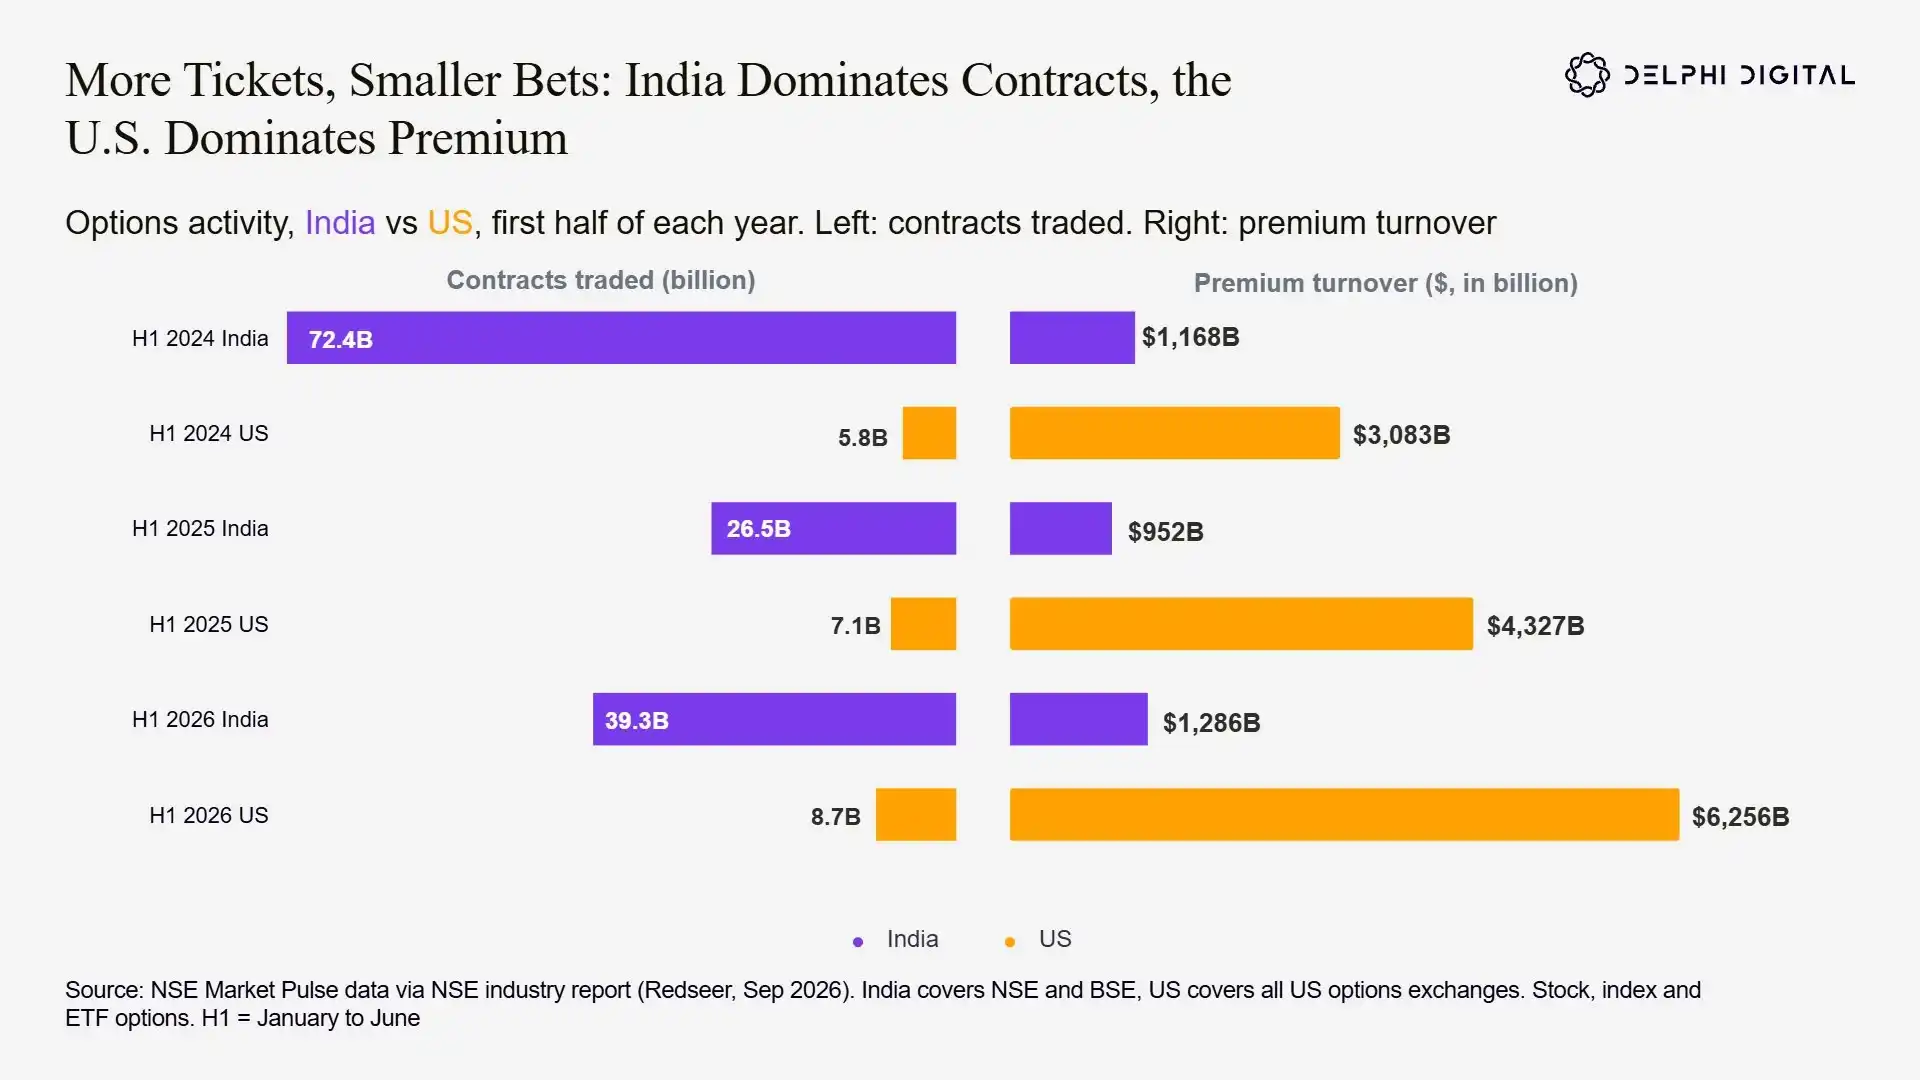
The cross-market comparison is hard to ignore. In the first half of 2026, Indian exchanges traded 39.3 billion options contracts, 4.5 times the 8.7 billion contracts traded across all U.S. options exchanges. But U.S. traders paid $6.3 trillion in premium, nearly five times India’s $1.3 trillion. On a per-contract basis, that comes out to about $33 in premium in India versus $719 in the U.S.
The article’s read is straightforward: India has many more contracts but far smaller ticket sizes, while the U.S. generates much higher premium turnover per contract. It ties that gap to two things: lower minimum contract value in India and a different product mix. Indian volume is almost entirely in index options, which are cheaper, shorter-dated, and easier to access. The U.S. market includes single-stock options, ETF options, and longer-dated contracts, all of which carry higher premium per contract.
The article also uses the figures to show what SEBI’s rules did. From the first half of 2024 to the first half of 2025, contract volume fell 63%, but premium fell only 18%. Its reading: smaller contracts disappeared, but traders did not. By the first half of 2026, contract volume had rebounded 48% and premium had recovered 35%.
At the global level, the article says India’s National Stock Exchange, or NSE, accounted for 89% of all stock index options contracts worldwide in FY26. It adds that NSE traded 34.7 billion stock index options contracts that year, equal to 51% of all global equity derivatives contracts. For comparison, CME handled about 7.1 billion contracts and ICE about 5 billion, which leaves NSE at 4.9x and 6.9x those totals, respectively.
The takeaway is blunt. Indian retail traders are not just participating in options. Options have become their main way to participate in markets.
Case F: South Korea shows how a market can shrink under tighter rules
Before India, South Korea had already gone through the full cycle. The article says that when retail traders get easy access to low-cost index options, the market can expand very fast. And when regulation keeps tightening, it can shrink just as fast.
KOSPI 200 options track 200 leading Korean listed companies and account for most stock options activity on Korea Exchange, or KRX. In the early 2000s, domestic retail traders made up 70% of KOSPI options volume. As foreign institutions and overseas retail traders entered, and as local rules tightened, the domestic retail share dropped below 30% and never recovered.
The article splits the market into three phases.
Boom: 2000 to 2003
Total stock options contracts increased from 194 million in 2000 to 2.84 billion in 2003, a 14.6x jump in three years. Premium paid by retail traders rose 7.9x over the same period. Retail accounted for 70% of KOSPI 200 options trading.
Global peak: 2004 to 2011
In 2004, KRX stock options volume represented about 28% of all derivatives contracts traded globally, according to the article. For nearly a decade, KOSPI 200 options sat at the top of FIA’s global contract volume rankings, peaking at 3.67 billion contracts in 2011. Retail options premium reached KRW 145.7 trillion at the high.
Decline: 2012 to 2017
Regulators decided retail speculation had gone too far and rolled out several rounds of restrictions.
In December 2011, the Financial Services Commission, or FSC, announced a fivefold increase in KOSPI 200 option contract size, raising the multiplier from KRW 100,000 to KRW 500,000. Using the article’s exchange rate of $1 = KRW 1,327, the entry cost per contract increased from about $75.34 to $376.71. The rule was phased in from March to June 2012. Total contract volume fell 23% from the peak, and retail premium dropped 37% year over year.
In December 2014, regulators tightened access again. New traders had to complete 30 hours of coursework, 50 hours of simulated trading, and post KRW 50 million in margin, which the article converts to $37,671. It says the rule almost cut off the flow of new retail entrants.
A third round came in January 2016, when capital gains tax on KOSPI 200 derivatives was raised from 5% to 10%, and volume fell again. By 2017, market activity adjusted for contract size was down 57% from the peak, while retail options premium had dropped 77% from its high.
Regulators later admitted the measures had gone too far. In March 2017, the contract multiplier was cut in half to KRW 250,000. In 2019, FSC said entry barriers had been set too high and lowered the margin requirement to KRW 10 million to KRW 20 million, while cutting training to a one-hour course plus three hours of simulated trading.
FSC also introduced weekly KOSPI 200 options in 2019 in an effort to revive the market. Activity improved somewhat. From 2020 to 2025, adjusted annual contract volume recovered to 1.7 billion to 2.0 billion, but that was still less than half the 2011 peak.
The article says the market was never shut down, but retail participation was badly hit. In 2025, retail options premium fell to a 20-year low of KRW 21.5 trillion, down 85% from the 2011 peak. By Q4 2026, retail share was below 27%, while foreign institutions plus foreign individuals accounted for more than 66%. Another figure in the article says that in 2025 KOSPI 200 options trading, foreign investors held a 66.4% share and Korean retail traders only 26.1%, down sharply from the 72.2% retail peak in 2001.
Demand did not disappear. It moved offshore
The article pushes back on the idea that South Korea proves regulation successfully cooled speculation and protected investors. Its argument is different. When you clamp down too hard on a thriving market, demand does not vanish. It moves abroad.
Korean traders did not lose their taste for leverage. They moved into offshore futures and options. The article says overseas derivatives trading by Korean retail investors has reached 3.6 times the size of the domestic market, showing that rules at home redirected demand rather than removing it.
Because the Financial Supervisory Service, or FSS, and the Korea Financial Investment Association, or KOFIA, did not publish overseas trading data before 2016, the comparison covers 2016 to 2024. The derivatives turnover figures include both futures and options. Futures are measured by full notional position value, while options are measured only by premium paid, not by the notional exposure they control.
In 2016, domestic retail derivatives trading was still larger than overseas activity: KRW 2,729 trillion on KRX versus KRW 1,952 trillion on foreign exchanges. By 2018, offshore turnover had overtaken the domestic market for the first time. By 2024, the gap had widened dramatically, with KRW 10,607 trillion traded offshore versus KRW 2,986 trillion domestically, making the offshore market 3.6 times larger.
Over those eight years, overseas retail derivatives trading grew 5.4x, while domestic trading increased only 9%. The article says new domestic derivatives traders still face a minimum KRW 10 million margin requirement and mandatory training, while most offshore brokers do not impose those same barriers. So retail traders kept leaving the higher-friction local market for looser offshore venues. The article adds that Korean retail traders mainly trade U.S. equity index futures abroad, with E-mini Nasdaq 100 futures generating the highest turnover.
What this means for on-chain options
The article ends by bringing all of those cases back to crypto. Its summary has three parts:
- Every options market that achieved breakout growth was driven by retail traders.
- Regulation can suppress domestic market size, but it cannot erase trading demand.
- Among trading products, options have an unusually strong pull on retail users.
In that frame, the U.S. and India are the positive cases, while South Korea is the warning sign.
The article also pushes back, at least partly, on the claim that DeFi can never compete with Robinhood for retail users. Its point is narrower than that. On-chain options do not need to win over U.S. retail traders first to break out. Just as Korean traders moved offshore to satisfy demand, traders elsewhere may turn to offshore venues too. If distribution is right, the article says, permissionless protocols have a shot at absorbing that flow.
For now, on-chain options are still small. Bringing in more institutions and native crypto users could lift volume by 10x from here, the article says. But if traditional finance history tells us anything, the threshold for true mass adoption will come from ordinary retail order flow.