
The Conference Board is set to publish the June reading of the US Leading Economic Index, or LEI, at 10 a.m. Eastern Time on Monday, July 20. With the Federal Reserve’s next policy meeting scheduled for July 28-29, the release lands in a period when markets have little fresh official policy guidance and are paying closer attention to forward-looking macro data.
The index is not designed to predict the next Fed move. Its value lies elsewhere: it tracks the direction of economic momentum over the coming quarters and is often used as a supplementary gauge for recession risk, soft-landing odds, and the backdrop for corporate earnings.
May showed improvement, but the composition raised questions
According to the release published on June 18, the LEI for May came in at 99.3, with 2016 set to 100, up 0.1% from the previous month. That marked a second consecutive monthly increase after a 0.2% rise in April.
The trend over a longer window improved as well. The index fell 0.3% over the six months from November 2025 to May 2026, much smaller than the 1.3% contraction recorded in the prior six-month period from May 2025 to November 2025.
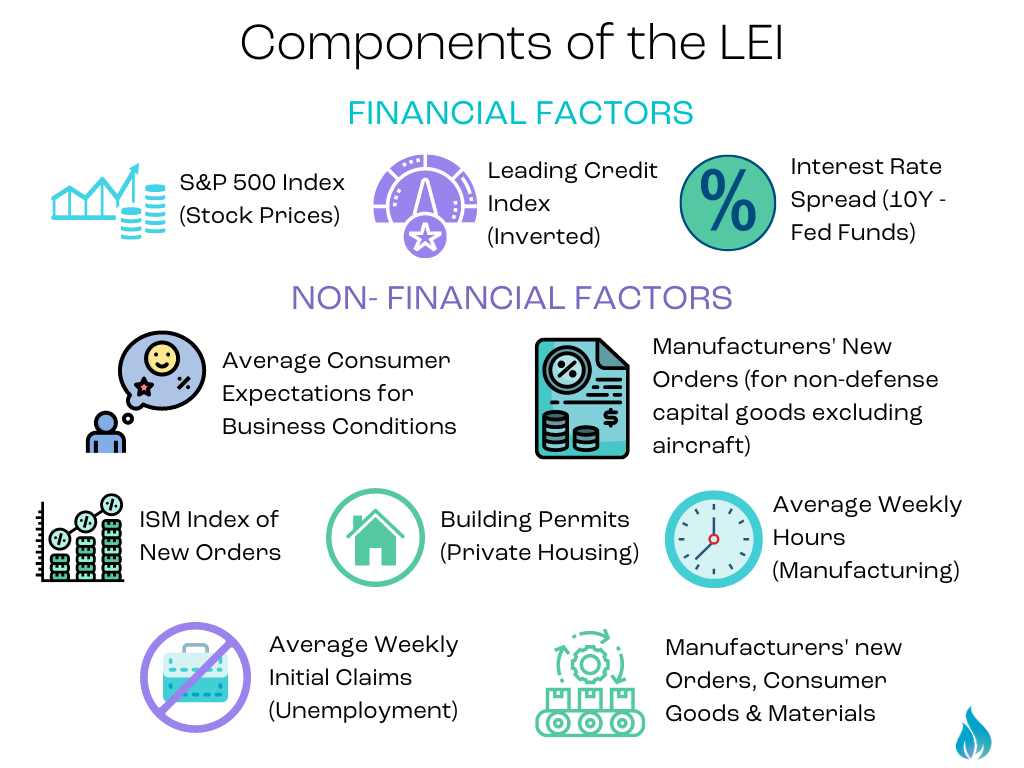
That said, the Conference Board was explicit about what drove the gain. It said the May increase was entirely due to financial components, particularly stock prices and the interest rate spread. Outside those areas, only the ISM new orders index showed some strength, while consumer expectations remained the main drag.
Justyna Zabinska-La Monica, Senior Manager of Business Cycle Indicators at the Conference Board, also said that even with two straight monthly gains, the six-month and 12-month growth rates of the LEI remained negative, pointing to slower economic expansion ahead.
Why this week’s release stands out
The timing matters. The Fed will not meet until July 28-29, which leaves more than a week in which markets do not have a new policy signal from the central bank. In that gap, a forward-looking indicator such as the LEI can draw more attention than it might in a busier data calendar.
The LEI is built from 10 components, including manufacturing new orders, building permits, initial jobless claims, consumer expectations, stock prices, and the interest rate spread. It is intended to signal the direction of economic momentum over the next several quarters rather than describe current conditions.
For that reason, the index works better as a supporting macro tool than as a trading signal. It is also poorly suited to direct rate calls. Since stock prices and the yield spread are already part of the index, using the LEI to infer the Fed’s next decision risks circular logic.
Its more practical use is in answering a different set of questions: whether recession risk is rising or easing, whether the soft-landing narrative is gaining real support, and whether corporate earnings have enough backing in the quarters ahead. Those issues matter across equities, credit, and other risk assets.
What the June print needs to clarify
The headline number alone will not settle much. The structure underneath it is the more important part.
If June shows another improvement but the gain once again comes mainly from stock prices or other financial inputs, the index may be reflecting the market’s own strength rather than a broader repair in the real economy. A more convincing shift would be a positive contribution from non-financial components such as consumer expectations, new orders, or building permits.
That is the central question going into the release: not simply whether the LEI rises again, but whether the improvement broadens beyond financial market variables.
How recession and soft-landing signals are usually read
The Conference Board evaluates downside signals through three lenses: duration, depth, and diffusion.
Historically, the LEI tends to peak 11 to 12 months before a recession begins. The article cites Recession Dashboard tracking, which shows that the current six-month growth rate is still negative but remains well above the roughly -4% level often associated with a traditional recession trigger. On that basis, the current reading is interpreted as a slowdown rather than a recession call.
Another technical marker is whether the diffusion index falls below 50. In mid-2025, that measure stayed under 50 for several months and triggered a recession signal. More recent readings suggest that pressure has eased. Where the diffusion index lands in the June report will be a direct test of how broad or narrow the weakness is.
Why the lagging index matters as a cross-check
Looking at the LEI on its own can distort the picture. The May lagging index stood at 120.5, down 0.1% month over month, but its six-month change was positive 0.9%, stronger than the flat performance seen in the prior six months.
A softer leading index alongside a firmer lagging index is often associated with a later-stage cycle, where growth is slowing but has not stalled. That pattern fits the soft-landing scenario discussed by markets. If June were to bring an improvement in the LEI while the lagging index weakens, that would suggest a more meaningful change in the cycle’s position.
What investors are watching
The article outlines three transmission channels.
The first is the earnings channel. New orders and consumer expectations tend to lead corporate revenue by roughly two to three quarters, which gives them added weight heading into earnings season and management commentary on the second half of the year.
The second is the risk-appetite channel. If the data supports the soft-landing narrative, tolerance for risk-asset valuations may remain higher. If non-financial components keep deteriorating, markets may start pricing in weaker earnings expectations.
The third is the policy-expectation channel. The index is not likely to directly shape the July Fed decision, but it can influence how markets price the path for September and later meetings.
For cross-asset investors, macro turning points often appear first in forward-looking indicators and only later feed through to broader risk assets. The article notes that digital assets are affected by the same chain, and says investors tracking the link between macro variables and crypto can watch price reactions on MEXC when risk appetite shifts.
Three risks in reading the data
The first is interpretation risk. This is a monthly indicator, and one-month moves can contain a lot of noise. The six-month growth rate and the diffusion index carry more information than the monthly headline alone.
The second is structural risk. If the improvement continues to come mainly from stock prices, a market pullback could quickly reverse the index. An advance supported by asset prices can prove fragile.
The third is timing risk. Because the LEI has historically peaked 11 to 12 months before recessions begin, it is better at signaling direction than timing. Using it as a market-timing tool can be misleading.
The article also says investors should watch for any annual benchmark revision in this release. Such revisions can recalculate the entire historical series, making the revised level and month-over-month change hard to compare directly with earlier publications.
MEXC Crypto Pulse’s stated view
MEXC Crypto Pulse argues that the real importance of this release is not whether it can forecast a recession on its own, but whether it helps quantify a sharper question: is the recent improvement in the economy real, or is it largely a result of self-reinforcing financial asset prices?
Its reading of the May data is that the answer was uncomfortable. The increase came entirely from stock prices and the rate spread. In that framing, when an indicator meant to capture the real economy’s outlook relies mainly on asset-price components, some of its independent informational value is weakened.
The team says two market misreadings are possible. One is to treat two straight monthly increases as confirmation of a turn, even though the six-month and 12-month growth rates remain negative. The other is to use the index as a direct guide to Fed policy, despite the fact that market pricing is already embedded in some of its components.
In its view, the most important thing to watch next is not the headline figure but the component mix, especially whether non-financial inputs such as consumer expectations and manufacturing new orders start contributing positively. If they do, the soft-landing narrative would have stronger support from the real side of the economy. If they do not, the current improvement would look more like a byproduct of a rising stock market.
For crypto and broader cross-asset markets, the article’s takeaway is that sensitivity to forward-looking data tends to increase during a policy gap, and digital assets, as high-beta expressions of liquidity and risk appetite, often move more sharply than equities around these moments. On that view, understanding the transmission chain matters more than reacting to a single headline number.
Key points from the article’s Q&A section
Release time
The Conference Board is scheduled to release the June LEI on Monday, July 20, 2026 at 10 a.m. ET. The prior release came on June 18 and covered May data. The indicator is published monthly, usually alongside the coincident and lagging indexes.
What the index measures
The LEI combines 10 components, including manufacturing new orders, building permits, initial jobless claims, consumer expectations, stock prices, and the interest rate spread. It is designed to flag turning points in the business cycle and point to momentum over the coming quarters rather than current economic conditions.
The latest reading
The May reading was 99.3, up 0.1% month over month after a 0.2% gain in April. The six-month decline narrowed to 0.3% from 1.3% in the previous six-month period. At the same time, the Conference Board said the increase was entirely driven by financial components, while six-month and 12-month growth rates remained negative.
Whether it affects the July Fed meeting
The article says the direct impact is limited. The Fed’s July 28-29 decision is driven mainly by inflation and labor-market data. The LEI is more useful as a supplementary signal on recession risk, soft-landing odds, and the earnings backdrop than as a rate-forecasting tool.
Whether the current level implies rising recession risk
The present assessment is slowdown, not recession. The six-month growth rate is still negative, but it remains above the roughly -4% threshold often linked to a traditional recession trigger, and the decline has been narrowing. The lagging index’s positive 0.9% six-month change adds to that interpretation.
Which components matter most
The article says the component structure matters more than the headline. The biggest focus is whether non-financial components, especially consumer expectations and manufacturing new orders, begin to turn positive. Consumer expectations remain the main drag, while new orders lead corporate revenue by roughly two to three quarters. If stock prices remain the main support, the improvement may not prove durable.
Why this matters for crypto
The link runs through risk appetite. Digital assets are described in the article as high-beta expressions of liquidity and risk sentiment, which means shifts in macro momentum can feed into crypto pricing through broader risk tolerance. During a Fed policy gap, that sensitivity can increase.
The article ends with a standard disclaimer saying the content is for information and research discussion only and does not constitute investment, financial, legal, tax, or trading advice. It also notes that macro indicators can be revised and lagged, that historical patterns do not guarantee future outcomes, and that readers should independently verify third-party data and institutional releases.