
Author: Venture Curator
Translated by: TechFlow
Several new datasets are challenging a few familiar venture narratives at once. The largest VC platforms appear less likely to back seed-stage companies that look meaningfully different from the rest of the market. Many older venture funds, even late in their life cycle, still have not returned paid-in capital to limited partners. And in AI, the biggest spending pool is not necessarily at the frontier-model edge.
Who is actually backing venture outliers
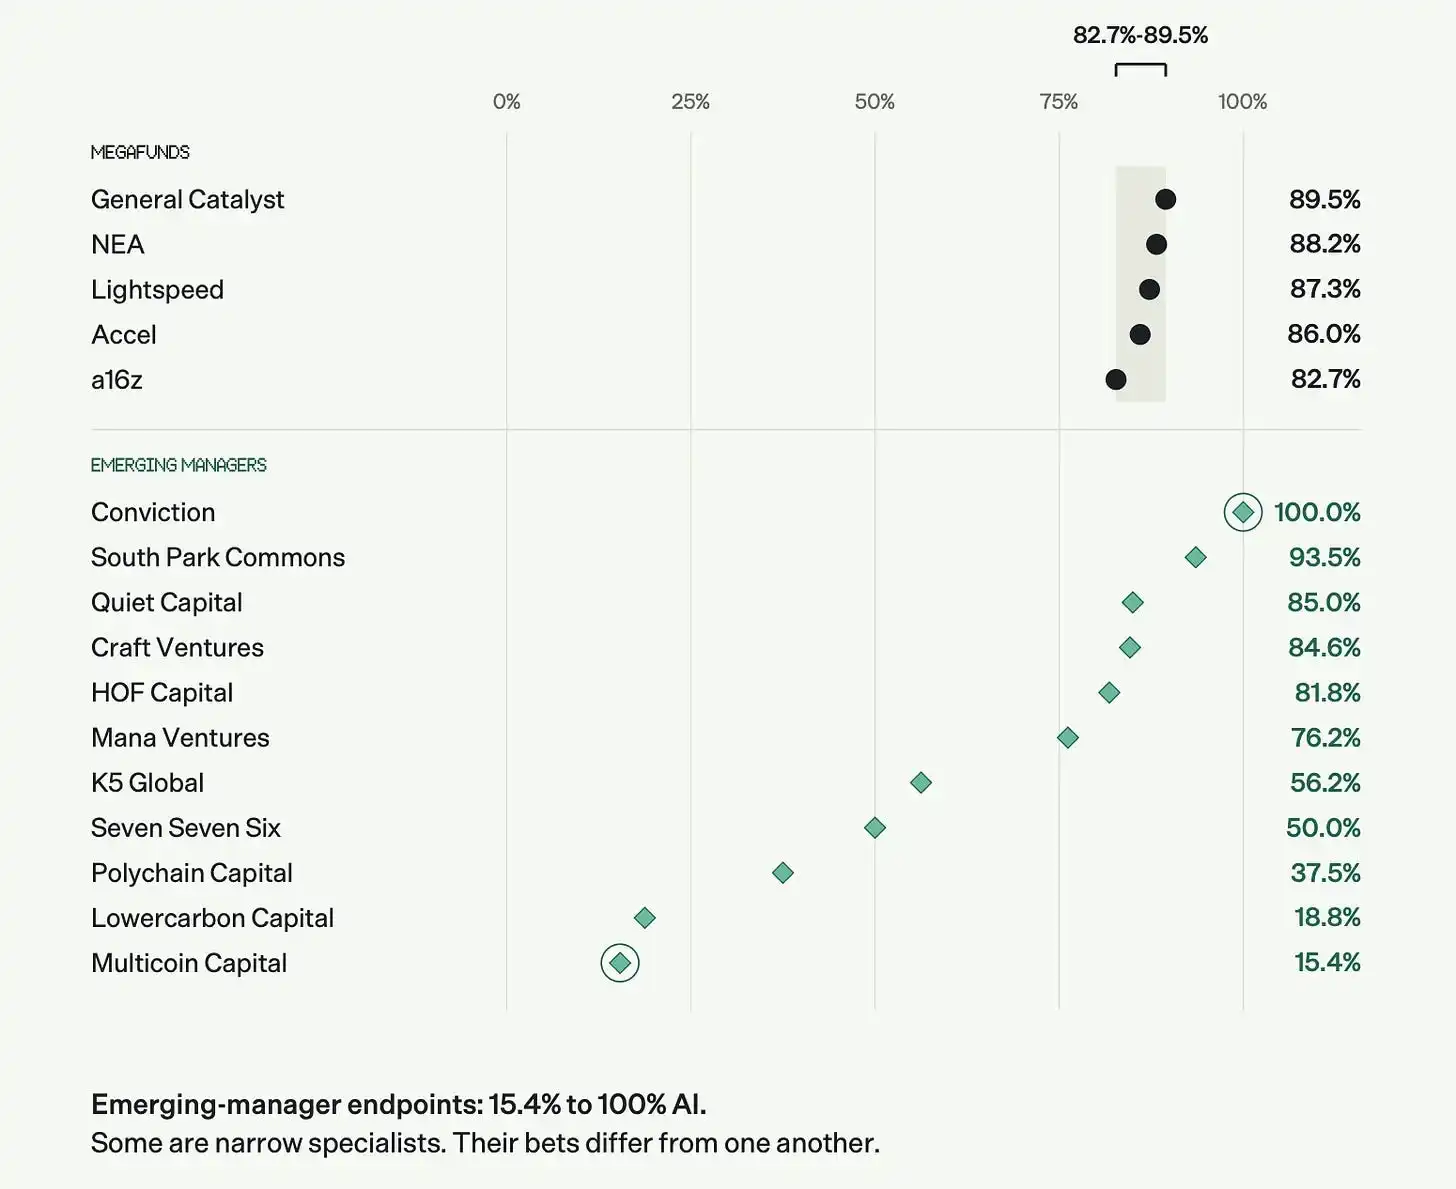
Dan Grey of Odin used Dealroom data to score seed investments made between 2023 and 2025 by two groups: five mega-funds — Andreessen Horowitz (a16z), General Catalyst, Lightspeed, New Enterprise Associates (NEA) and Accel — and a selected set of top emerging managers.
The scoring framework measured rarity across two dimensions, business and technology. On the business side, it looked at sector, model, customer and geography. The benchmark was the full universe of seed-funded companies from 2018 through 2025. The most unusual fifth of companies counted as outliers.
Emerging managers allocated 24.7% of scoreable seed investments to outlier profiles, or 49 out of 198. Mega-funds allocated 11.5%, or 32 out of 278. That is roughly a twofold gap.
The article does not frame this as proof that every smaller fund is more contrarian. Many emerging managers are also heavily concentrated in AI. Conviction was 100% AI, while South Park Commons was 93.5%. The difference came from specialist funds with different mandates, including Lowercarbon at 18.8% AI and Multicoin at 15.4%.
Portfolio construction is where the divergence becomes clearer. Combining five different emerging-manager books typically reduced concentration by 22.6%. Combining five mega-funds reduced it by only 2.0%, because all five were already sitting in an AI allocation band of 82.7% to 89.5%. Out of 462 possible emerging-manager combinations, only two failed to outperform the mega-fund group.
Odin stops short of claiming that the data proves a financing mechanism, but the article links the result to a long-running line of research: whether investors expect follow-on capital to be available can shape which experiments get the first check. If the deepest pools of capital are mostly writing checks into companies already seen as investable by the market, firms outside that consensus may depend on someone else to fund them first.
That does not mean emerging managers are better at picking winners. In this framework, “outlier” means rare among funded companies. It does not mean more innovative, and it does not mean more likely to succeed. Once founder background is added to the scoring, the gap narrows to 19.8% versus 14.4%. The emerging-manager sample was also curated rather than market-wide. Smaller funds have their own herd phases as well: blockchain made up 46.7% of their early rounds before falling to 20.9% later.
The practical takeaway in the piece is aimed at allocators. If returns come from outliers, adding another brand-name fund may simply add more of the same exposure. A basket of funds with genuinely different mandates can widen coverage. Even then, breadth alone is not enough. Odin’s own test asks what a fund adds that the existing portfolio lacks, at what fee and side-letter terms, with what diluted ownership and with what follow-on financing risk.
Nine years in, most VC funds still have not paid LPs back
Carta’s Q2 2026 VC fund performance report tracked roughly 3,000 U.S. venture funds that began investing between 2017 and 2026. The key metric was net DPI, the amount of cash actually returned to LPs for each dollar they paid in.
Funds that started investing in 2017 are now about nine years old in the article’s framing, close to the end of a standard 10-year venture fund life. The median fund had returned only 0.37x in cash. Even the upper quartile was at 0.70x. Only the top 10% had returned more than paid-in capital, at 1.37x.
Younger vintages looked weaker. The median 2018 fund had returned 0.15x. The median 2019 fund was at 0.04x, which means 4 cents back on the dollar after seven years.
There is still value on paper. The median 2017 fund had a paper value of 1.72x, but only about one-fifth of that had been returned in cash. The rest remained locked in private companies that had not yet been sold or listed.
Another detail helps explain why the picture can look less severe from the outside. Most of these funds have returned at least some cash. Among 2017 funds, 86% had made at least a partial distribution. Among 2018 funds, the figure was 70.4%. So almost every fund can tell LPs that distributions have started. Far fewer can say they have actually paid the money back.
The article argues that founders should care because a fund’s clock is not the same as a company’s clock. A fund nearing maturity, still short of cash returned to LPs and trying to raise its next vehicle has a stronger incentive to find liquidity sooner. That pressure can show up in pushes for an earlier sale, a secondary sale of the fund’s stake, or more caution around writing follow-on checks in the next round.
The piece is careful not to overstate the point. Carta’s data shows a cash gap, not how every fund will behave. Funds can extend their lives, and many top firms still have reasons to keep backing their winners. But the vintage year of the fund writing the check is no longer a footnote. A partner investing out of a 2017 or 2018 fund is operating under very different conditions from one investing out of a fresh 2025 fund.
The risk, in the article’s framing, is not simply that an investor needs liquidity. It is that a founder may not know which fund the money is coming from, how much cash that fund still owes its own LPs, or how that reality could shape advice on the next financing or an exit.
Where the biggest AI dollars are actually going
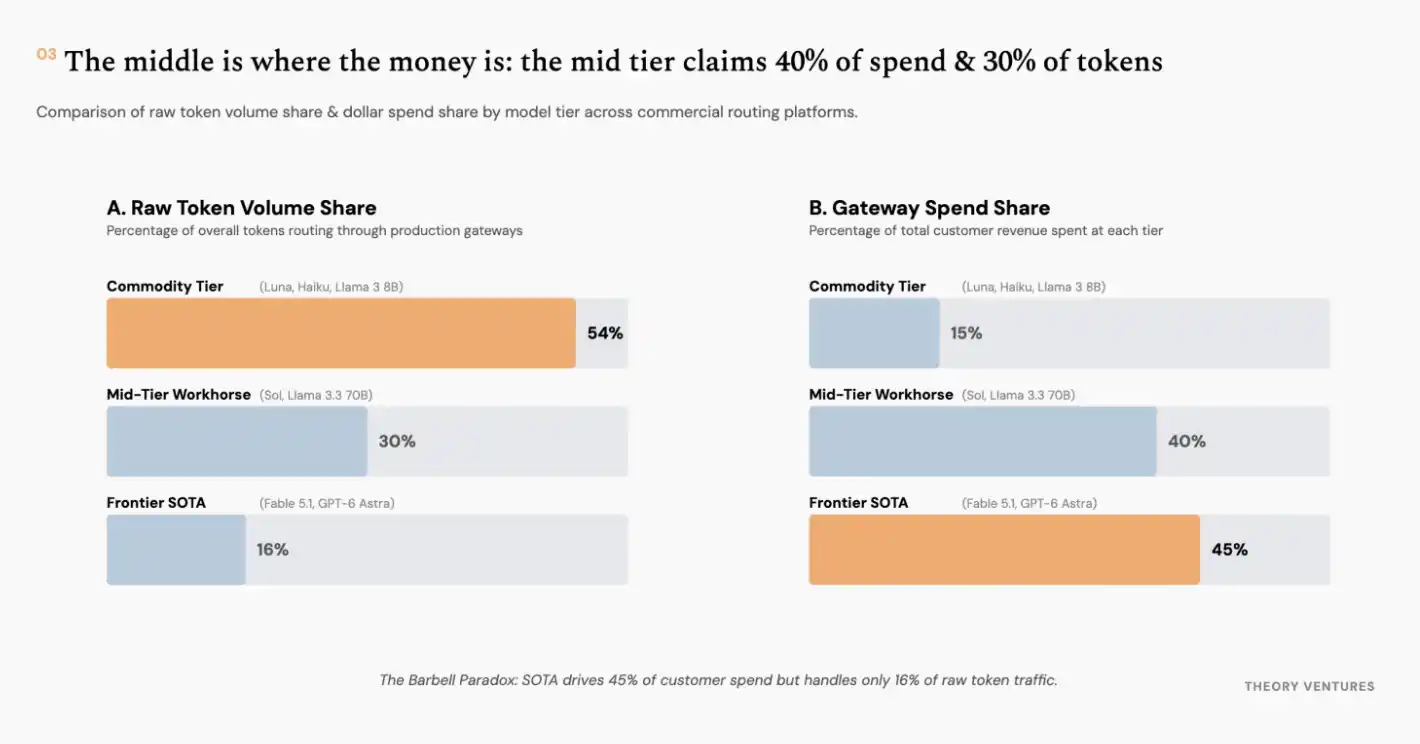
Theory Ventures’ Tomasz Tunguz argues that the most important AI market is the middle tier rather than the frontier. The spending data cited in the article supports that view: the middle tier already accounts for about 40% of AI spend and 30% of token usage.
The frontier slice looks much thinner. Anthropic’s strongest model, Fable 5.1, represented only 3.7% of gateway spend in its first 12 days after launch. Its predecessor peaked at 13.2%, then fell to 4.9% a month after Opus 5 launched at half the price. In large enterprise accounts, frontier-model token consumption dropped from 53% in early August to 45% in September.
Pricing pressure is concentrated in that same layer. When Anthropic cut prices on a new model in September, OpenAI followed roughly 90 minutes later, according to the article. Before that move, the Opus line had held the same pricing for four versions in a row: $5 per million input tokens and $25 per million output tokens. At the lower end, OpenAI cut Luna pricing by 80% in July and by another 50% in September.
The article points to three forces pushing middle-tier prices lower on a continuing basis:
- Competition between labs. Price matching now happens within hours rather than over several quarters.
- Open-weight models. On gateways that disclose the data, open models handle most token volume and are priced 86% below the blended price of closed models.
- Fine-tuning. Cursor Composer 2, fine-tuned on the open-weight Kimi K2.5 model, cut total cost by 86% versus its previous in-house model. Harvey cut cost per cell by 55% relative to Sonnet 5 while scoring above Fable 5.
The article treats this as structural rather than temporary. The tasks enterprises want AI to do — summarizing a contract, classifying a support ticket — do not change much year to year. The cost of intelligence needed to clear that threshold is falling quickly. As a result, the layer that is good enough for fixed requirements gets cheaper every quarter, and most real work sits in that layer rather than at the frontier edge.
Demand therefore looks less like a pyramid with the frontier at the top and more like a bell curve with a thick middle. Buyers care about how much intelligence they can buy per dollar, not peak capability. The open question is whether that middle market eventually becomes a commodity. If it does, the economics of the AI market change with it.
For companies building on top of these models, the article’s question is direct: what tier does the product actually need? Paying frontier-model prices for middle-tier work is presented as one of the easiest ways to lose margin.
How much should a startup spend on AI
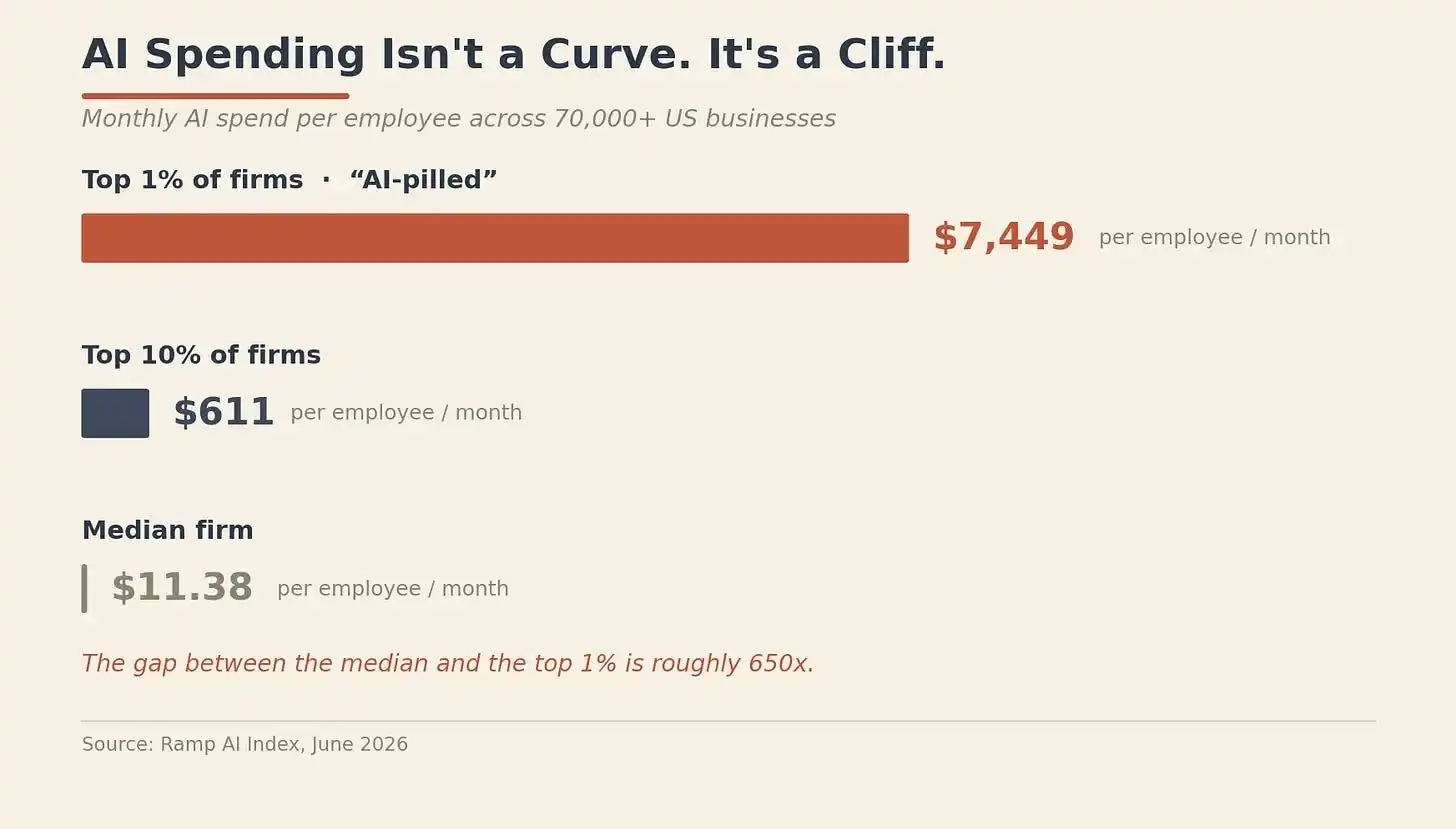
The article then turns to company-level AI budgets, using payment data from Ramp, which covers more than 70,000 U.S. businesses. The headline point is dispersion. “Using AI” no longer means one coherent spending pattern.
The median company spent $11.38 per employee per month on AI. The top 10% spent $611. The top 1% spent $7,449, roughly 650 times the median.
When Ramp linked those payments to workforce records from Revelio Labs covering 21,559 companies, high-spending firms showed 10.2% employee growth over two years, including a 12% increase in entry-level hiring. Low-intensity users showed no statistically significant change.
The article argues that many founders benchmark AI bills against software budgets because the charges sit next to products such as Figma and Notion on the statement. That is the wrong denominator, it says. More and more AI spending is replacing labor rather than software. A customer support agent should be compared with a support role, not with a SaaS bundle.
One example in the piece uses a typical seed-stage company: 12 employees, about $180,000 in monthly payroll, and $4,000 in monthly AI spend. Against a software budget, $4,000 looks heavy. Against payroll, it is only 2.2%. Same number, opposite conclusion.
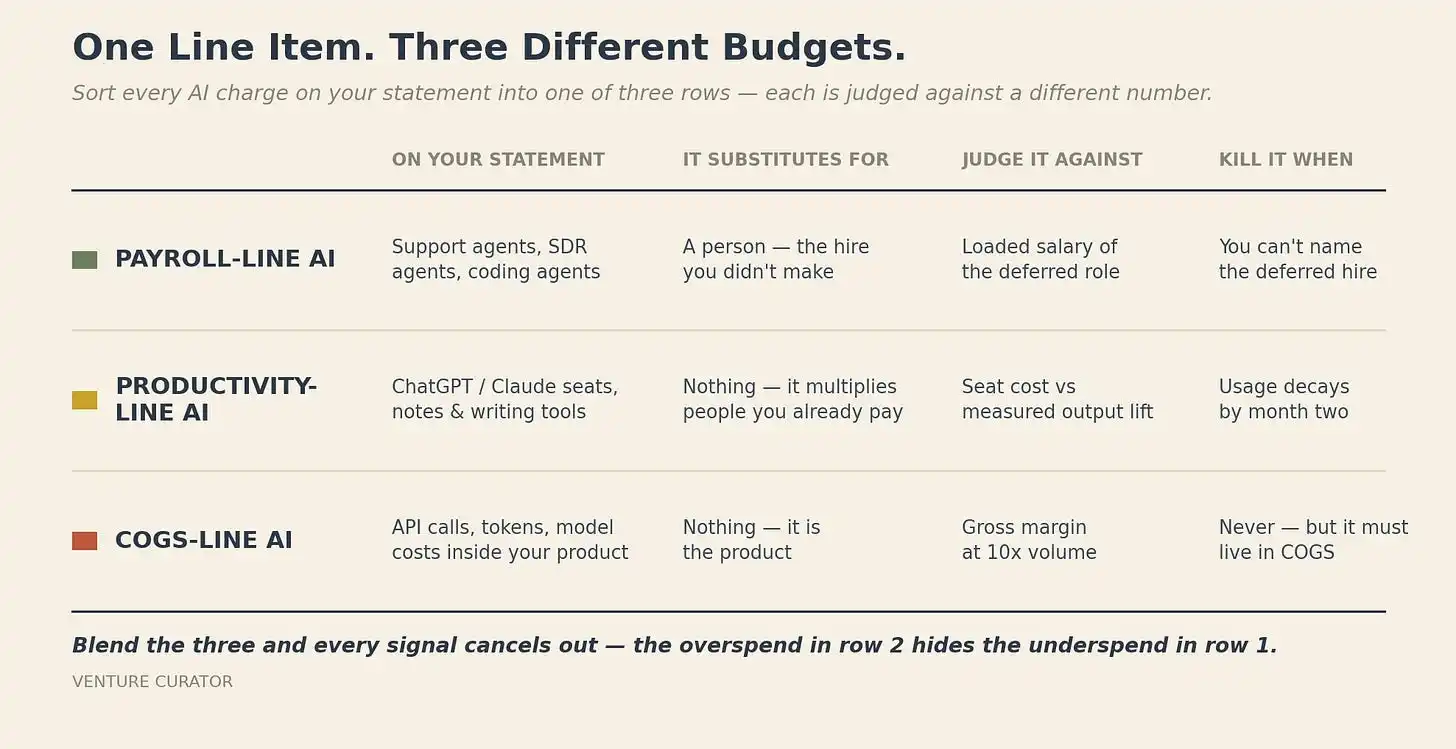
The proposed fix is to split AI budgets into three buckets and judge each one against its own benchmark:
- Payroll-line AI, such as support, SDR and coding agents, should be measured against the salary of the person not hired. If the role cannot be named, it should not sit in this bucket.
- Productivity-line AI, such as seats, note-taking and writing tools, should be judged by usage. If usage decays by month two, cancel it.
- Cost-line AI, such as internal product token and API calls, should be judged on gross margin at 10x scale and booked into COGS.
Mixing the three together blurs the signal. Overspending on seats can make the total bill look bloated, which then causes founders to hold back on agent spend, even if that is where the return sits. In the article’s framing, the top 1% are not winning because they spend more in aggregate. They are winning because the spend is categorized correctly: aggressive where AI replaces labor, strict where it only speeds up labor, and margin-focused where it sits inside the product.
Why deep-tech diligence may be getting worse
PostQuantum’s Marin Ivezic argues that the harder the technology and the larger the deal, the less likely it is that someone independent has verified whether the science actually holds up. The article attributes that to several structural shifts.
One is the disappearance of an expert layer. Investors once had access to independent technical judgment through bank research teams staffed with specialist analysts. After Europe’s MiFID II rules in 2018 required research costs to be unbundled from trading fees, that model contracted. The article says European equity research shrank by about 20%, and specialist analyst headcount at major banks also fell.
Expert networks have filled part of the gap and are now a roughly $2.5 billion business. But they only work if the investor already knows which expert to call and what to ask. In frontier fields, that is exactly the knowledge generalist investors often lack.
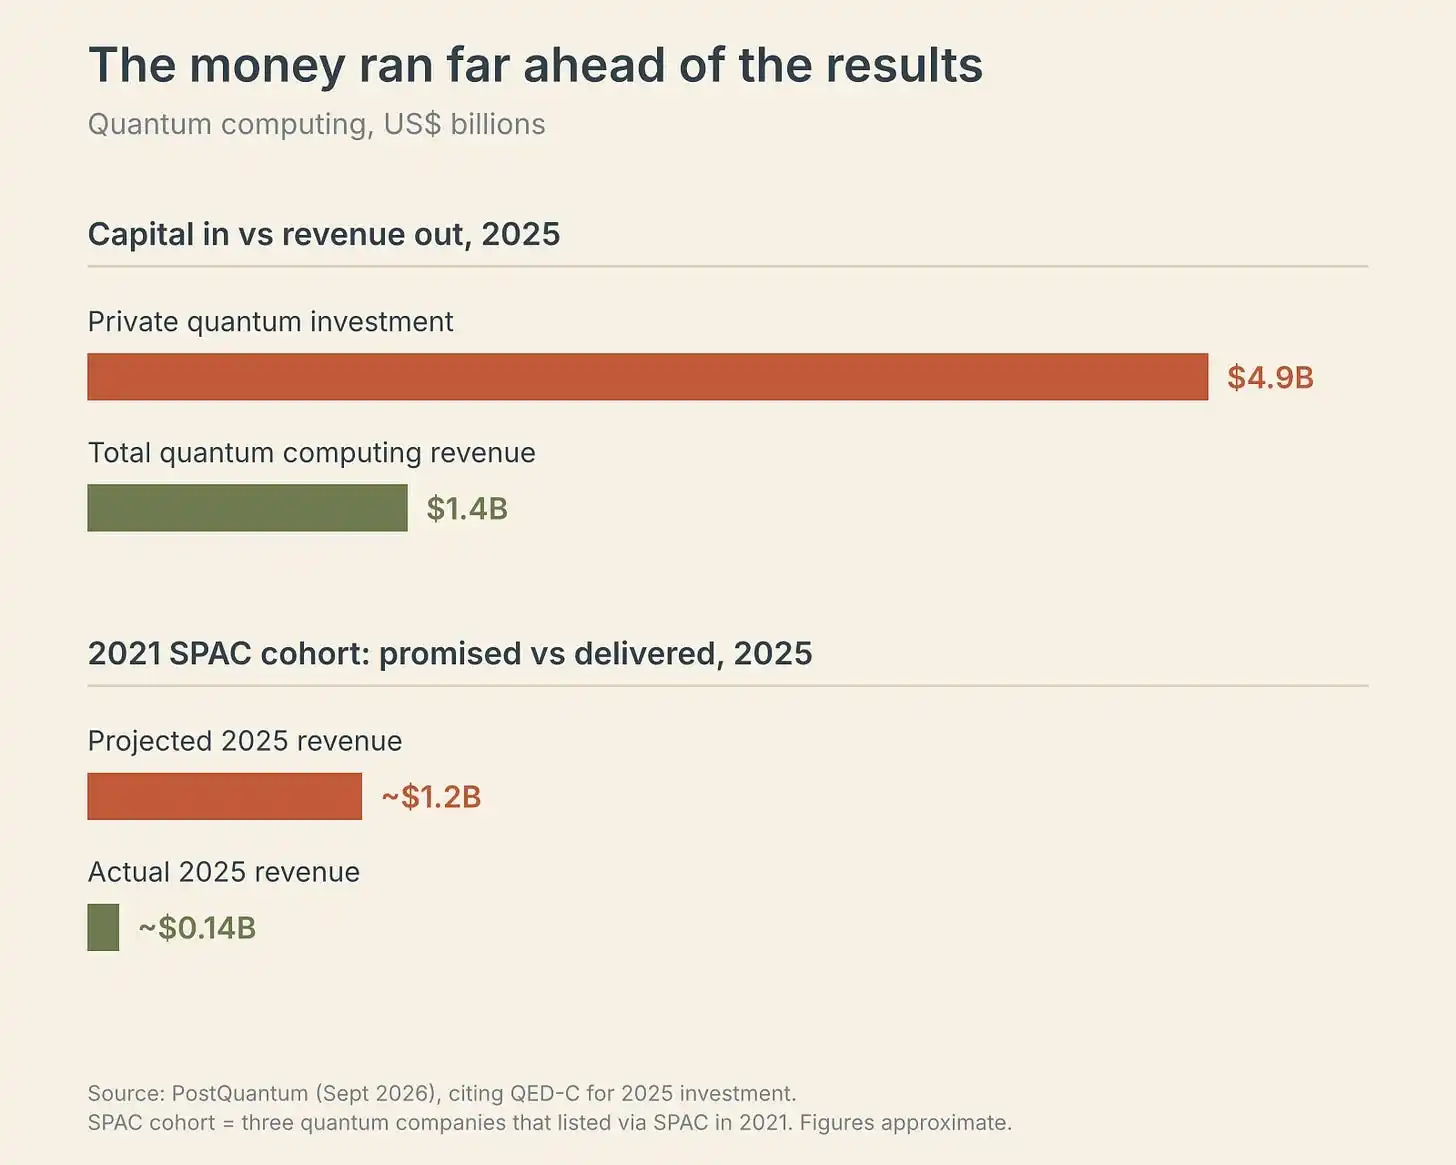
Another shift is where the money is coming from. Private quantum investment reached $4.9 billion in 2025, up 192%. The largest investors were BlackRock and NVIDIA rather than specialist quantum funds. Sovereign wealth funds and pensions are also participating more often in these rounds. The article cites a survey showing that 58% of sovereign funds lack the resources needed to lead a deal. Capital that cannot run its own technical review ends up leaning on someone else’s judgment.
A third shift is that the lead investor’s brand can replace the diligence itself. A prestigious lead gives everyone else a form of credit endorsement. Followers assume the lead has checked the physics, but they do not see the work and cannot confirm that it happened. In some rounds, even that signal is absent. Quantinuum’s $600 million financing had no named lead investor, according to the article.
Time pressure and herd behavior add to the problem. By the end of 2023, U.S. funds were sitting on a record $311.6 billion of dry powder. For a manager under allocation pressure, joining a hot round can be more rewarding than slowing it down. Being wrong with peers also tends to carry less reputational damage than being wrong alone.
Deep tech also lacks hard checkpoints. The article contrasts this with biotech, where the U.S. Food and Drug Administration approval process forces staged data disclosure and has produced a full diligence system around scientific advisory boards, specialist reviewers and milestone-based checks. Quantum has no equivalent gate. The strictest technical review the article could find for a major quantum company came from the Australian government through a freedom-of-information request, not from investors.
The numbers show the mismatch. Private quantum investment reached $4.9 billion in 2025, while total revenue for the quantum computing industry was about $1.4 billion. Three quantum companies that went public through SPACs in 2021 had projected combined 2025 revenue of about $1.2 billion. Actual delivery was about $138 million. The article adds that some of the most rigorous verification work came from short sellers rather than investors.
It compares the setup with cleantech from 2006 to 2011, when venture investors put more than $25 billion into the sector and lost more than half. Scholars studying that cycle warned at the time that pensions and sovereign funds without hardware experience would become the next source of money for such companies.
The proposed remedy is straightforward. Before following into a deep-tech round above a certain size, LPs should require an independent technical-feasibility review that is not commissioned by the fund and not selected by the founder. The author discloses an investment in quantum startups and also runs a company that provides this kind of review. Even so, the article’s central point is clear: in deep tech, a logo on the cap table has quietly started to replace technical verification, and at these check sizes, a few weeks of independent review is not expensive.