
Wall Street is confronting two competing historical scripts after the Federal Reserve paused rate hikes and large-cap technology earnings landed in quick succession. Deutsche Bank is leaning on long-run seasonality and the usual year-end rally pattern. BTIG is looking at a much narrower analogue: the path semiconductor stocks took around the 2000 tech bust.

At the center of the disagreement is not just earnings or the Fed decision. Jonathan Krinsky, BTIG’s chief technical strategist, argues that the market still has not seen the kind of real washout that tends to precede a durable bottom. In his framework, this rebound says more about how traders are reacting to price action than about a true reset in positioning.
Deutsche Bank’s case for a Christmas rally
Jim Reid of Deutsche Bank wrote in this week’s daily chart note that S&P 500 data going back to 1928 show the index’s final low in a typical year tends to arrive around Oct. 27. From there, he said, the market in an average year is largely a one-way move higher into year-end.
Reid also cited research from Binky Chadha and Parag Thatte. In 21 of the past 23 midterm election years, the S&P 500 posted gains in the three months after an early-October low. The logic is straightforward: election uncertainty fades, equities have already gone through a pullback, and political gridlock is often treated as supportive for risk assets.
He described 2026 as a milder version of the midterm-election script. The S&P 500 hit a record high on May 29 and was up about 11% for the year, yet nearly five months later it was still less than 1% below that peak. Reid wrote, 「Seasonality is not destiny, and concerns around Iran, artificial intelligence, and France will not magically disappear. But if history is any guide, this is often the point when the Christmas rally starts to warm up.」

He also flagged the risk in relying on averages. Dispersion can be wide, and 1962, 1974, 2002, and 2022 were all midterm years that ended up as bear markets. The year 2002, notably, was also when the 2000 tech bubble finally bottomed.
Krinsky’s 2000 semiconductor template
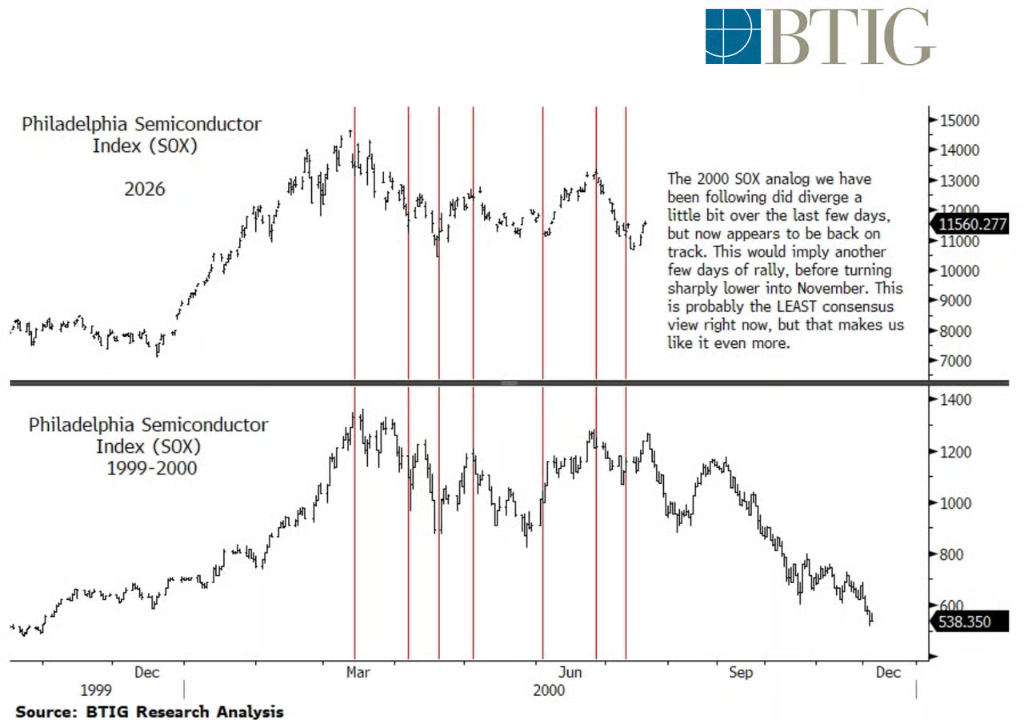
Krinsky said he has been tracking a historical simulation of the 2000 Philadelphia Semiconductor Index, or SOX, since September. His point is that after SOX peaked on March 14, 2000, some individual names kept making new highs even as the index itself never truly recovered. He sees a close resemblance to this year’s setup.
In that 2000 episode, SOX fell from roughly 1,200 in early September to about 540 in early December, a drop of more than 55%. That path had nothing to do with a holiday rally. Krinsky said the template briefly drifted off course last week but has now moved back into line.
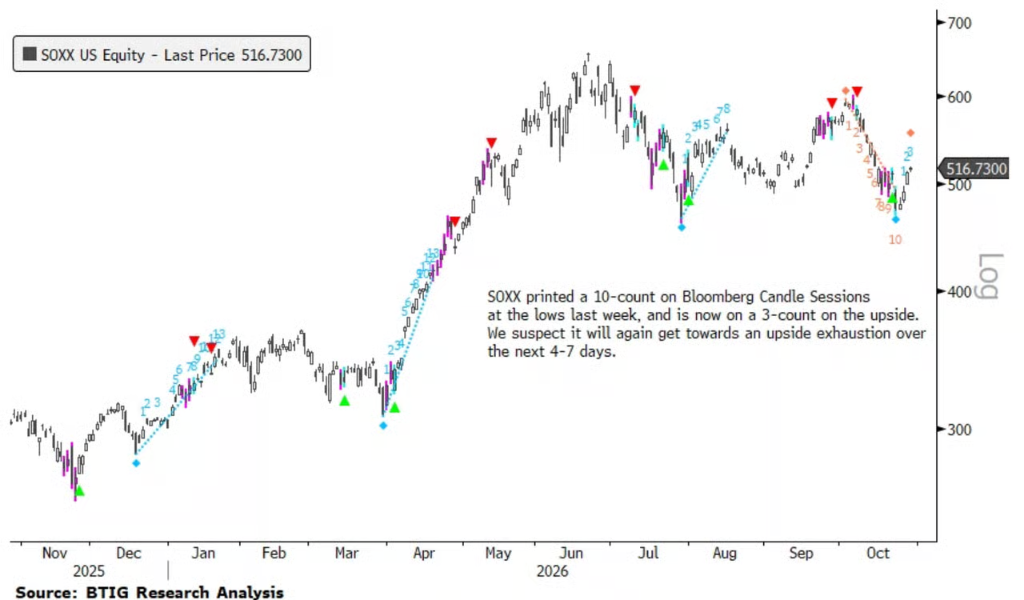
His near-term call is for SOXX, the semiconductor ETF, to keep rebounding modestly over the next several days into a 550 to 570 range, then turn sharply lower around U.S. midterm election week. He said, 「This may be the most non-consensus view in the market right now, but that is exactly why we care about it.」
From a technical standpoint, SOXX has found support near its 200-day moving average. Krinsky is not convinced that support will hold. He said the ETF is likely to run into pressure around the 200-day average near $475. Bloomberg Candle Sessions counts, he added, showed SOXX triggered a 10-count low last week and is now on an upside count of three. That setup points to another exhaustion signal in the next four to seven trading days, which would place the timing around midterm week.
Why he says the washout is incomplete
Krinsky’s broader argument is that real bottoming rallies usually come after a full clearing event. He does not think the market has reached that point.
Across the S&P 500’s 11 sectors, only communication services currently has a relative strength index below 49. He contrasted that with March 31 this year, when only three sectors had RSI readings above 50. In his reading, the difference in oversold conditions is stark.
The options market also does not show the kind of fear that often accompanies a true low. The current 20-day equity put-call ratio stands at 0.59, while the total put-call ratio is 0.87. Around the market’s real low in March, those readings were about 0.67 and close to 1.0. Krinsky’s conclusion is that the hedging demand that usually appears before a durable rebound simply has not shown up this time.
There has been some degree of hedge fund cleansing. Charlie McElligott of Nomura said that during October’s artificial-intelligence growth scare and momentum unwind, about 100 multi-strategy portfolio managers had already been forced out. He also noted that traders bought roughly $1.6 billion delta of Mag7 call options on the day of the Fed decision.
For Krinsky, that only reinforces the point. The cleanup is still happening, and fresh bets are already being layered back in.
Earnings season has not delivered the reset he wanted to see
Krinsky said the two marquee mega-cap technology earnings reports so far this season have not produced the kind of clearing event that would support a more durable bullish turn.
Microsoft rose about 6% after hours, helped by stronger-than-expected Azure cloud results, but orders and backlog data were less impressive. Google, by contrast, fell about 8% after revenue and profit both missed expectations, dropping to its lowest level since April. The article also said Google’s free cash flow has now been negative for a second straight quarter, and that both Google and Meta have joined the list of companies for which the market is unwilling to pay up for AI capital spending.
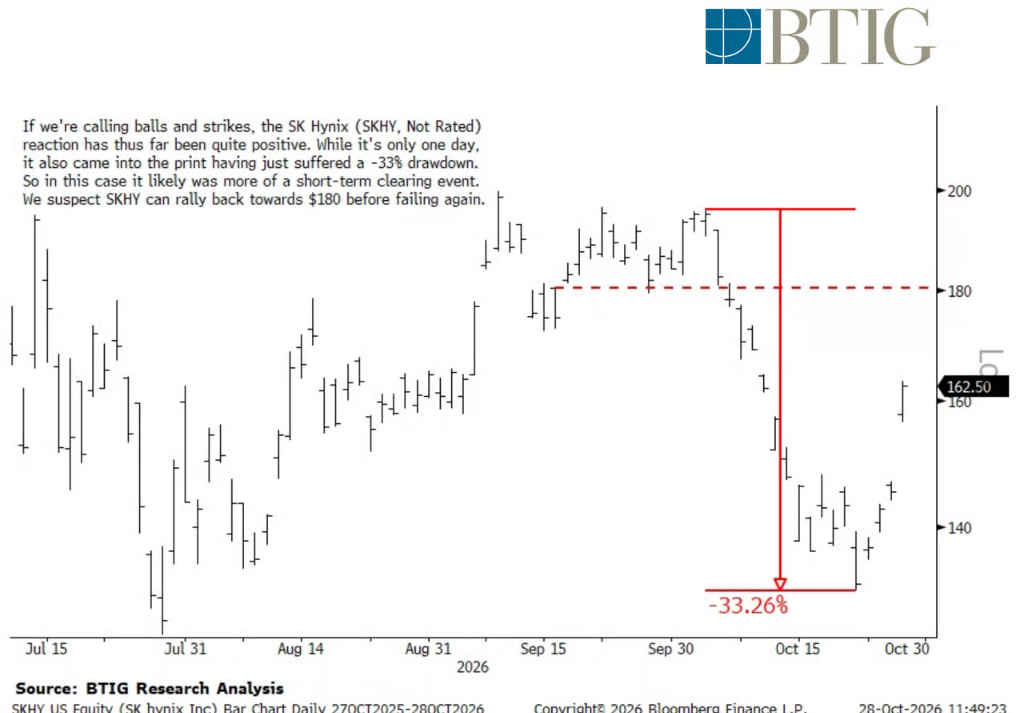
South Korean memory chip maker SK Hynix was one of the few brighter spots this season and helped lift sentiment in related names. Krinsky acknowledged that this looked closer to a genuine short-term clearing event because the stock had already gone through a drawdown of about 33%. He said the shares could rebound toward $180, though he still expects renewed pressure after that.
The Fed pause did not settle the direction question
The Federal Reserve, according to the article, also failed to provide a clear directional signal. The central bank paused rate hikes as expected, but Hammack and Lisa Cook unexpectedly voted in favor of a hike. After the meeting, the Fed chair delivered a hawkish press conference, yet equities still moved higher.
The article also highlighted that the Fed has folded AI-related memory demand into its inflation assessment framework. In that telling, the memory boom now helping drive the semiconductor rebound has also become a potential variable in a tighter policy backdrop.
Two histories, one November test
The split comes down to a methodological question: should investors trust a statistical pattern built on 98 years of average data, or a single historical analogue that appears to fit the present tape more closely?
Deutsche Bank has the advantage of sample size. Krinsky’s rebuttal is that 2026 does not look like an average year. The S&P 500 is less than 1% below its record high, options positioning does not reflect panic, only one sector is in oversold territory, and the market sold off after two flagship technology earnings releases. In his view, once too many investors are leaning on the same Christmas-rally chart, the clearing effect may already have been spent by the expectation itself.
That leaves a narrow near-term path in his framework: SOXX completes one more rebound leg into the 550 to 570 area over the next several days, then reverses around midterm week. The article added one caveat. If Microsoft’s gains hold and buyers step in to absorb Google’s drop the next day, the year-end rally case is not dead. By that measure, Friday’s close may offer the clearest signal yet.
The original article was written by Xu Chao and sourced from Wallstreetcn.