

Crypto markets paused on Thursday after what Decrypt described as one of the cleaner macro-driven rallies of 2026. U.S. June Consumer Price Index data showed a 0.4% drop, the sharpest single-month decline since April 2020. That pushed July Federal Reserve rate-hike odds down from 31% to single digits, lifting equities and giving digital assets room to move higher.

Wall Street earnings added support. Goldman Sachs, JPMorgan, Morgan Stanley, and Citi each reported second-quarter results above expectations. Earlier this week, Bitcoin broke through the $64,000 resistance that had capped price action for weeks, according to Decrypt’s Tuesday coverage. Ethereum outperformed, climbing nearly 6% in a day and touching $1,900.
By Thursday, the market was easing rather than unraveling. Most top-50 coins were down less than 3%. Ondo was the clear outlier, up more than 14% and leading the top 100 by market capitalization on tokenization momentum.
XRP did not join the move in the same way
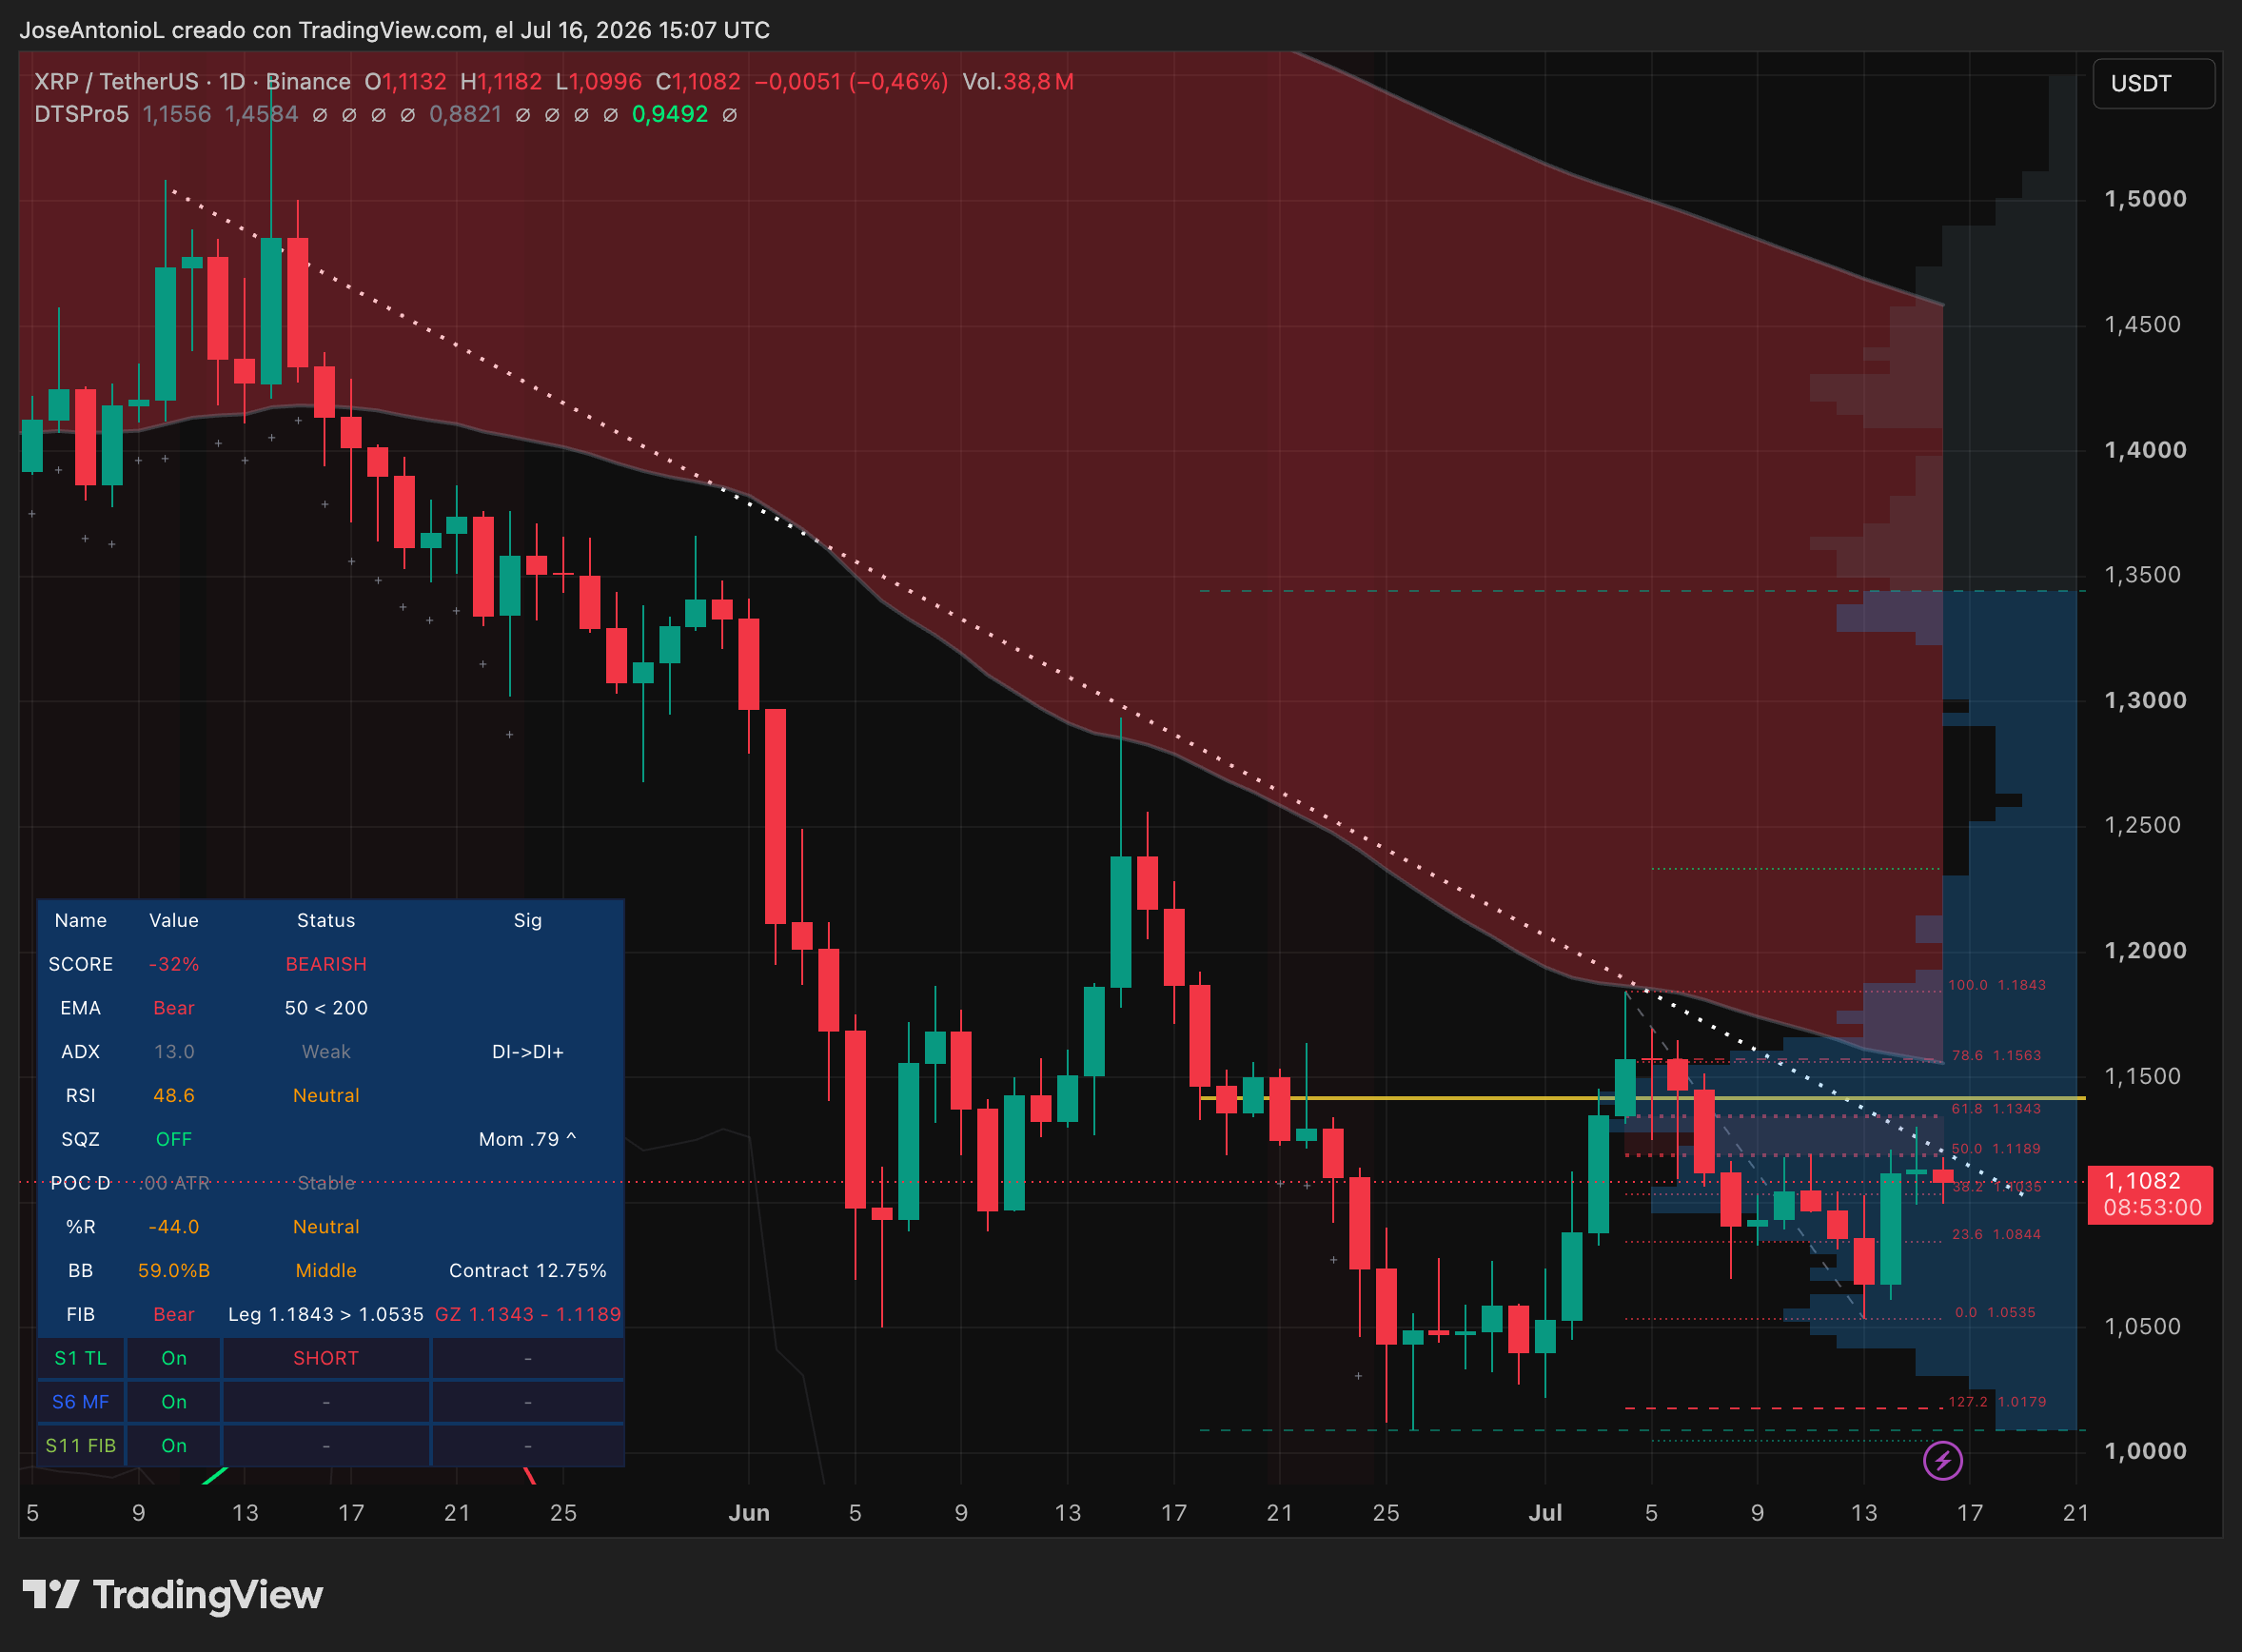
XRP’s rally looked notably weaker. The token created by Ripple co-founders opened Thursday at $1.11257, traded as high as $1.11722, and later changed hands at $1.10650, a decline of 0.54%. It did not break down sharply, but it also failed to participate meaningfully during the stronger sessions. Even with the broader market pulling back, which made relative comparisons easier, XRP still did not stand out.
The article’s broader point is that XRP failed to clear the resistance zone established during the crypto winter when momentum was available. With the market now cooling, the XRP Army appears less optimistic than traders in other altcoins.
Capital is still concentrated in BTC and ETH
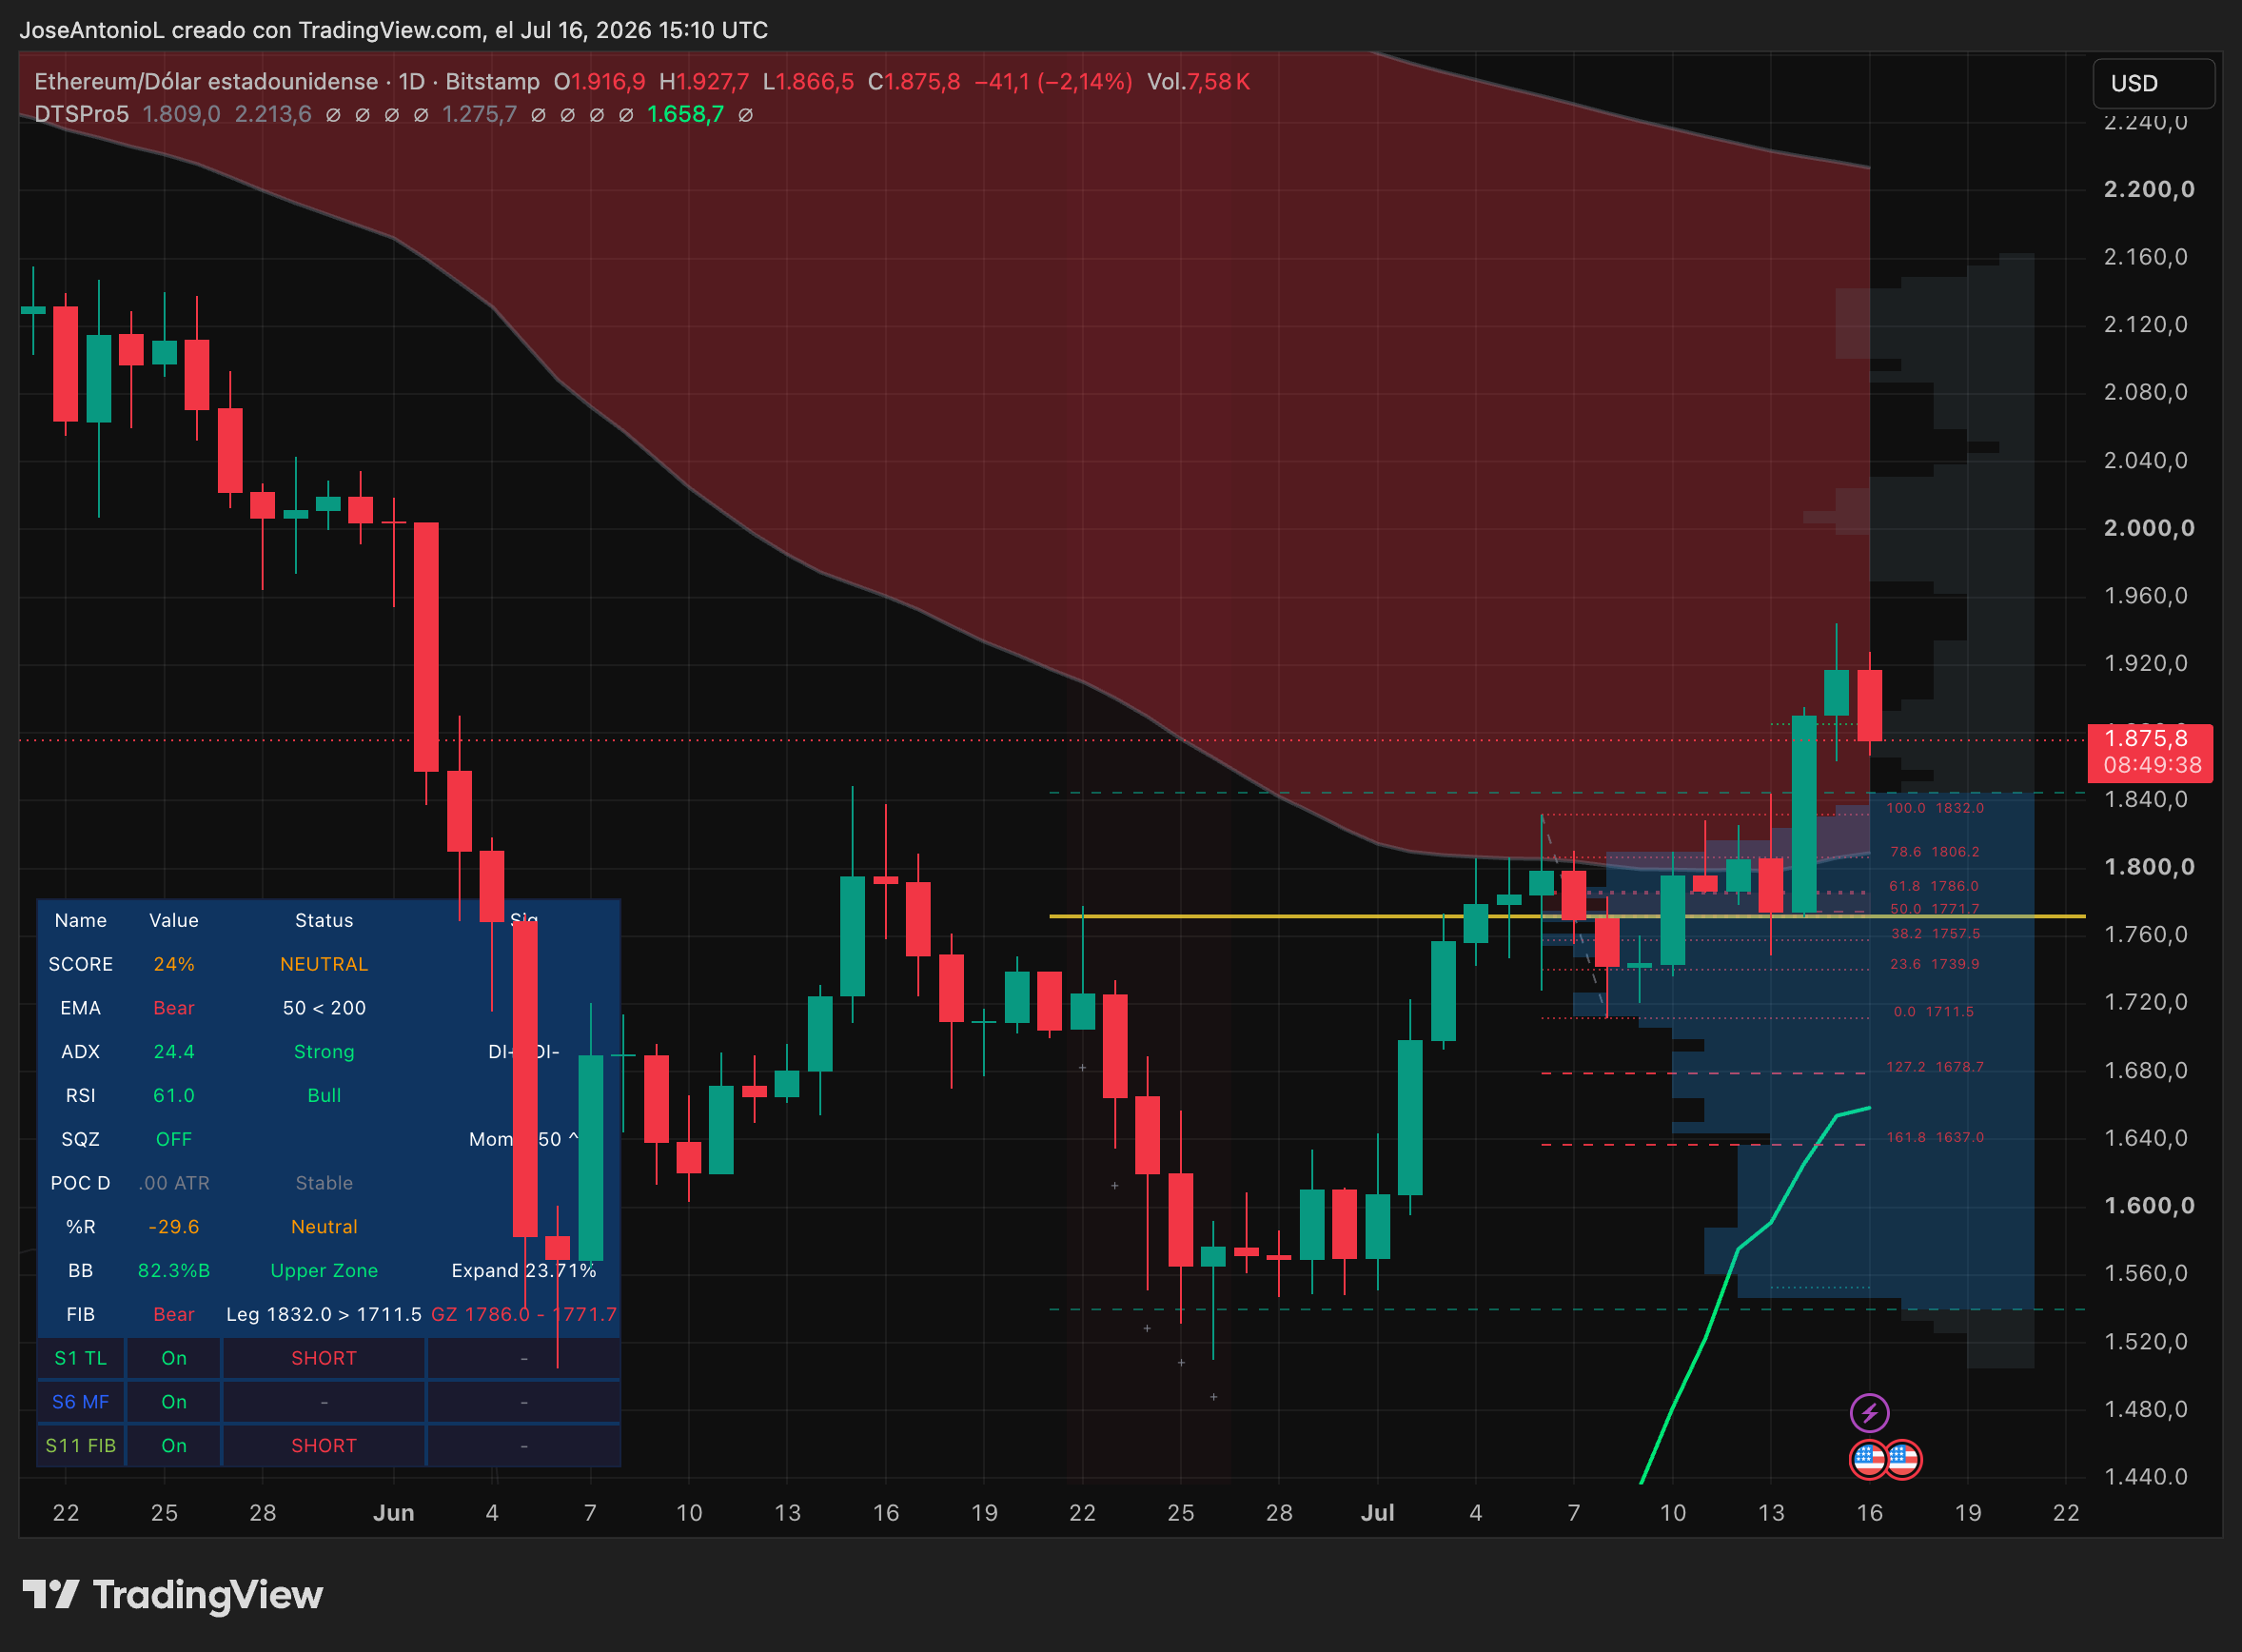
The analysis argues that when money returns cautiously to crypto after a risk-off stretch, it does not spread evenly across the market. Bitcoin tends to absorb that flow first. Ethereum usually follows, and ETH has historically led broader crypto recoveries. That pattern, the piece says, is exactly what played out this week.
On a short-term basis, Ethereum appears more bullish than Bitcoin. It suffered a steeper drop earlier, which may explain why the rebound has shown stronger momentum.
The Altcoin Season Index sits at 45. A reading below 50 points to continued dominance by BTC and ETH rather than a rotation into altcoins. The same dynamic was visible in early July. During a $602 million short liquidation event that pushed Bitcoin back toward $62,000, XRP gained only 3%, while Ethereum and Solana posted moves that were nearly twice as large.
The missing catalyst: no fresh timeline for the Clarity Act
The piece also points to an XRP-specific gap. The Clarity Act, U.S. legislation that could classify XRP as a commodity and open the door to institutional ETF demand, did not make its expected July 4 appearance on the Senate floor. Without a new date on the calendar, XRP is left trading mainly on macro sentiment, and in that setup it has been losing ground to Ethereum.
XRP enters a technical decision zone
XRP opened the day’s candlestick at $1.11 and was trading around $1.10 at the time of writing, with a market capitalization of roughly $69 billion and a small decline of about half a percent. The token is now testing a weak support zone within its latest bearish leg, a move that ran from $1.18 down to $1.05.
That leaves price at a decision point. If support holds, the next push could target $1.13. If the market loses $1.08, the path toward $1.06 and then the critical $1.02 floor opens again.
ADX, EMAs and RSI all show limited conviction
The Average Directional Index, or ADX, reads 13.3, well below the 25 level commonly used to confirm that a real trend is in place. ADX measures trend strength on a 0 to 100 scale without indicating direction. The article compares it to a car running in neutral: the engine is on, but it is not going anywhere. Traders often associate readings below 20 with choppy, directionless conditions where false breakouts are common.
There is one modestly constructive sign. The directional indicator is shifting from DI-, which reflects bearish dominance, toward DI+, which reflects bullish dominance. Even so, with ADX at just 13.3, that shift carries limited weight.
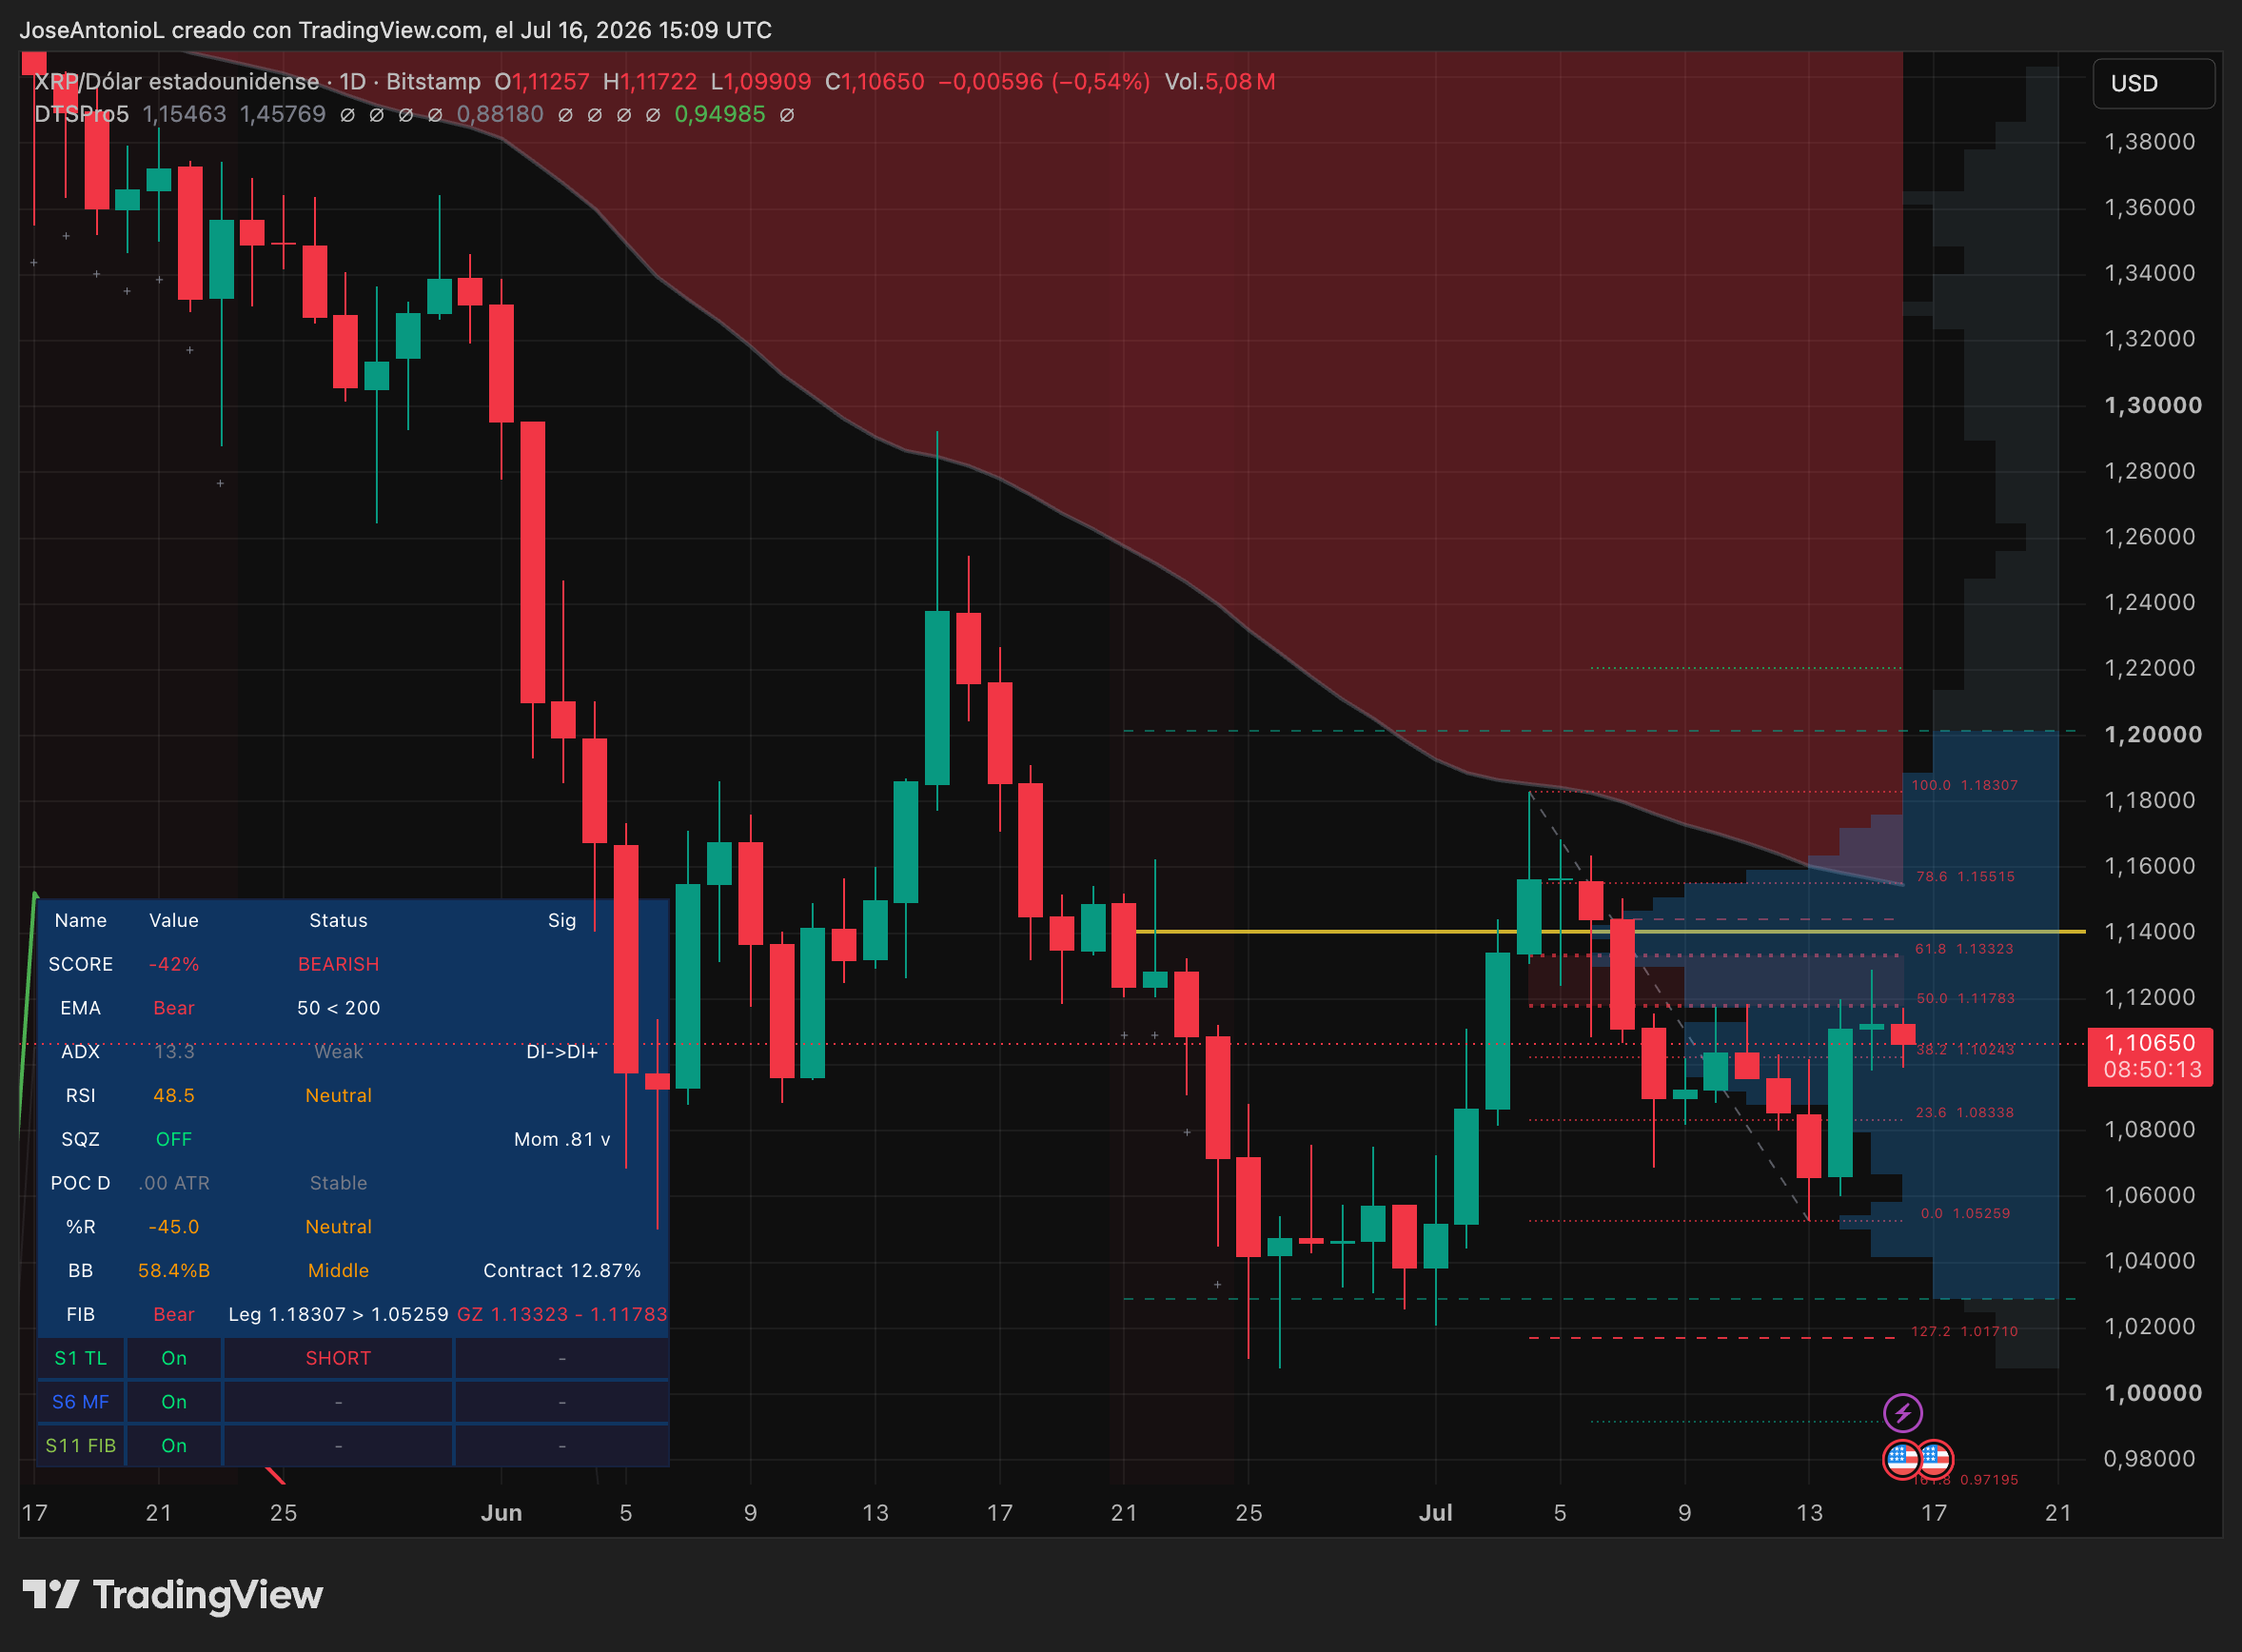
The Exponential Moving Averages offer a clearer bearish signal. XRP’s 50-day average remains well below its 200-day average, forming what traders call a death cross. In crypto, that is one of the most widely watched bearish trend signals. XRP has remained in that structure since falling from its $3.65 all-time high set in July 2025. Decrypt reported on Tuesday that Bitcoin is now dealing with its own death cross setup, but in XRP’s case there is still no sign that the two moving averages are starting to converge.
The Relative Strength Index stands at 48.5. RSI is a 0 to 100 momentum gauge, with readings above 70 usually viewed as overbought and readings below 30 as oversold. At 48.5, XRP sits near the middle, which suggests neither side has a clear advantage. The Squeeze Momentum indicator is off, with a momentum reading of 0.81v. That is slightly positive but still weak, enough to suggest energy is building but not enough to signal where the next break may go.
Looking at the chart, the article says XRP may soon begin flashing signs of price compression. Whether the eventual move breaks upward or downward will likely depend on two factors named in the analysis: whether Bitcoin can hold $64,000 and whether the Senate provides any update on the Clarity Act schedule.
The article notes that the views expressed are for informational purposes only and do not constitute financial, investment, or other advice.