
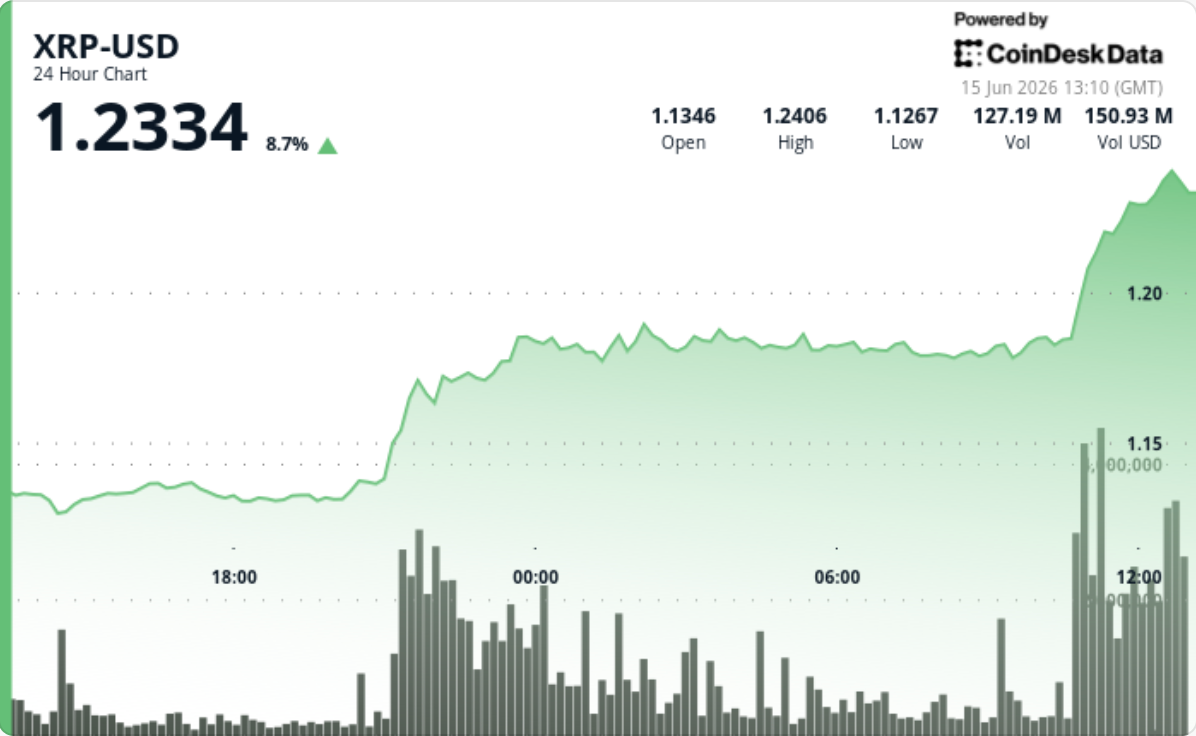
XRP spent the past two weeks trying to stop going down. Now it's trying to go higher. The token pushed through $1.14, then $1.18, and finally reclaimed $1.20 on the strongest volume since the early-June washout, forcing traders to reassess a market that had been priced for further weakness.
Upbit Drives XRP On-Chain Activity
South Korea's Upbit exchange accounted for 31% of XRP wallet-flow dominance by June 14, up from 13% a week earlier. The surge in Asian demand has boosted Ripple ecosystem activity and on-chain transfer volumes.
ETF Products Keep Attracting Capital
XRP ETF products continued to draw capital, bringing cumulative net investment to roughly $1.4 billion since launch. Institutional money flowing through regulated channels provides additional support to spot prices, echoing the structure seen after the 2024 Bitcoin ETF frenzy—but with even higher concentration in on-chain activity.
Technical Signals: Divergence and Volume Confirmation
After bouncing from the $1.05-$1.09 support zone, XRP's daily momentum indicators kept improving. Several analysts highlighted bullish RSI divergence—the token formed higher lows while momentum stabilized. Trading volume rose nearly 22% above the weekly average during breakout candles, indicating genuine buying rather than short-covering alone.
The larger downtrend on higher timeframes is still visible, but for the first time since the selloff began, bulls are forcing price through resistance rather than simply defending support.
Key Levels to Watch
• $1.20: The first level bulls need to defend. Holding above it reinforces the breakout structure.
• $1.27-$1.30: The next major resistance zone where multiple Fibonacci and historical levels converge.
• A move through that area would shift attention toward $1.35-$1.40 and potentially reopen discussion around a broader trend reversal.
• If XRP falls back below $1.18 and loses momentum quickly, traders are likely to view the rally as another oversold bounce rather than the start of a sustained recovery.