
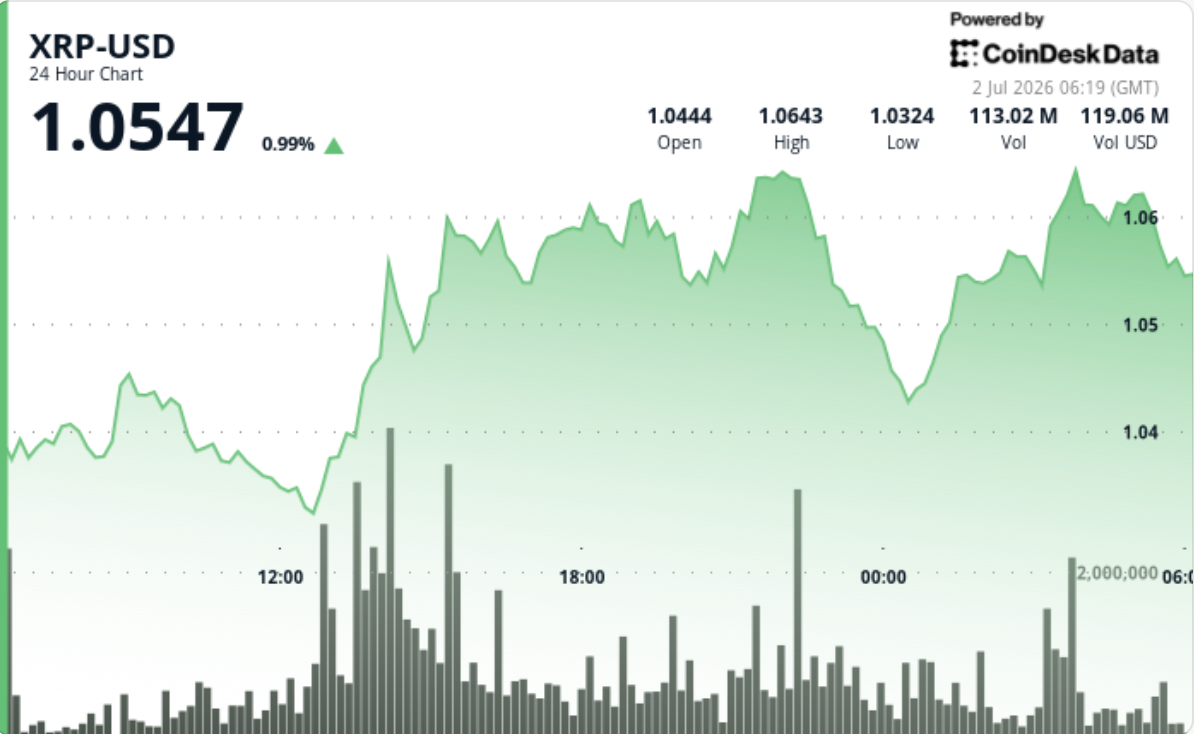
XRP is showing signs of accumulation near the $1.00 level, but the price chart has yet to confirm a full reversal. The token posted a modest gain after a sharp intraday volume spike, while on-chain data revealed the strongest daily new wallet creation in three months and a widening gap between whale and retail positioning. The key question is whether buyers can defend recent support and push the price back above $1.10.
On-Chain Data: 4,941 New Wallets in One Day, Whale-Retail Spread at 50.9%
The XRP Ledger recorded 4,941 new wallet creations in a single day, the highest daily growth in over three months. CryptoQuant data showed the all-CEX whale vs. retail spread at 50.9%, with Binance's measure at 44.6%, indicating stronger activity from large holders while retail participation remained subdued. Meanwhile, XRP spot ETFs saw $15.34 million in net inflows on June 29, with Bitwise accounting for $11.94 million. June inflows exceeded $62 million, bringing cumulative net flows to approximately $1.48 billion.
Price Action: Modest 1.41% Gain Underperforms Broader Market
XRP rose 1.41% to $1.0613 during the 24-hour session ending July 2 at 04:16 UTC, lagging the broader crypto market by 1.27 percentage points. The breakout occurred at 03:27 UTC, when XRP pushed above $1.0560 on volume of 5.34 million — a 1,433% jump from the prior hourly average. Buying continued through the 03:27–03:53 window, with total volume of 11.31 million, pushing the price to a session high near $1.0665. However, 24-hour volume was only 5.95% above the seven-day average, suggesting the move lacks broad momentum for a full trend shift.
Technical Structure: Higher Lows but Below Key Moving Averages
XRP continues to build higher lows above the $1.00 support zone, with the latest base formed at $1.0318 and $1.0410. The breakout above $1.0560 improved the short-term structure, but follow-through above $1.0665 is needed to avoid another range-bound bounce. The token remains below major moving averages: the 20-day EMA near $1.11, 50-day near $1.20, 100-day near $1.31, and 200-day near $1.52. While RSI has recovered from oversold territory to 33, the Chaikin Money Flow remains negative, indicating buyers have not yet regained full control.
Key Levels for Traders
Bulls need to defend the $1.0560–$1.0590 breakout zone. The first resistance is $1.0665; a clean break above this level could open the path toward higher resistance targets.