

XRP spent another session near the bottom of the major-crypto pack as the market waited for fresh direction from Washington. In a market that has been largely flat and choppy for weeks, XRP has continued to lag, rising less when other tokens move higher and dropping harder when prices turn lower.

The token’s weak relative performance is tied in the article to the lack of progress on the Digital Assets Market Clarity Act. If enacted, the bill would establish the first formal legal framework for crypto assets in the United States. That matters especially for XRP, which the article says would be formally classified as a digital commodity under the legislation, removing the regulatory ambiguity that has weighed on institutional demand for years.
The Senate failed to hold a vote before the August recess, knocking down the already limited expectation that the bill could pass this year. Even so, Majority Leader John Thune filed cloture on the legislation late last week before lawmakers left town, which set a procedural vote for September 15.
The bill still needs 60 votes to get past a filibuster. With Democrats still holding out, analysts described its 2026 chances as a long shot. That is a sharp contrast with the mood in late July, when reports that President Donald Trump would accept the bill’s stalled ethics provision pushed Polymarket odds of passage from 32% to 43% and helped trigger a wider crypto rally.
The latest price action shows that enthusiasm has cooled. Among the top 10 cryptocurrencies by market capitalization, XRP posted the worst seven-day performance at -4.96%. Solana gained 3.64% over the same stretch, while Bitcoin rose 1.17%. XRP was also down 1.24% on the day against a market that was mostly flat. The article’s read is that the market is unwinding the so-called Clarity trade in XRP.
XRP price: what the chart is showing
According to the data cited in the article, XRP was trading at $1.0282 with a market capitalization of around $64 billion. It was down 0.17% on the day and remained the weakest top-10 token over the past week. Price was sitting just above the $1.0128 swing low, while the broader setup still carried a death cross, a bearish signal many traders track closely.
The broader trajectory is central to the bearish case. On the daily chart, XRP has been printing lower highs and lower lows for weeks, sliding from the late-June area near $1.3 to current levels.
The July 21 jump tied to Clarity Act expectations briefly reached $1.15, but the move failed and quickly rolled over. The article says that rebound now looks more like a classic bull trap than the start of a trend reversal. Rather than building a base, XRP has been drifting just above the $1.0128 floor, and in a market with so little direction, that compression can last longer than many traders expect.
The 50-day exponential moving average, or EMA50, remains below the 200-day EMA, forming what traders call a death cross. Exponential moving averages smooth prices across a set period. When the shorter-term average stays below the longer-term average, the medium-term trend is usually read as still pointing down.
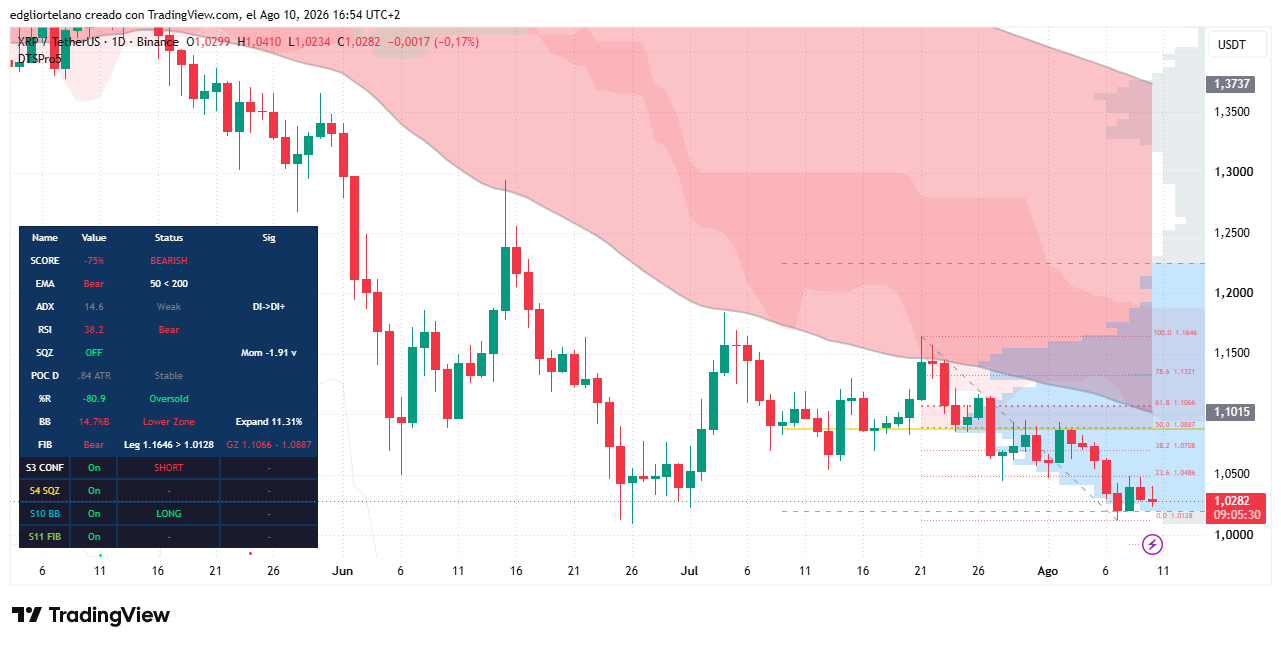
To change that structure, bulls would need a daily close back above the EMA cloud. The article says XRP would need to rally by at least a little more than 8% to get there.
The Relative Strength Index, or RSI, stands at 38.2. RSI is a momentum gauge on a 0 to 100 scale. Readings above 70 are commonly treated as overbought, while readings below 30 are treated as oversold. At 38.2, XRP is below the neutral 50 line and tilted bearish, but it has not yet reached the kind of oversold level that often draws bargain hunters.
The Squeeze Momentum Indicator is off, which the article interprets as a sign that the bearish trend still has some structure behind it. With the squeeze inactive and momentum negative, the setup does not show the sort of volatility compression that would typically precede an upward release in price.
The Average Directional Index, or ADX, is at 14.6. ADX measures trend strength regardless of direction. Readings below 20 usually point to a directionless and choppy market, where false breakouts and stop hunts are more common. A reading of 14.6 suggests there is little conviction behind the trend itself, though the directional indicators remain tilted bearish, with DI- above DI+, matching the death-cross setup rather than contradicting it.
Levels the market is watching
On the bullish side, the article says a daily close back above Fibonacci resistance at $1.0486 would be the first sign that buyers are stepping in again. That could open a move toward the EMA cloud and then the so-called golden zone at $1.0887 to $1.1066. The article adds that this scenario would require the Clarity Act narrative to pick up speed again rather than simply linger.
On the bearish side, a break below the $1.0128 swing low, followed by a loss of the round $1.00 level, could open a measured move toward the lower $0.90s. The death cross and negative Squeeze momentum are both pointing in the same direction. For now, the article says, the path of least resistance does not appear to be higher.
The piece concludes that a bullish case still exists, but only narrowly. It describes XRP as a proxy for Clarity Act expectations, trading as though the bill’s odds had dropped to 21%, with the chart structure supporting that reading.
The article also notes that the author’s views are provided for informational purposes only and do not constitute financial, investment, or other advice.