
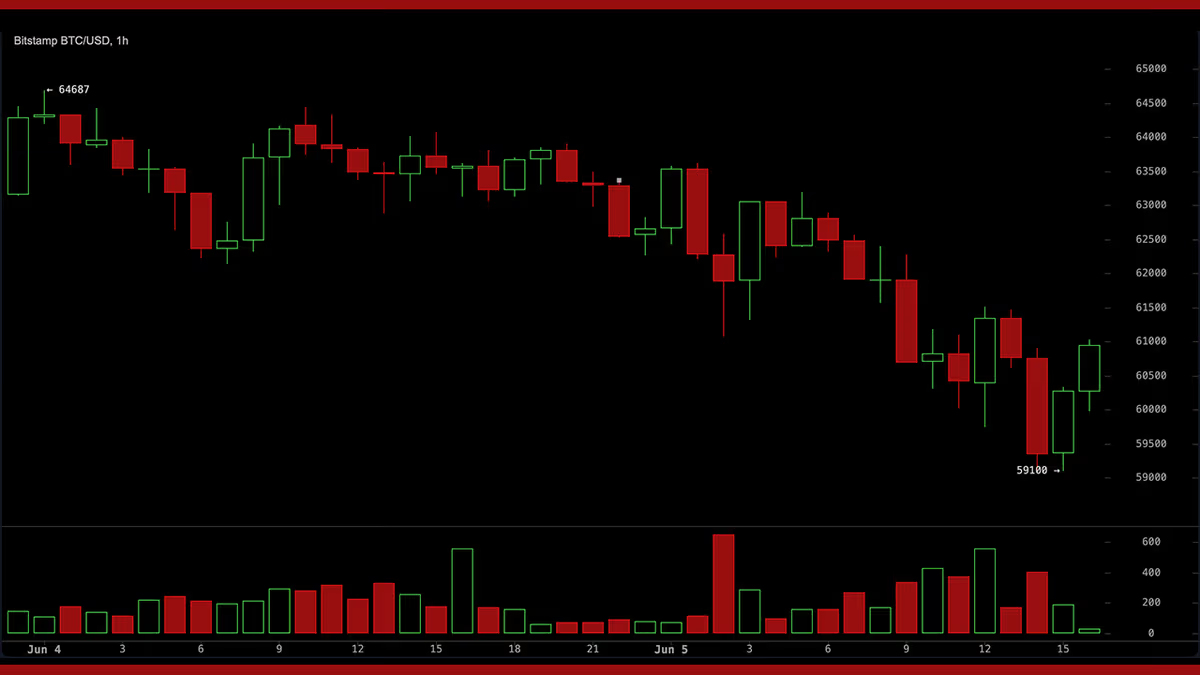
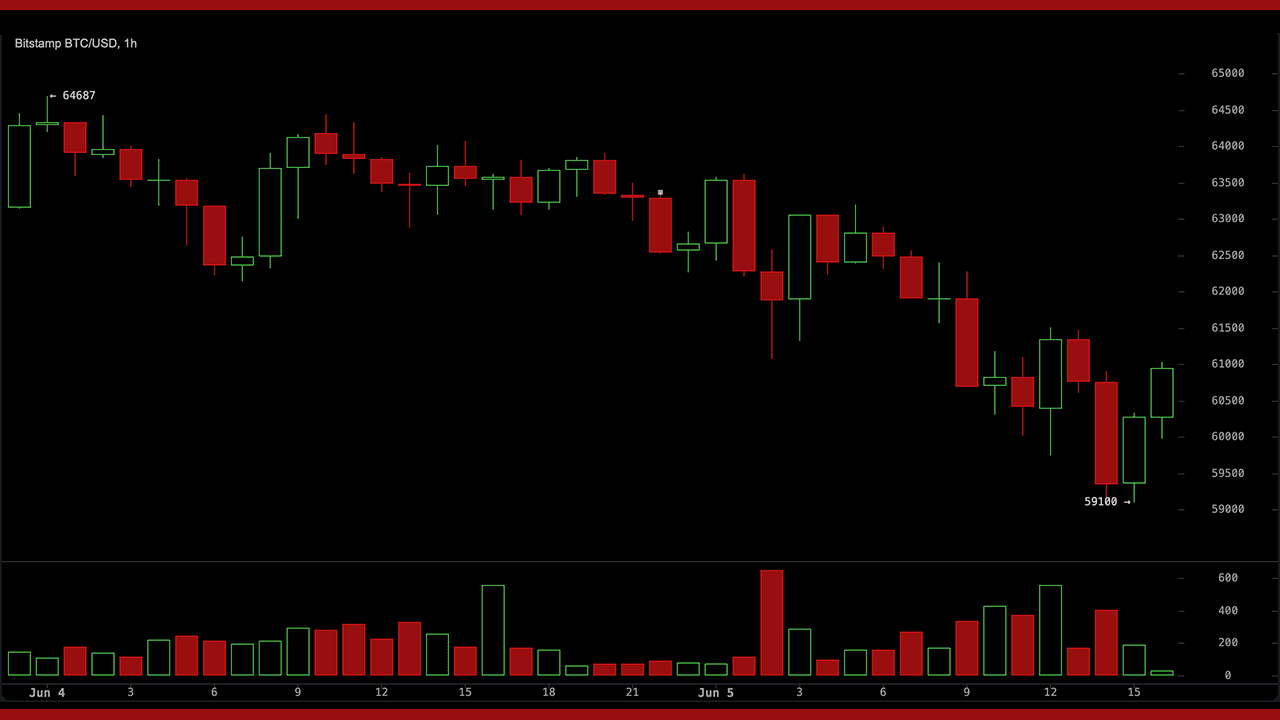
On Friday, Bitcoin fell to its lowest point of 2026, reaching as high as $59,100 intraday, with over 351,000 traders forced to close positions in the cryptocurrency market within 24 hours.
 Listen to the articleAdd us on Google
Share

Key Takeaways
- Key points:
- On June 5, Bitcoin hit a 2026 low of $59,100 intraday, dropping 19.3% in 7 days and 26.8% in 30 days.
- Coinglass data shows that liquidations amounted to $1.75 billion in the past 24 hours, with 351,233 traders in the cryptocurrency market experiencing liquidations.
- Currently, more than half of Bitcoin is in floating losses, signaling the bottom of every major bear market in Bitcoin's history.
Bitcoin plunged 19% over 7 days, reaching $59,100
This round of declines continues the previous heavy sell-off, causing Bitcoin to fall 19.3% in seven days, 22.2% in the past two weeks, and 26.8% in the past month. Over the past year, prices have dropped by 42.3%. The current trading range of $59,000 to $60,000 has pushed Bitcoin's price well below the $71,000 level seen just four days ago (June 1).
A wave of liquidations swept through the market
Coinglass's liquidation data shows that in the past 24 hours, the total cryptocurrency liquidations reached $1.75 billion, with long positions accounting for $1.45 billion. Bitcoin alone saw $560.72 million in liquidations (including $448 million in long positions), followed by Ethereum with $473.02 million (including $408 million in long positions). The largest single liquidation order came from a BTCUSDT position on Binance exchange, valued at $13.31 million. As of 4 p.m. Eastern Time, total closed positions in the past four hours reached $411.68 million, with long positions accounting for $329.21 million.
Ad
Excessive leverage in the perpetual contract market exposes traders to significant risk when prices break below key support levels. The subsequent chain reaction is a common pattern in cryptocurrency market pullbacks: stop-loss orders triggered, prices fall further, and more stop-loss orders are triggered.
ETF capital outflows and strategy sell-offs
Institutional selling pressure is the main driving factor. From late May to early June, for 10 to 11 consecutive trading days, U.S. spot Bitcoin exchange-traded funds (ETFs) estimated net redemptions of $2.8 to $3.5 billion, with about $3.4 billion in just one week, setting the record for the largest single-week redemption since ETF products launched in early 2024. IBIT, owned by BlackRock, is one of the products experiencing large-scale redemptions. Another psychological blow came from Strategy (formerly Microstrategy). In a filing filed with the U.S. Securities and Exchange Commission (SEC) on June 1, the company disclosed that it sold 32 Bitcoins at an average price of about $77,135 per coin between May 26 and 31, cashing out approximately $2.5 million. This sale marks the company's first net Bitcoin reduction since 2022, with proceeds used to pay dividends on its STRC perpetual preferred shares. Strategy currently still holds over 843,700 Bitcoins, with an average cost of about $75,699.
The economic impact of 32 Bitcoins is minimal, but their impact on market narratives should not be underestimated. Strategy's brand image is largely built on a "no selling" commitment, and this filing has completely shattered that image in the eyes of some market participants. This was followed by a wave of retail sell-offs. Many believe that since the "iceberg" has been broken, there may be more sell-offs following up.
The 200-week moving average has been breached
Bitcoin's price has now fallen below the 200-week moving average, marking the first time since June 2022—exactly four years ago. Historically, this level has served as a long-term support and marks a cyclical low.
On-chain data shows that more than half of the Bitcoin currently in circulation is in floating losses. This data aligns with the bottoms of every major bear market in Bitcoin's history. Whether this signals the formation of a bottom or marks the beginning of a deeper decline will depend on subsequent capital inflows, macroeconomic conditions, and price movements at current support levels.
Social media account and Cryptoquant contributor Darkfrost posted on X that although the market correction is still deepening, Bitcoin trading volume is approaching an all-time high based on the 30-day moving average, calling it one of the "most significant" capital flows in Bitcoin's history.
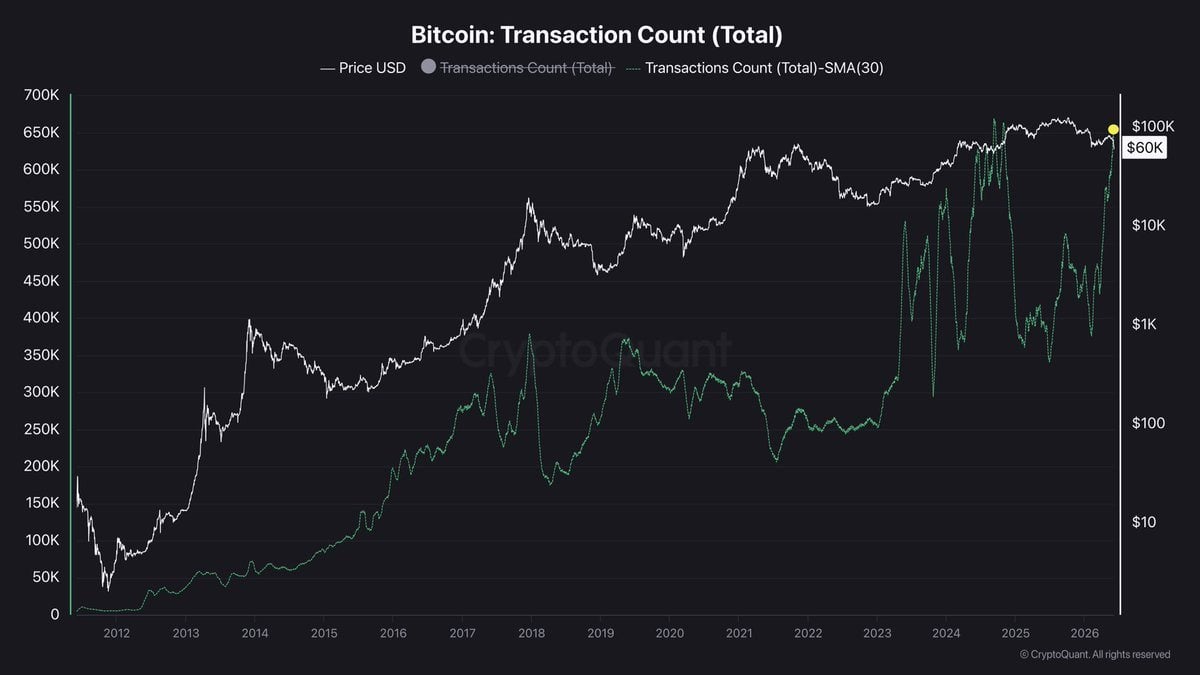
Chart shared by the X account Darkfrost. Image source: Cryptoquant.com.
The average monthly transaction volume has reached about 640,000 transactions, a level that has only occurred once—during the pullback in September 2024, when the volume was 666,000. Darkfrost pointed out that this timing is quite unusual: in past market cycles, volume increases usually coincide with bull market phases or market tops, rather than during accelerated declines. Given that Bitcoin's price had dropped about 19% in June, Darkfrost viewed the current trading activity as a capitulation rather than a bullish signal, writing:
"This is more like a capitulation sell-off and a major portfolio rotation."
Panic dominated the market
In the first week of June, the Crypto Fear and Greed Index fell between 11 and 15, deeply in the "extreme fear" zone. As of today, alternative.me platform shows the index currently reading at 12. Comments on social media mainly focused on the sell-off, criticism of leveraged positions, and doubts about the credibility of MSTR's strategy. According to Google Trends data, the global search term "Bitcoin" peaked at 100 in search heat over the past week.
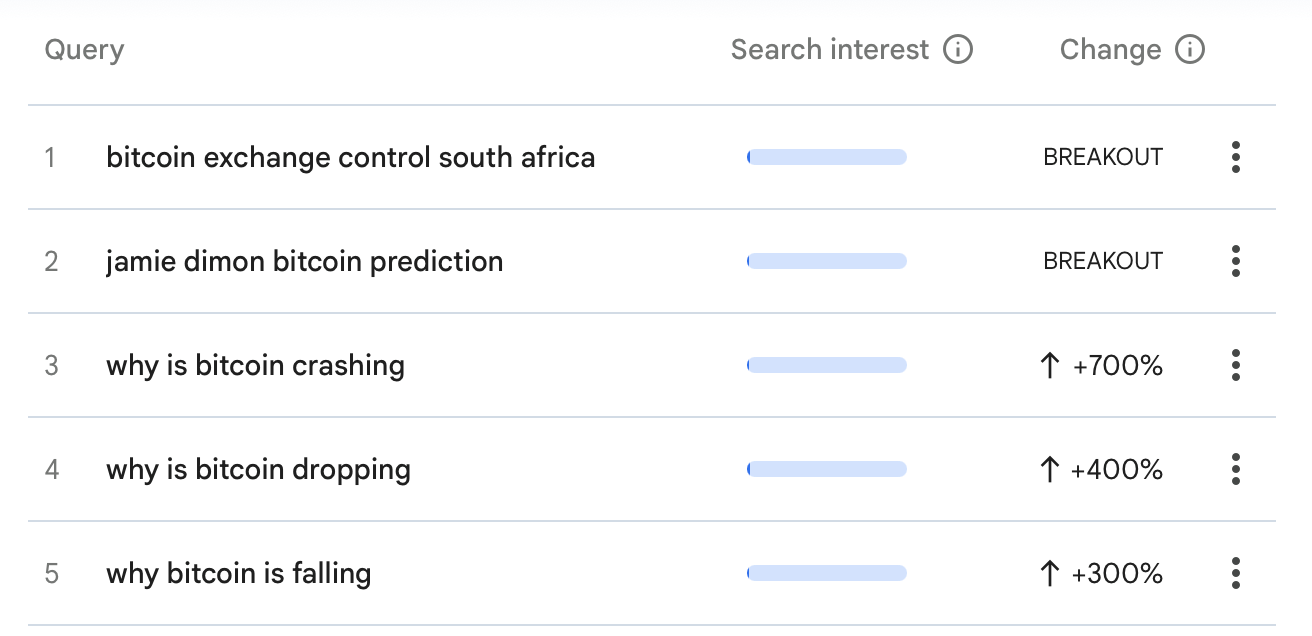
According to global Google Trends statistics as of June 5, 2026, the top five search queries related to "Bitcoin" over the past week are as follows.
This data indicates a significant rise in public curiosity. The underlying data helps explain this phenomenon, as related searches overwhelmingly focus on price movements. Popular search trends related to the term "Bitcoin" include "Why Bitcoin Crashes," "Why Bitcoin Falls," and "Why Bitcoin Falls."
Macroeconomic background
The macro environment has also shown no signs of improvement. Escalating geopolitical tensions between the U.S. and Iran have pushed up oil prices, heightened inflation concerns, and posed further challenges to the Federal Reserve's interest rate policy. Market expectations for rate cuts have been postponed, and some Federal Reserve officials have not ruled out further rate hikes. This environment has put widespread pressure on risk assets, and Bitcoin has not been spared.
AI rotation may be drawing funds out of the Bitcoin market
The rotation of funds into artificial intelligence (AI) stocks has brought additional selling pressure to the market. Institutions and speculative investors are shifting venture capital from Bitcoin to AI-related stocks, semiconductor stocks, and data center infrastructure sectors—sectors that see short-term earnings growth and clearer catalysts making the opportunity cost of holding BTC seem too high.
Ad
Many observers have directly pointed out this trend, noting that investors prefer AI stocks and upcoming tech companies over cryptocurrencies, and warned that Bitcoin's market could be volatile this summer. Strategy Chairman Michael Saylor discussed this shift in a post on the X platform on June 4. He wrote that the capital market provided about $400 billion in funding for AI development over six months, while about $4 billion has flowed out of Bitcoin ETFs since May 14, reflecting capital rotation rather than damage to Bitcoin's fundamentals.
Thaler sees this fluctuation as an opportunity. Many long-term holders share the same view, noting that in past cycles, once the AI boom cools down or the macro environment improves, capital tends to flow back into Bitcoin.
Analysts are focusing on this
Analysts point to $60,000 as a key support level. If the price continues to break below this level, it will open a channel to test the $58,000 price level. Some people point out that liquidity is concentrated around $53,000, and if the selling continues, this price level could become a magnet for funds; If it falls to this area, it could even form a lower shadow below $50,000.
On the other hand, oversold Relative Strength Index (RSI) readings on the daily chart—historically rare in the 17 to 18 range—have often signaled strong rebounds in past cycles. A reversal of ETF capital flows, any easing of geopolitical tensions, or a clearer Federal Reserve policy could all act as catalysts for a technical rebound.
Despite the recent wave of redemptions, ETFs have maintained considerable cumulative inflows. Long-term holders have yet to experience widespread sell-offs. These figures support a cautious attitude rather than certainty about the direction of the trend. As of 4:30 PM Eastern Time on Friday, Bitcoin's price had risen 1% in the past hour and remained at $61,120 per coin. Before that, everyone was holding their breath.