

Aave’s main Ethereum USDC market has been showing a repeat pattern since May: utilization jumps around midnight UTC as roughly $190 million in USDC is withdrawn at about 23:30 UTC and deposited back within roughly half an hour to an hour. Based on the estimates in the source article, that routine adds about $6 million a year in extra interest costs for borrowers across the pool.
The piece was written by Cooper Duschang and translated by TechFlow. Its central argument is that the on-chain pattern is better explained by an institution temporarily pulling assets out of DeFi to record a proof-of-holdings snapshot than by governance changes or a sudden shift in borrowing demand.
Midnight utilization spikes began appearing in May
Aave uses a two-slope interest rate model built around a target utilization level. When utilization stays below the target, borrowing costs rise gradually. Once utilization moves above that threshold, the curve turns sharply higher. Utilization is calculated as total borrows divided by total deposits, so the more of a market is borrowed out, the closer utilization gets to 100%.
In Aave’s main Ethereum USDC market, the target utilization is 92%. Above that level, the borrowing curve steepens sharply: from 92% to 100% utilization, the borrow rate rises from 4% to 14%. That setup is meant to cool borrowing demand or attract additional USDC deposits.
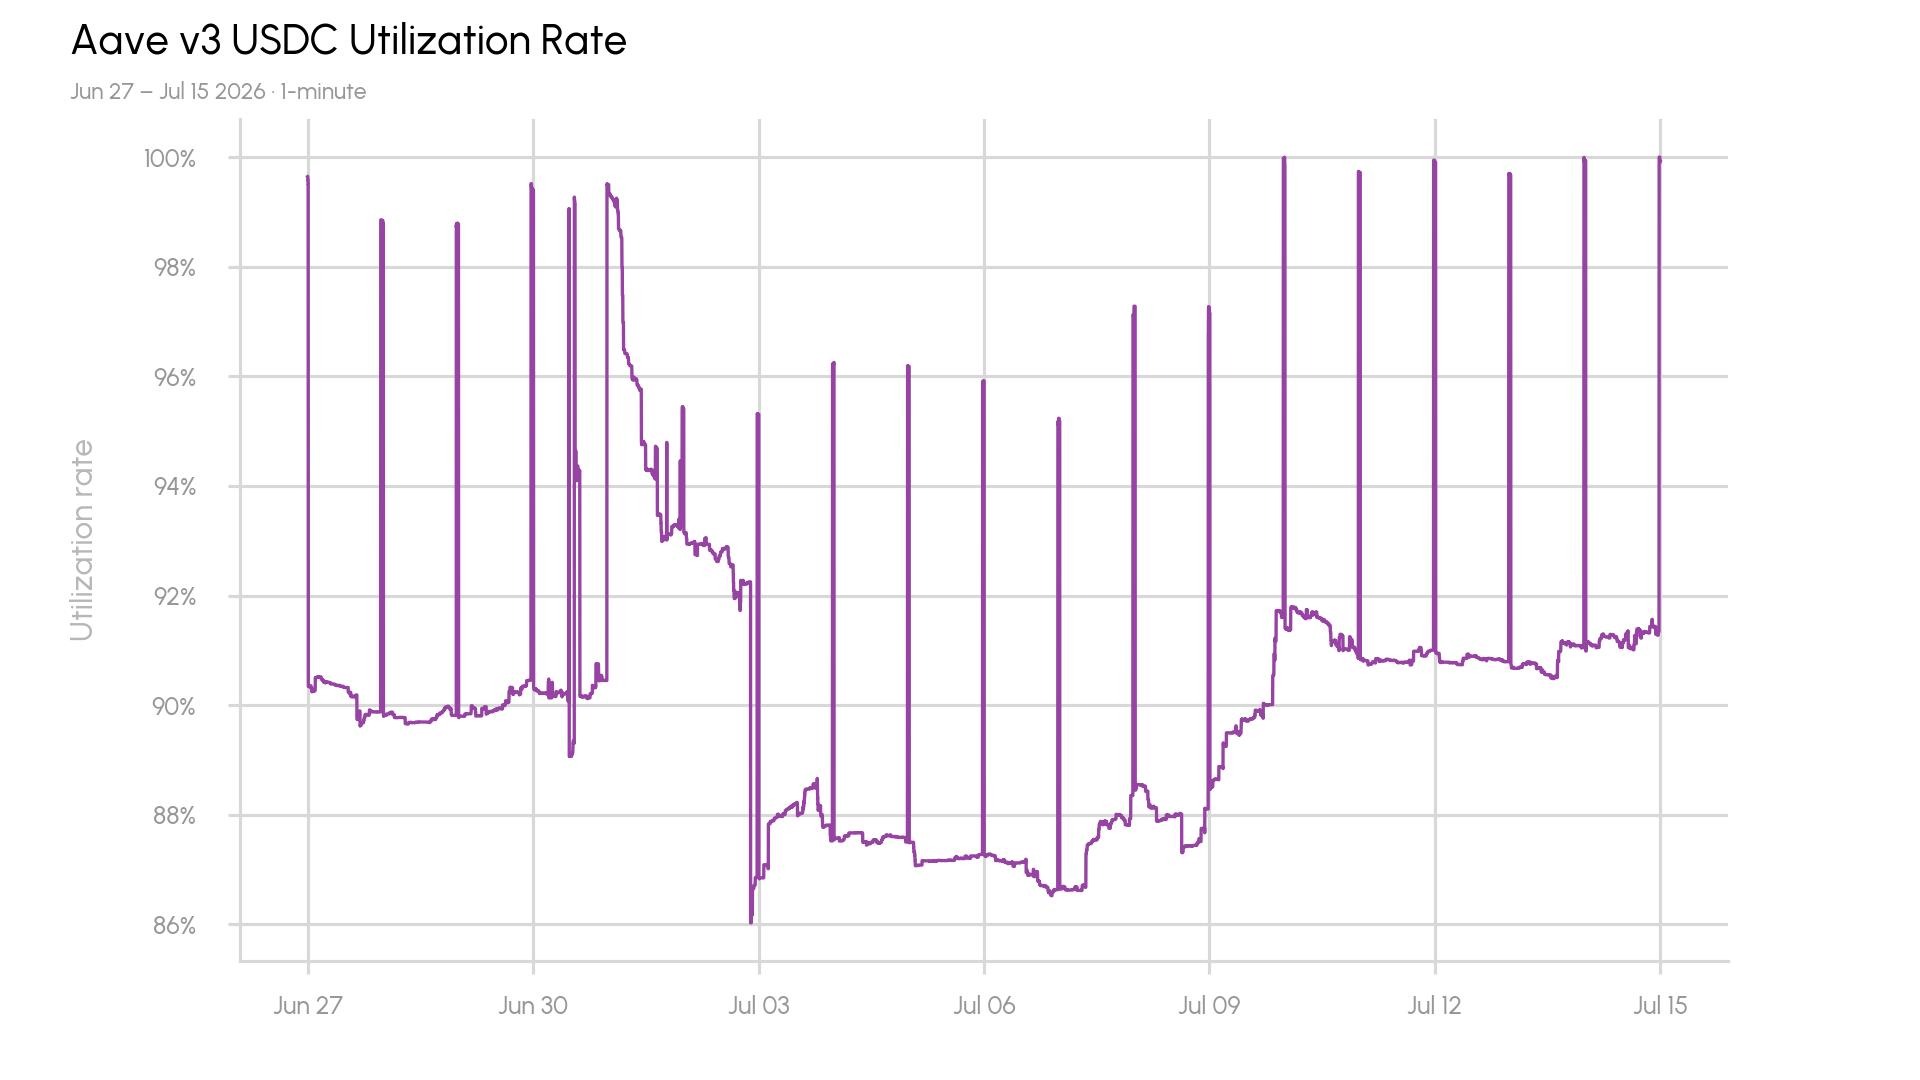
Under normal conditions, utilization in the Aave USDC market hovers around 90%. But minute-level data show recurring spikes around midnight UTC starting in May.
The move comes from deposits leaving the pool
The article says that once governance adjustments and oracle manipulation are ruled out, only two variables can materially change utilization: the amount of USDC deposited and the amount borrowed.
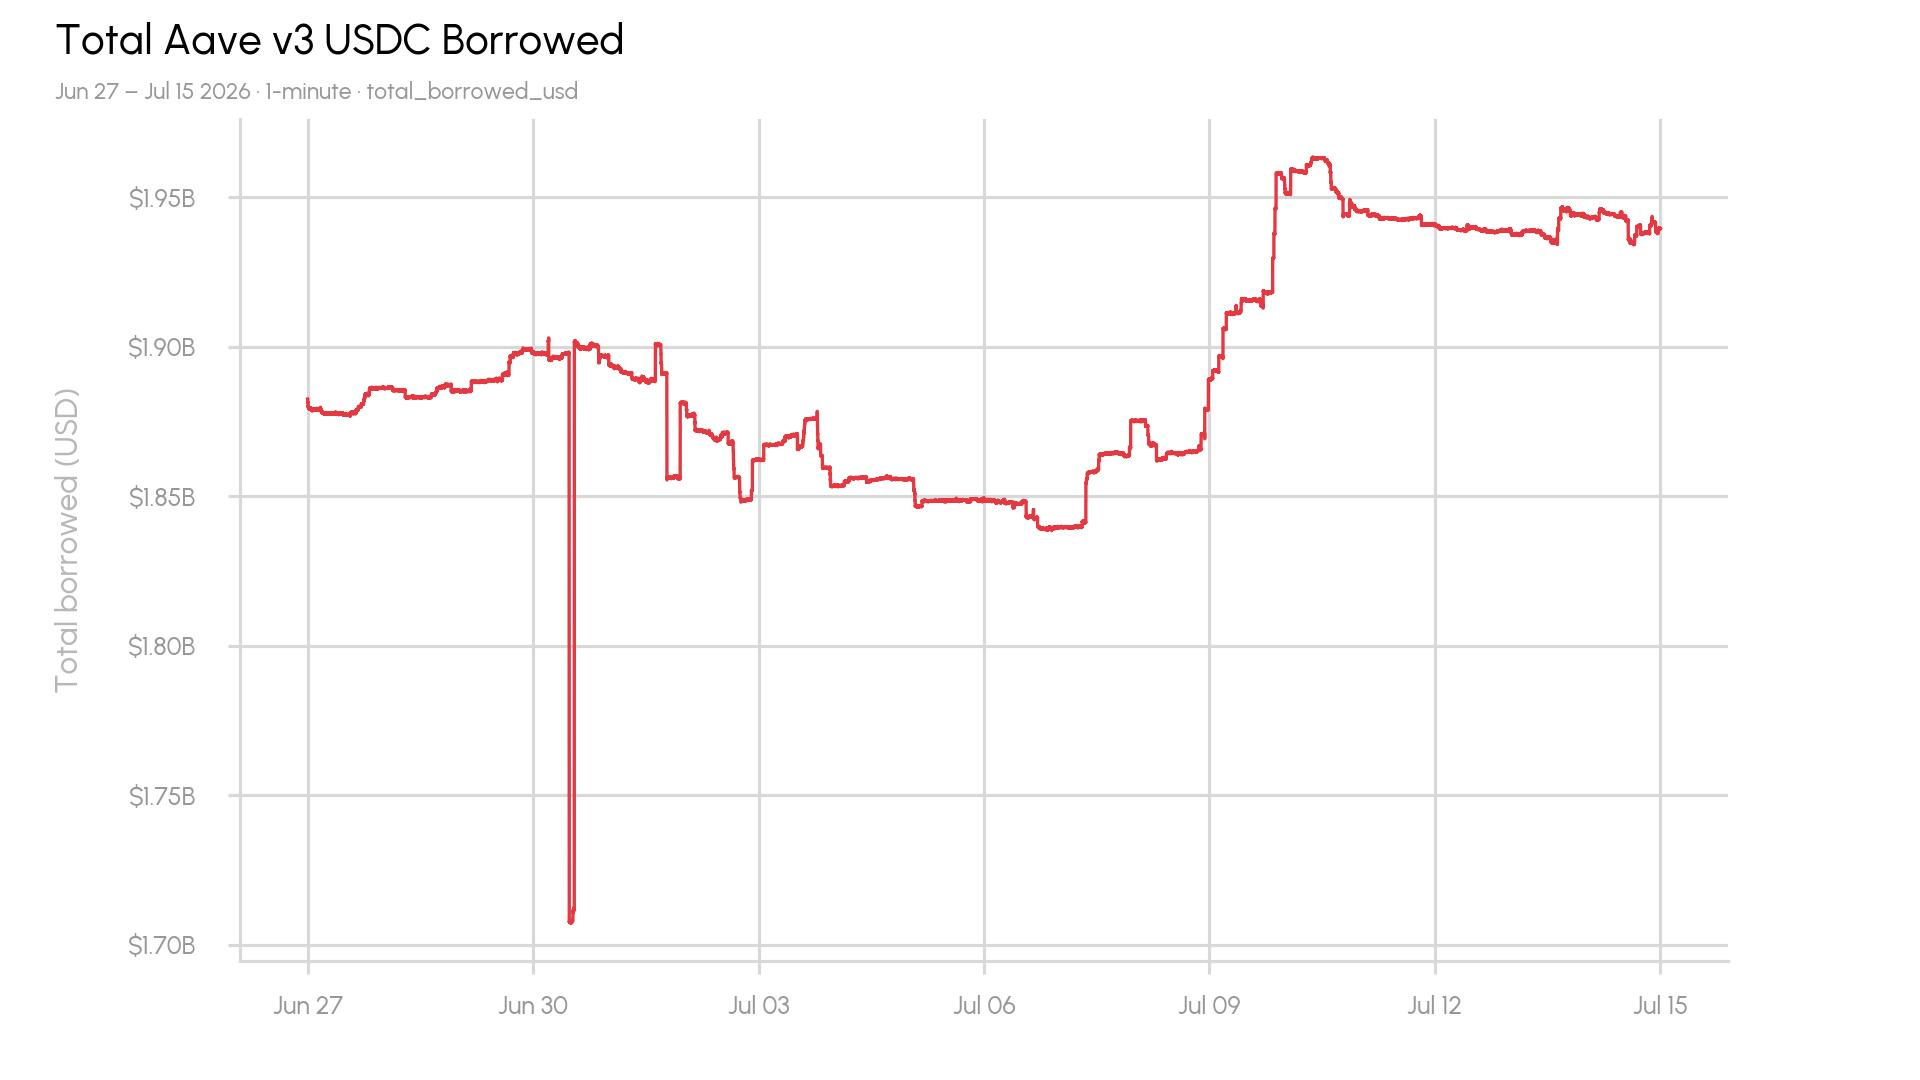
Aside from one brief drop in borrows, total borrowing in the market has averaged $1.89 billion since June 27. If borrowing was not sustaining a sharp rise while utilization was jumping, the cleaner explanation is that deposits were being pulled out of the pool.
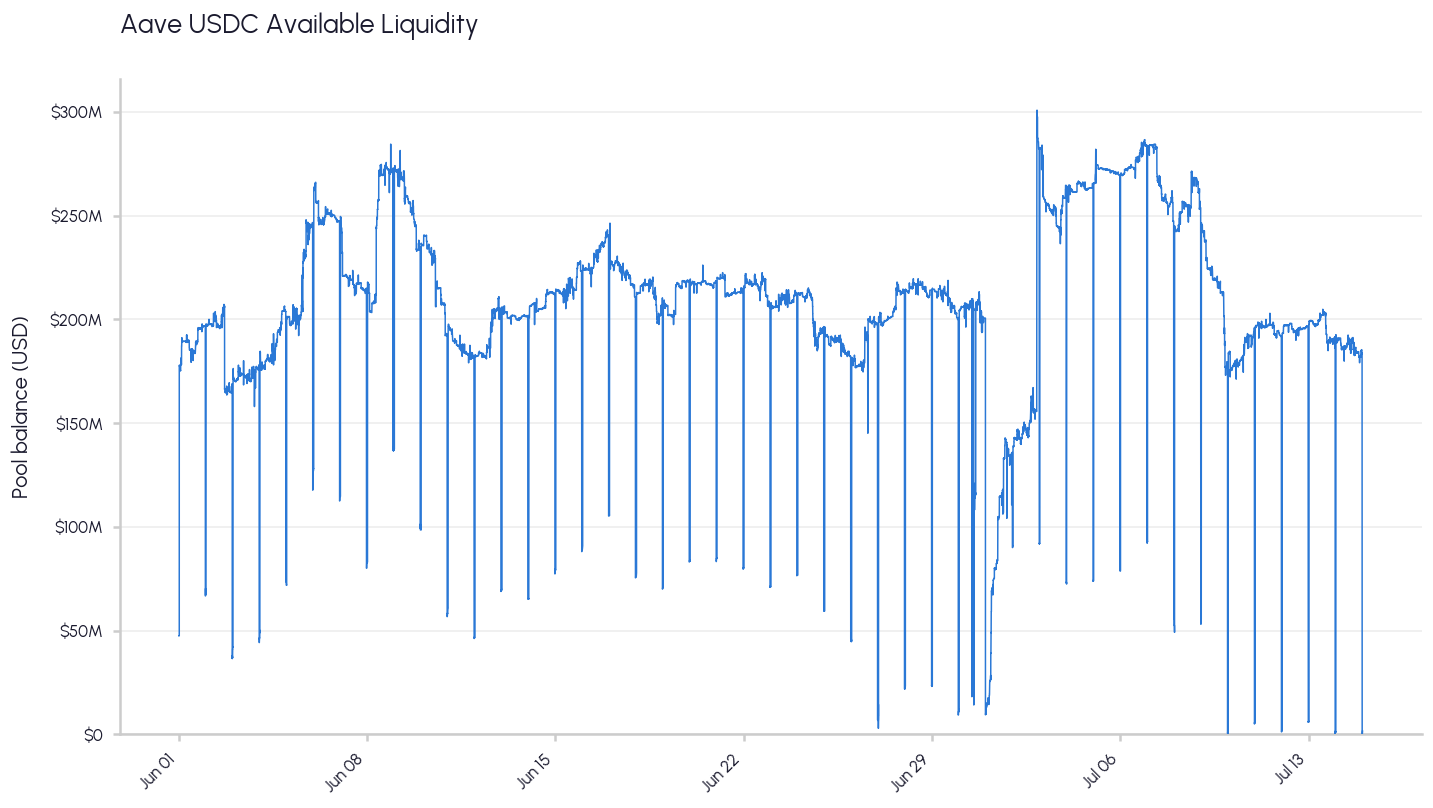
That is what the data show. Between 11:30 UTC and as late as 00:30 UTC, more than $150 million in USDC deposits was withdrawn and later returned. Available liquidity dropped from about $210 million to a low of just $33,000.
The wallets identified in the flow
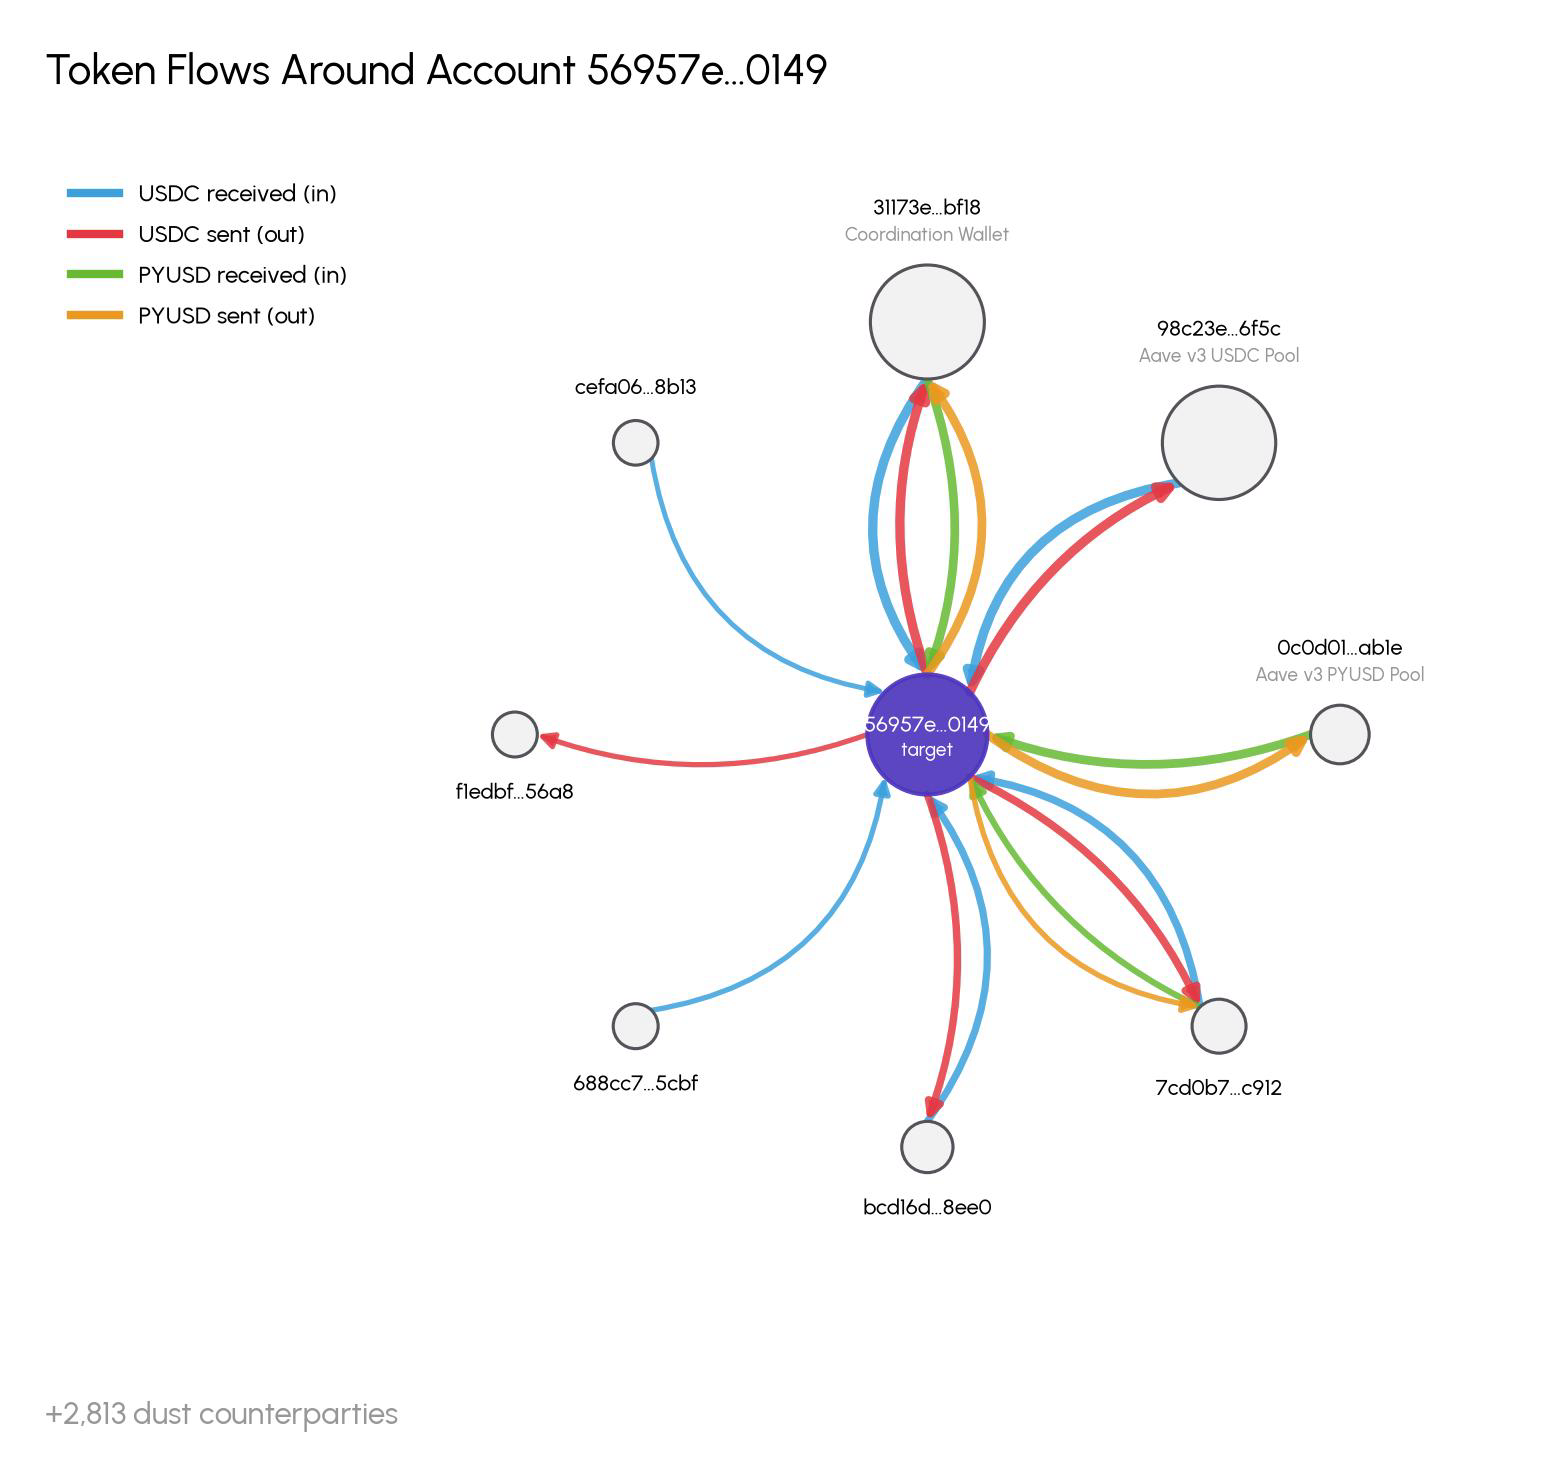
The article traces the nightly $190 million transfers to address 0x56957E411Ea83a0B4A0689C1fB0D1e5eA0d20149. Ethereum’s pseudonymous structure allows balances and transfers to be followed in public, while the user behind an address and the exact motive remain hidden.
That account first received funding on Dec. 5, 2025. Looking at balance changes and fund flows, the report says the same target address carried out similar transactions in Aave’s PYUSD pool in December and January.
The flow described is as follows: the target address receives USDC, deposits it into Aave, withdraws it again at around 23:30 UTC, then sends the funds a few minutes later to 0x31173Ed183e5a9450C3671018ec4d770c8A8bF18. Shortly after 00:00 UTC, the USDC is sent back and redeposited into Aave.
The report describes 0x31173Ed183e5a9450C3671018ec4d770c8A8bF18 as a coordinating wallet. It receives funds from the target address and from another address that earns yield by depositing USDC and holding sUSDS. Those combined funds are then sent each night to a third upstream wallet, 0xf1edbf98dda764ec51de3776371f0f7d6f6156a8.
From that flow pattern, the article says the most likely explanation is that an investor or fund is required to prove its holdings every day, forcing it to remove assets from the DeFi pool long enough to capture a snapshot before putting them back.
The withdrawal window has tightened from June to July
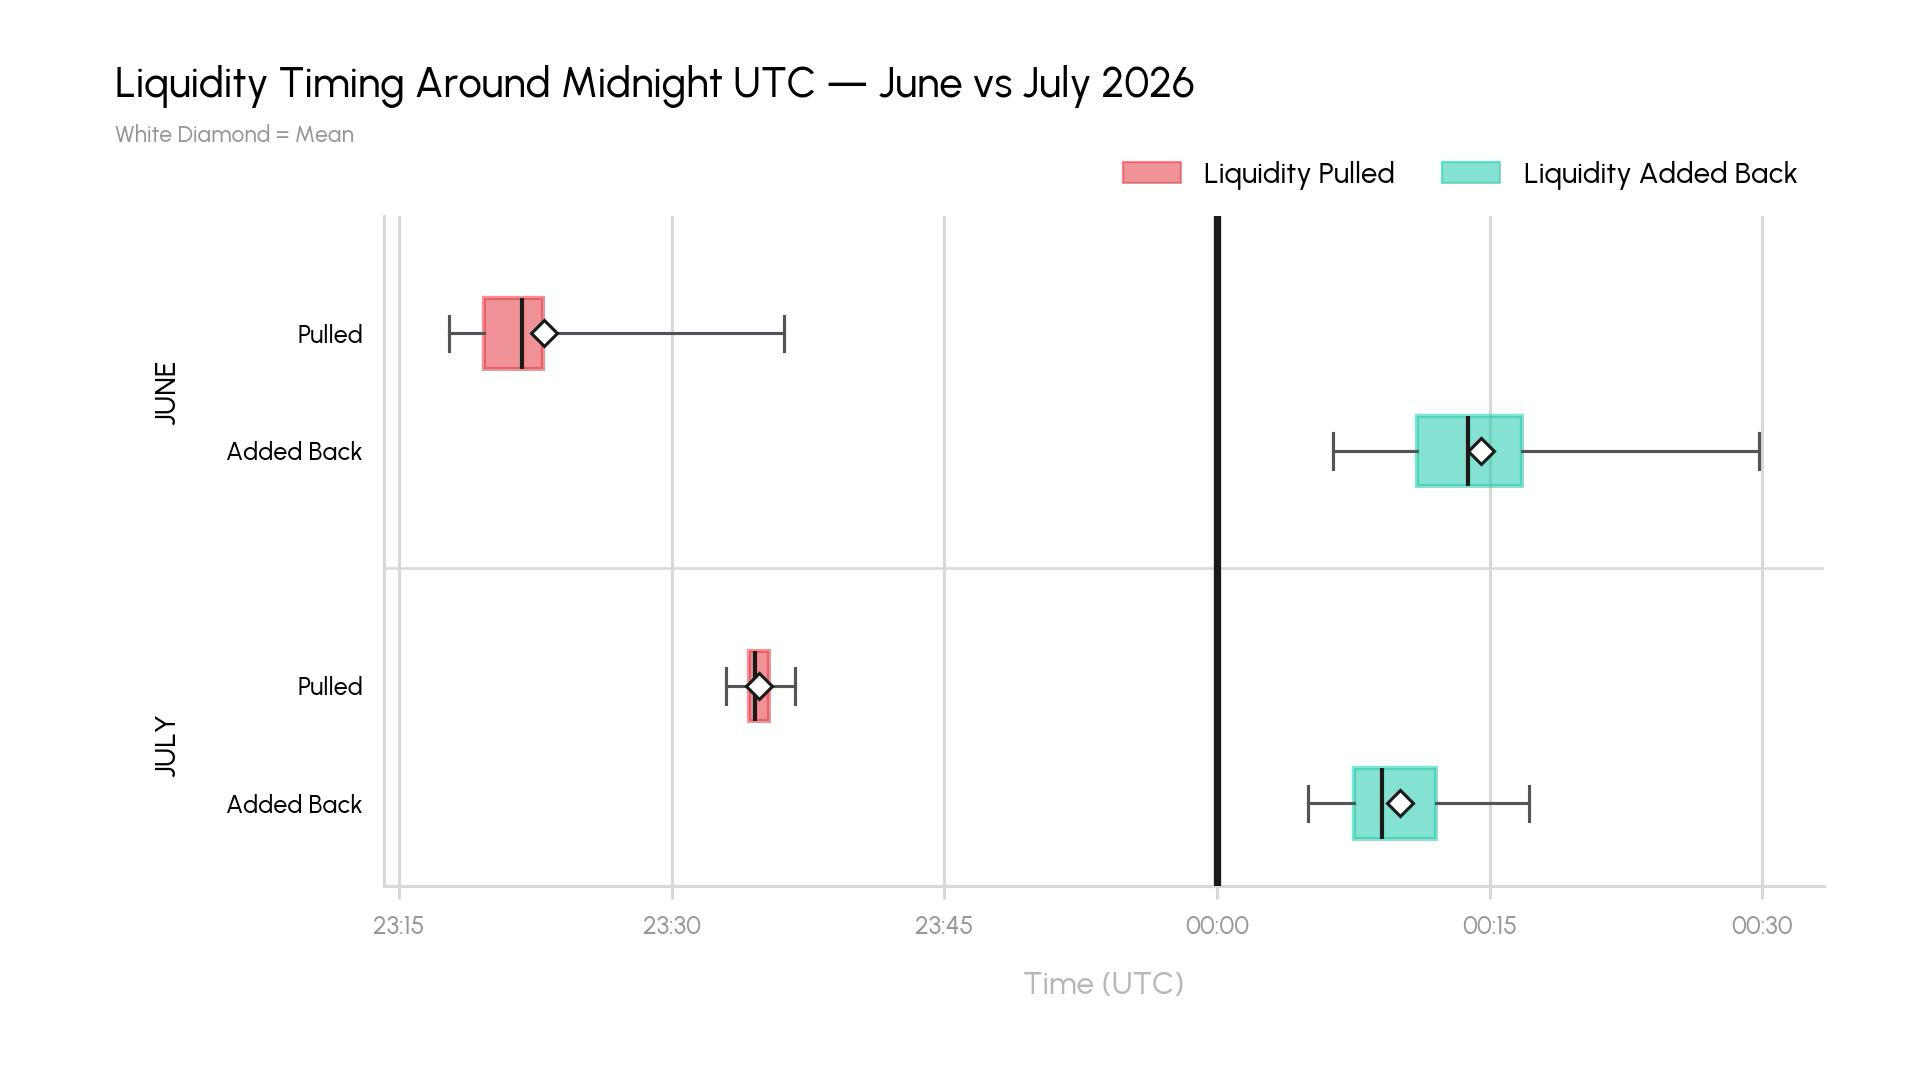
The timing became more compressed from June to July. The average withdrawal time shifted from around 23:20 to 23:34, while the average redeposit time moved from 00:34 to 00:09.
Measured in blocks, the average gap between withdrawal and redeposit narrowed from 259 blocks in June to 177 blocks in July.
Borrowers, not depositors, bear the added cost
When liquidity is removed and utilization spikes, depositors benefit from higher rates. Borrowers do not. Variable borrow costs rise with utilization, which means higher repayment expenses during the affected blocks.
On Aave, interest and yield accrue continuously on a block basis. Ethereum produces a block roughly every 12 seconds, or about five blocks per minute. Using that structure, the article breaks down the annualized variable borrow rate and simulates how a $1 million borrowing position changes minute by minute when liquidity is temporarily removed.
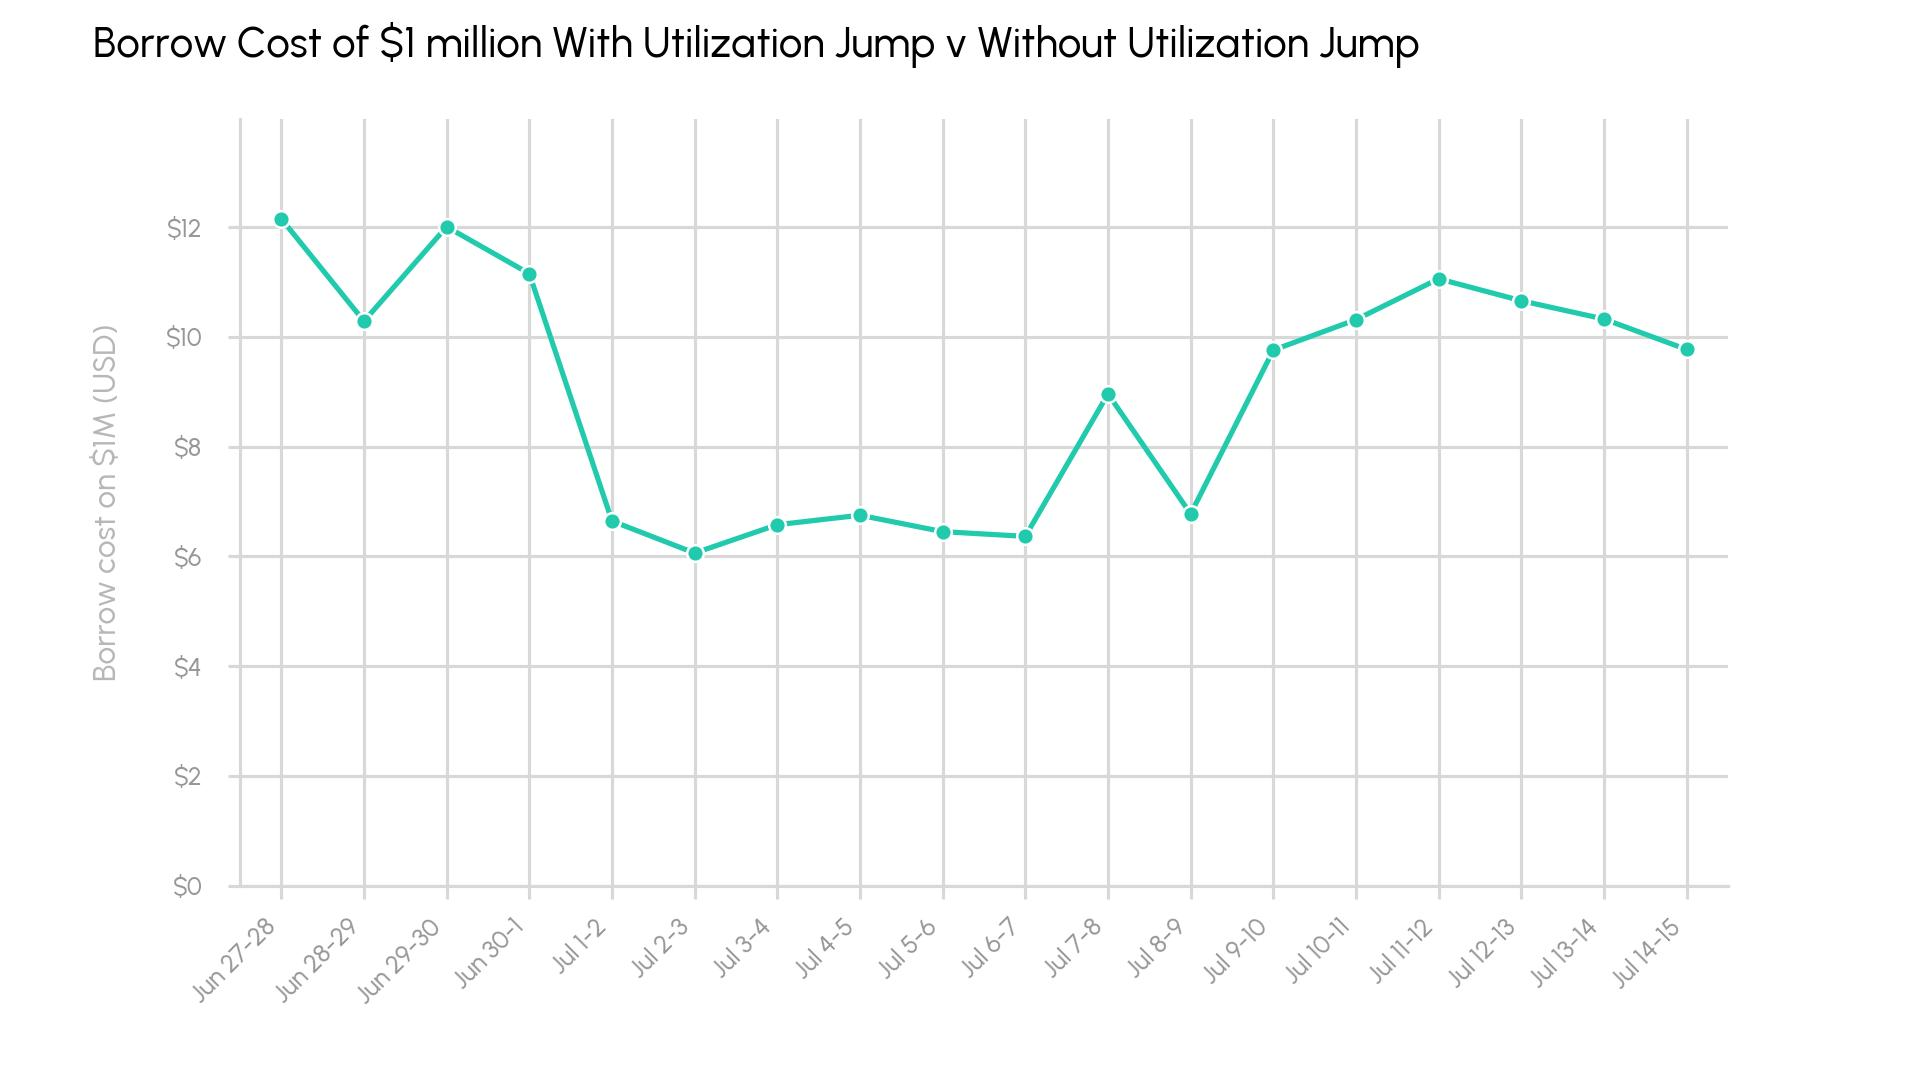
Across an 18-day sample, the borrower on a $1 million position paid about $9 more per day on average during the withdrawal events than in a simulated case where liquidity was not temporarily altered. That works out to roughly $3,280 a year.
Applied to the full $1.89 billion borrowed from the USDC pool, the extra cost reaches about $17,000 per night, or about $6 million a year. The report’s point is straightforward: borrowers are paying for a process unrelated to their own loans.
What the episode says about DeFi transparency
The article argues that the repeated, highly consistent utilization spikes are most consistent with a fund proving its holdings. It adds that better regulatory frameworks and operating procedures for DeFi investing could reduce the damage such routines cause to lending pools.
It also notes that blockchains already make asset movements inside protocols visible. In principle, that transparency should make it possible to verify the existence and control of funds without forcing those assets to be moved to a designated address every day.
For participants in on-chain lending markets, the implication is practical. Lenders and borrowers are no longer watching only their own positions. They also need to monitor the state of the broader pool. Tracing fund flows and interpreting intent can help identify new risks and anticipate changes in liquidity and rates.