


The valuation gap between AI stocks in Hong Kong and the U.S. has been a recurring market theme over the past year. In this Odaily analysis, the gap is framed not as a sentiment story first, but as a function of three things: where profits are retained along the AI value chain, whether capital expenditure is still expanding, and who holds marginal pricing power.
Break those three variables apart, and the setup in each market looks different. U.S. AI names are being judged on whether earnings can keep beating expectations. Hong Kong AI names are being judged on whether discounted valuations can be absorbed by real commercial progress. The article does not offer position advice. It lays out the pricing, earnings and capital-flow signals instead.
Profit pools are not in the same place
Assets grouped under the AI label are not making money in the same part of the chain.
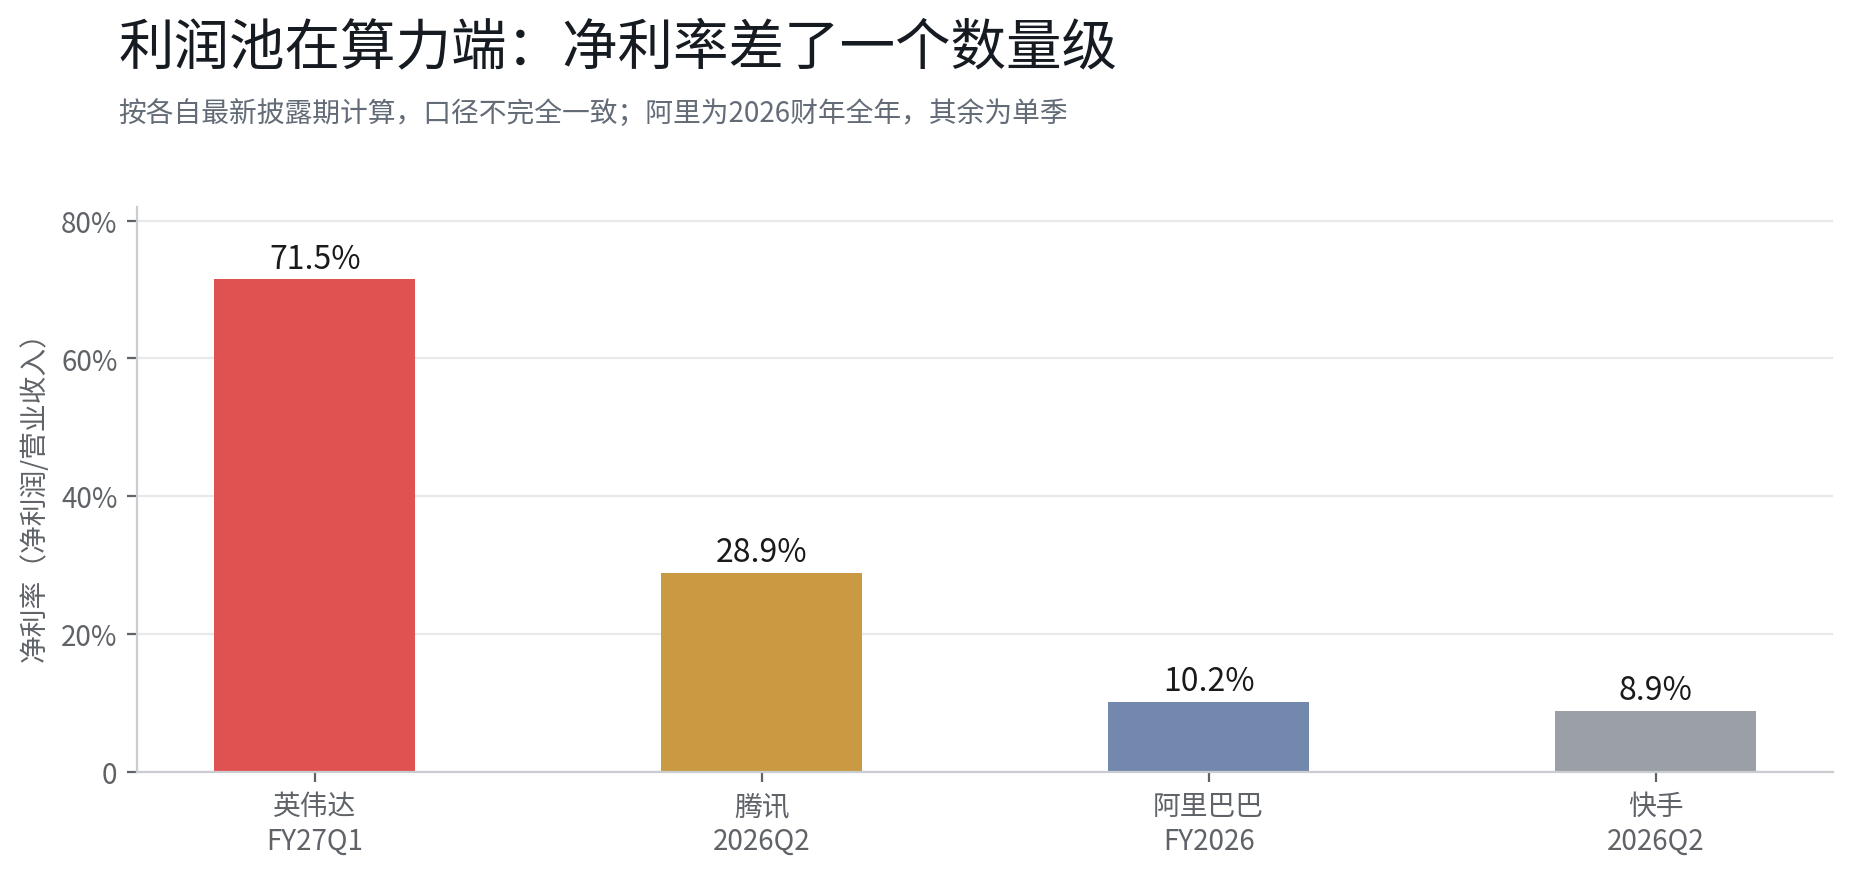
Nvidia reported FY27 Q1 revenue of $81.615 billion and net profit of $58.321 billion, for a net margin of about 71.5%. The article describes that not as a software-style margin profile, but as a direct expression of pricing power during a period of compute scarcity, when chip prices are set by supply and demand and customers have limited substitutes.
Hong Kong-listed platform companies sit in a different position. Tencent posted revenue of RMB 206.561 billion and net profit of RMB 59.801 billion in the second quarter of 2026, implying a net margin of about 28.9%. Its profit base comes from advertising, gaming, fintech and cloud, with AI functioning more as an efficiency tool than as a standalone paid product.
Alibaba reported about RMB 1.02 trillion in revenue and RMB 103.592 billion in net profit for fiscal 2026, for a net margin of about 10.2%. Fulfillment costs in e-commerce and upfront cloud investment keep margins in the low double digits.
Kuaishou posted revenue of RMB 35.384 billion and net profit of RMB 3.133 billion in the second quarter of 2026, for a net margin of about 8.9%. Content costs, bandwidth and AI spending make it difficult to lift margins to the level of larger platform peers in the near term.
That spread explains a large part of the valuation gap. Nvidia trades at about 33x TTM earnings because margins are high, growth is fast and visibility is strong. Hong Kong platform companies trade in the mid-teens because margins are lower and growth is steadier. In the article’s framing, the gap starts with business models before it shows up as market mood.
At the same time, lower margins also imply more room for improvement. If AI can reduce content production costs, improve ad delivery efficiency and lower unit compute costs in cloud, margin expansion would feed directly into valuation. The article argues that this logic is cheaper in Hong Kong because the starting point is lower.
Microsoft’s capex curve matters to both markets
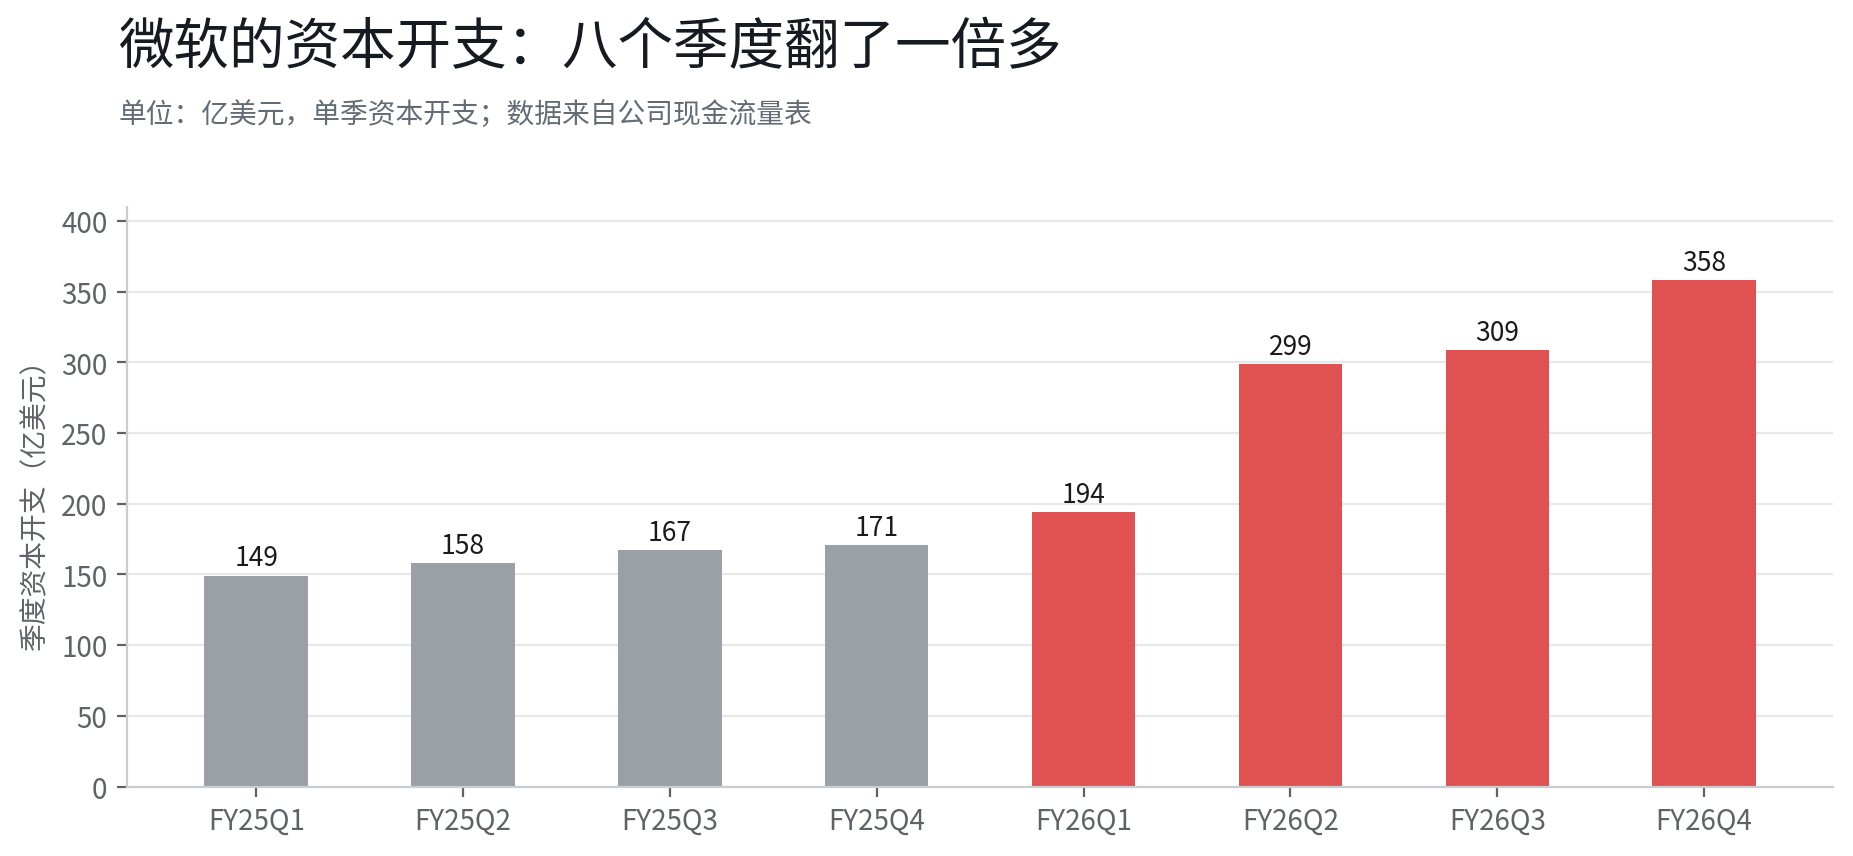
Nvidia’s revenue is the outcome. Hyperscaler capex is the cause. Microsoft’s quarterly capital expenditure rose from $14.9 billion in FY25 Q1 to $35.8 billion in FY26 Q4, more than doubling over eight quarters, with acceleration still visible in the latest two quarters.
That curve matters on both sides of the market. For Nvidia, it means orders. For Hong Kong-listed names such as Semiconductor Manufacturing International Corp. and Hua Hong Semiconductor, it means supporting demand tied to mature-node production. For Alibaba Cloud and Tencent Cloud, it means upfront spending on compute capacity and cost structure. The article says this shows AI compute procurement has moved into annual cloud budgets rather than remaining a one-off pulse.
The risk sits in the same place. If capex growth keeps running ahead of cloud revenue growth, depreciation would hit margins first and valuations after that. The article says investors in U.S. AI stocks should watch not only Nvidia guidance, but also the relative pace of capex and cloud revenue at Microsoft and Meta. If that ratio worsens for two straight quarters, AI-chain valuations could react before earnings do.
Why the Hong Kong discount is hard to close, and why it still matters
Tencent is cited at about 14x 2027 forward earnings, Meta at roughly 20x forward earnings, and Nvidia at about 33x TTM earnings. The article notes that the data sources are different and should not be subtracted directly, but the direction is clear: leading Hong Kong platform companies still sit at the low end of global AI valuations.
It gives three reasons for that discount.
The first is the earnings cycle. U.S. compute companies are posting revenue growth above 80%, while the core businesses of Hong Kong platform companies are mostly growing in the single digits to low teens. Different growth rates produce different valuation systems.
The second is index structure. The Hang Seng Tech Index is dominated by platforms, hardware and internet services, while pure-play AI names are scarce. Buying AI exposure in Hong Kong often means accepting a conglomerate-style discount tied to mixed core businesses.
The third is marginal pricing power. Southbound capital is taking a larger share, but marginal pricing is still influenced by foreign capital and global rates. When risk appetite shifts, the discount tends to widen first. The 10-year U.S. Treasury yield rose as high as 5.36% in early October and returned to around 5.1% in mid-October, a range the article describes as a valuation headwind for Hong Kong growth stocks.
Put together, those three layers help explain the 14x versus 20x gap. The reverse side is elasticity. The same AI progress can produce a larger valuation repair in Hong Kong. Tencent has already deployed large models in its advertising system. Alibaba’s cloud business is accelerating. Kuaishou’s Kling has turned AI video into a sellable product. For now, the article says, those changes are showing up more in revenue mix than in headline multiples.
Southbound flows: short-term selling versus the broader trend
Since July, southbound capital has recorded cumulative net buying of about HK$134 billion as of Oct. 8. During the week of Oct. 12 to Oct. 16, net selling totaled HK$6.637 billion, including HK$5.080 billion of net selling on Oct. 15 alone. On a one-week view, that looks like retreat. On a longer view, the article reads it as digestion after rapid pre-holiday inflows.
The structure of those flows shows a preference shift. Southbound investors were net buyers last week of AIA Group at HK$1.493 billion, Tencent at HK$1.434 billion and Alibaba at HK$734 million. They were net sellers of SMIC at HK$3.024 billion, Yangtze Optical Fibre and Cable at HK$2.451 billion and Xiaomi Group at HK$756 million. Buying platforms and insurance while trimming some hardware manufacturing has been the same direction seen since September, with capital moving toward earnings visibility.
The article treats that as a constructive signal for Hong Kong AI. Southbound pricing power is rising, and its valuation demands are described as less strict than those of foreign investors, with a longer tolerance for industry trends. As long as southbound flows do not turn into two consecutive weeks of large net outflows, the liquidity discount in Hong Kong is unlikely to widen in a systemic way.
Three Hong Kong AI tracks: compute, cloud and applications
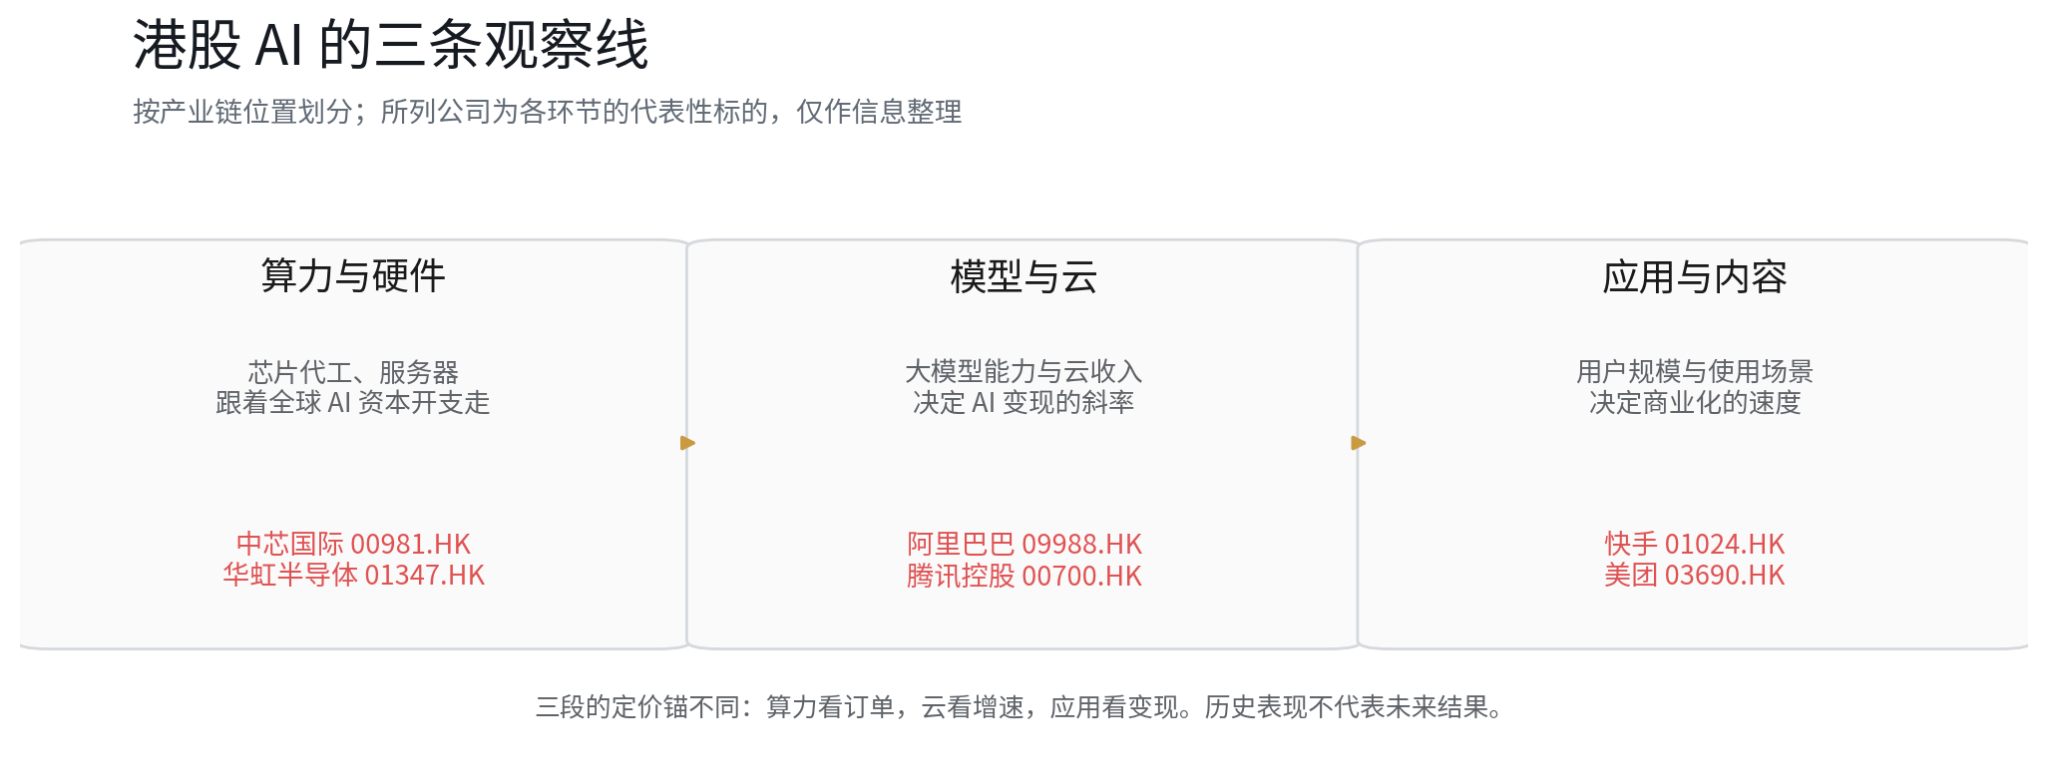
The article breaks Hong Kong AI into three separate lines, each with a different driver.
Compute and hardware. For companies such as SMIC and Hua Hong Semiconductor, the key variables are orders and capacity utilization. If global AI capex keeps rising, demand for mature-node power management and interface chips should rise with it. This line has the most operating leverage, but it is also the most exposed to export controls and cyclical swings.
Models and cloud. For Alibaba and Tencent, the focus is AI-related revenue growth in cloud and the return on capital spending. Cloud is described as the most direct monetization gateway for AI. If enterprise customers are willing to pay for inference, that revenue should show up in reported numbers. This is the line with the highest visibility because it can be checked every quarter.
Applications and content. For companies such as Kuaishou and Meituan, the question is whether AI can improve efficiency or create new revenue. Kling is presented as one of the few cases that has already produced a visible revenue curve: RMB 850 million in second-quarter revenue and ARR close to $500 million. Applications offer the largest upside, but they also take the longest to prove out and need quarter-by-quarter confirmation.
The sequence matters. Compute reacts first, cloud follows, and applications monetize last. The article argues that understanding that order is more useful than trying to decide which market is simply stronger.
Four numbers to watch in the coming earnings cycle
With earnings season approaching in both markets over the next month, the article says investors should focus on four measurable data points rather than broad directional calls.
- Cloud revenue growth. AI-related revenue growth at Alibaba Cloud and Tencent Cloud is the first hard test of whether the Hong Kong AI narrative is translating into business results. Faster growth would support a narrower discount. Slower growth would push valuation repair further out.
- The pace of capex relative to revenue. Microsoft and Meta are still expanding capital expenditure. The key question is whether cloud revenue can keep up. If capex growth exceeds cloud revenue growth for two consecutive quarters, margin pressure would likely appear first.
- AI penetration in advertising and e-commerce. Tencent’s ad load rate and Kuaishou’s AIGC material consumption are cited as direct indicators of whether AI is improving efficiency inside core businesses. These are not the most visible numbers, but they matter for margin defense.
- Kling’s ARR and revenue share. Kling generated RMB 850 million in second-quarter revenue, equal to 2.4% of Kuaishou’s total revenue. If that share keeps rising, the article says the second growth curve is thickening. If it stays around 2%, the asset remains high in valuation but low in consolidated contribution.
The piece sketches three scenarios without presenting them as forecasts. If cloud revenue accelerates and capex stays under control, the Hong Kong discount could narrow. If rates fall and southbound buying continues, valuation repair could have more elasticity. If capex overshoots while revenue fails to catch up, AI assets in both markets may need to digest valuations first. The distinction lies in which indicators to watch, not in a different betting direction.
Cross-market friction and the article’s closing note
The article says the practical frictions in cross-market allocation usually show up in foreign exchange, settlement and time-zone differences. BIT supports allocation to Hong Kong and U.S. equities within the same account, reducing transfers across platforms, while stablecoin deposits and withdrawals can shorten the time funds spend in transit between the two markets. Specific fees, market-data entitlements and arrival times are subject to the platform’s published terms. BIT also supports traditional wire transfers for deposits and withdrawals.
Its closing interpretation is straightforward: U.S. AI is making money from compute scarcity, while Hong Kong AI is making money from traffic and use cases. Those profit pools move at different speeds, so valuations should not be the same. The opportunity in U.S. AI lies in earnings continuing to beat expectations. The key question in Hong Kong is whether AI businesses can gradually turn into actual revenue and narrow the valuation gap with U.S. peers.
On Oct. 20, Hong Kong internet names pulled back, with Alibaba down 3.13%, Tencent down 1.42% and Kuaishou down 2.25%. The article says that changed prices, not the direction of cloud revenue, capex or southbound inflows. If third-quarter results show slower cloud and AI revenue growth, or if southbound capital posts two straight weeks of large net outflows, that view would need to be revised. Historical performance does not represent future results.
Data notes
For U.S. equities, Nvidia reported FY27 Q1 revenue of $81.615 billion and net profit of $58.321 billion. Its closing price on Oct. 19 was $217.09, for a market capitalization of about $5.23 trillion.
For Hong Kong financials, Tencent reported second-quarter 2026 revenue of RMB 206.561 billion and net profit of RMB 59.801 billion. Alibaba reported about RMB 1.02 trillion in fiscal 2026 revenue and RMB 103.592 billion in net profit. Kuaishou reported second-quarter 2026 revenue of RMB 35.384 billion and net profit of RMB 3.133 billion.
For market prices, intraday levels on Oct. 20 were HK$412.0 for Tencent, HK$105.4 for Alibaba, HK$28.64 for Kuaishou and HK$3.962 for 3033.HK.
Southbound flow data came from Securities Times Data Treasure for Oct. 12 to Oct. 16, Cailianshe for Oct. 15 and Oct. 16, and Wind for cumulative figures since July through Oct. 8.
On valuation, Tencent’s 2027 forward P/E of about 14x was cited from a Futu research note dated Oct. 15. Meta at about 20x forward earnings and Nvidia at about 33x TTM earnings were based on media tallies and financial-reporting conventions.
Capital expenditure data came from Microsoft cash flow statements for fiscal 2025 and 2026 by quarter. The article notes that institutional views cited in the piece are quoted references only and represent the judgments of those institutions.
The article also states that its content is for general information and market commentary, based on public materials available as of the times referenced. Market data, expectations and probabilities may change with market conditions. Views and strategies cited from third-party institutions, analysts or other individuals represent those parties at specific times and do not represent BIT’s views or recommendations. The article does not constitute investment advice, investment research, an offer, solicitation or recommendation regarding any security, investment product or trading strategy, and should not be used as the basis for any investment decision. Financial markets involve risk, and security prices and market performance may fluctuate. Historical performance and past market moves do not represent or guarantee future results. Investors should independently assess relevant risks based on their own circumstances and seek professional advice when needed.