Macro Environment: DXY Strengthens, Bitcoin Decouples
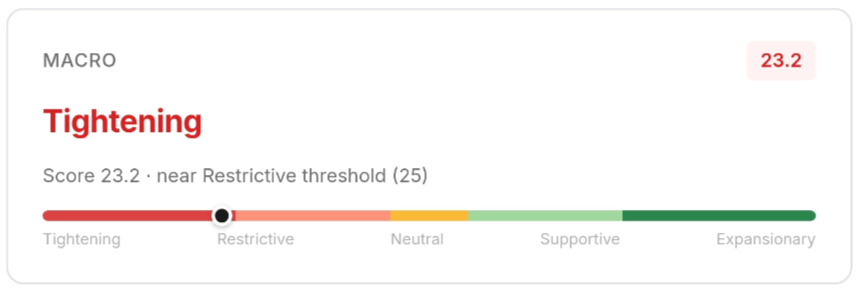
The U.S. Dollar Index (DXY) reclaimed its 200-day moving average, reaching 101.37 on June 23, up sharply from 99.24 thirty days earlier. This marks the first time since April's 'Liberation Day' shock that DXY has traded above its 200-day MA of 98.72. However, Bitcoin has not participated in this recovery; BTC currently trades at $62,651, 18% below its own 200-day moving average of $76,466. The macro recovery remains an equity story driven by U.S. corporate earnings resilience, while a strengthening DXY is a headwind for Bitcoin.
On-Chain Metrics: Deep Discount and Cost Basis Shifts
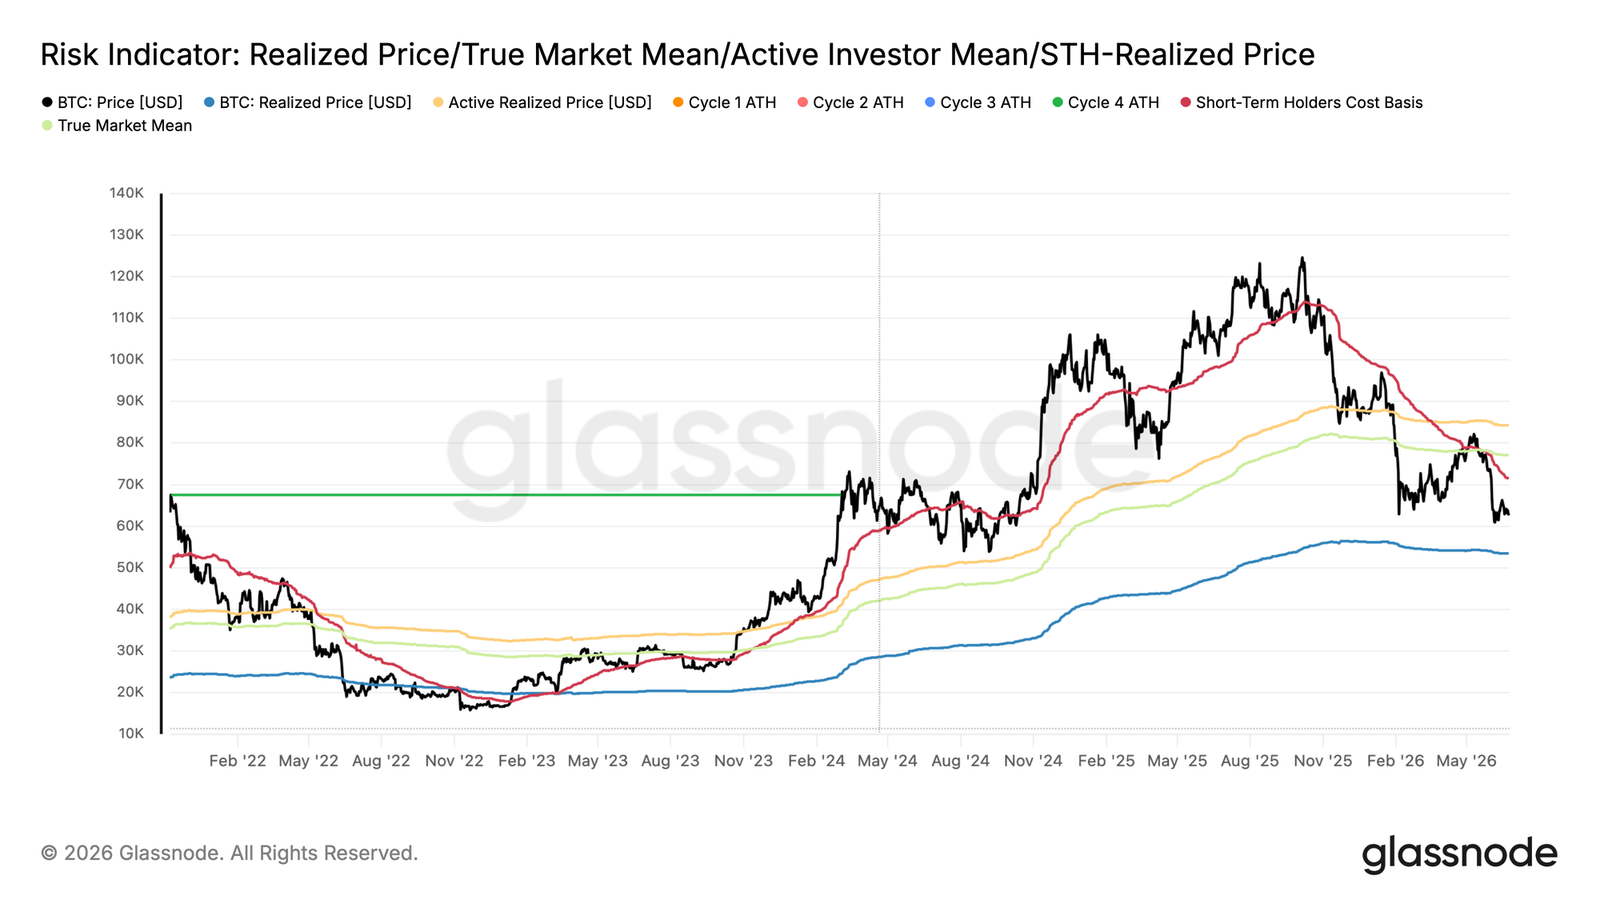
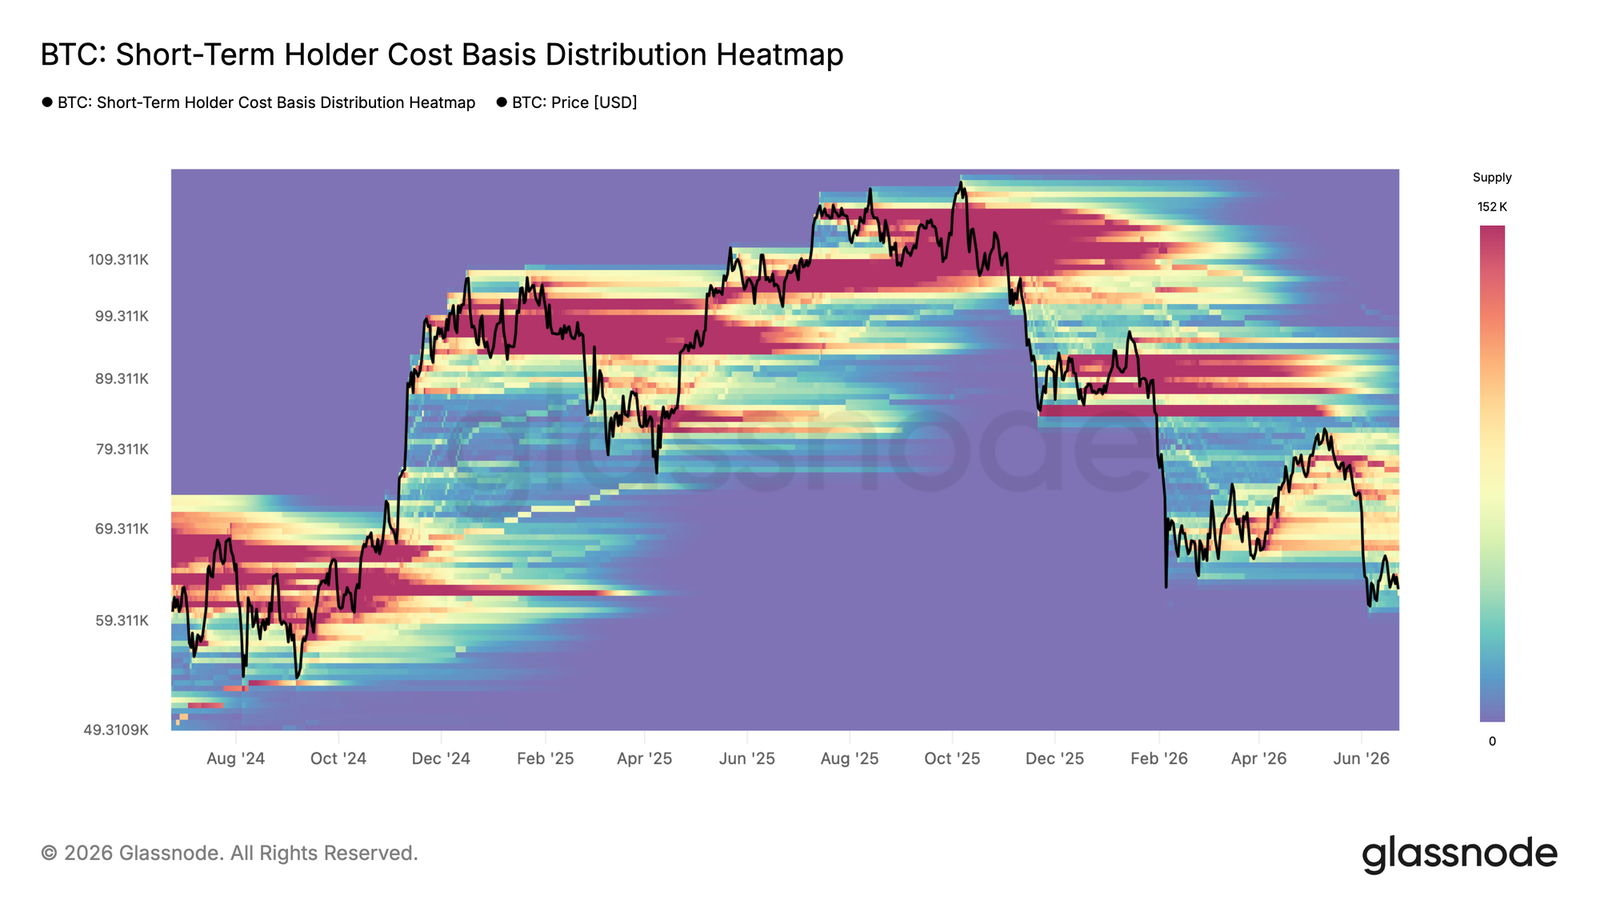
Bitcoin's spot price of $62,300 sits well below the True Market Average Price (TMAP) of $77,000, representing a 19% discount that indicates a structural bear market. Notably, the short-term holder cost basis has declined to $71,400, reflecting significant accumulation by new buyers below the TMAP—a constructive step in bottom formation. The realized price of $53,400 serves as a reasonable lower bound for the short-to-medium-term bear range.
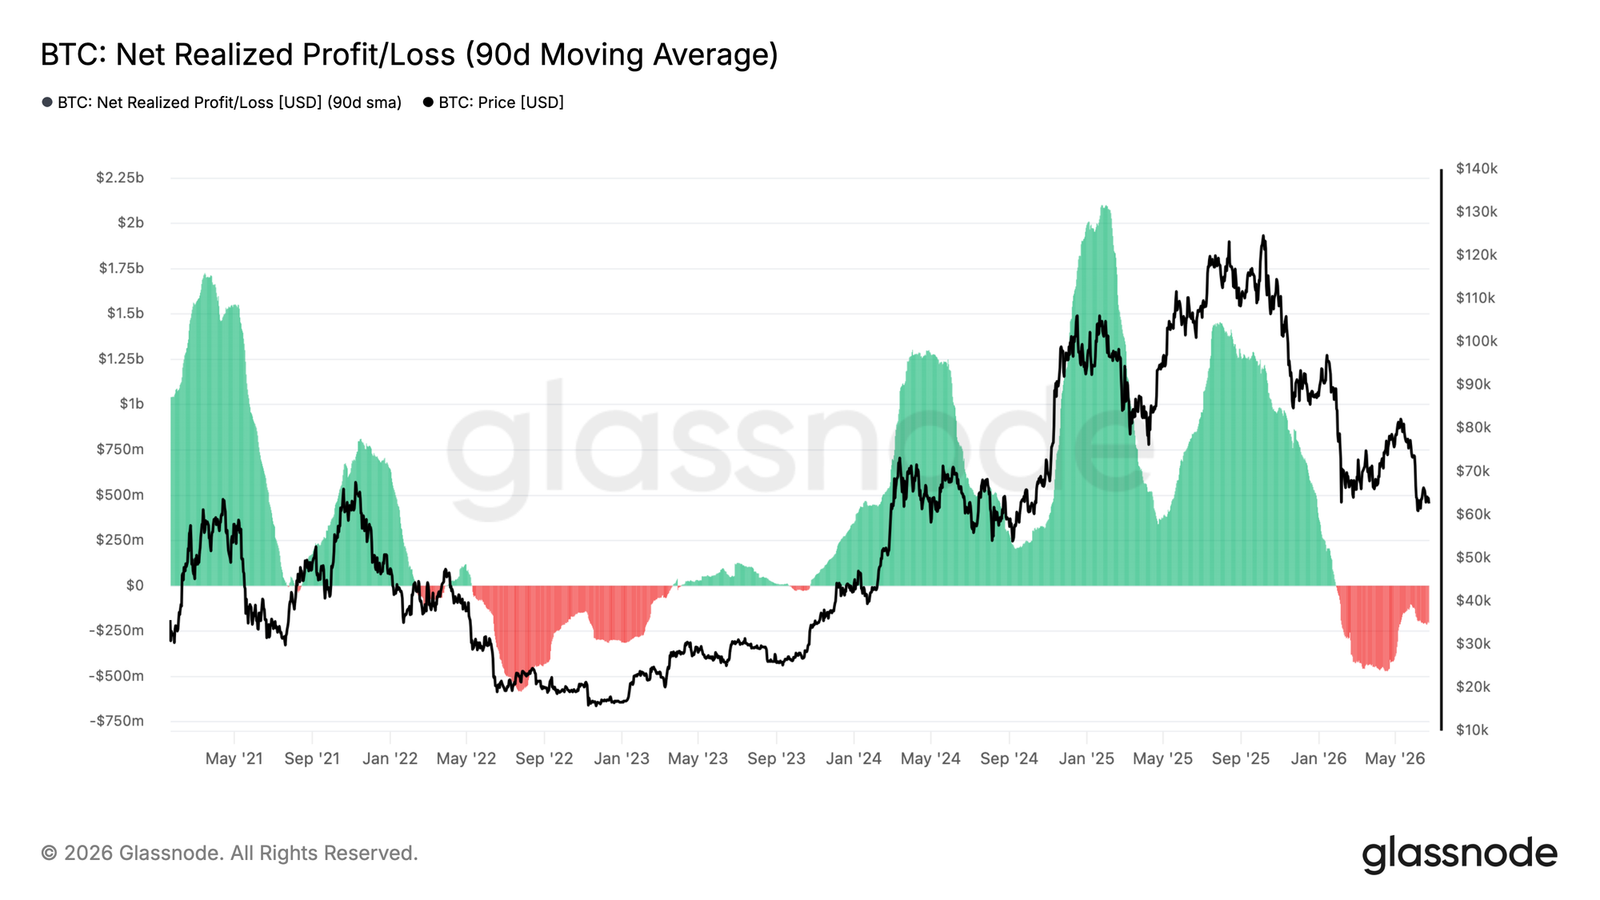
The 90-day moving average of the Net Realized Profit/Loss metric is currently -$205 million per day, confirming that loss realization has become the dominant spending behavior. A reversal toward neutral (near zero) would signal that seller exhaustion is emerging, setting the stage for a potential bull transition.
Spot and Futures Markets: ETF Outflows Meet Divergent Buying
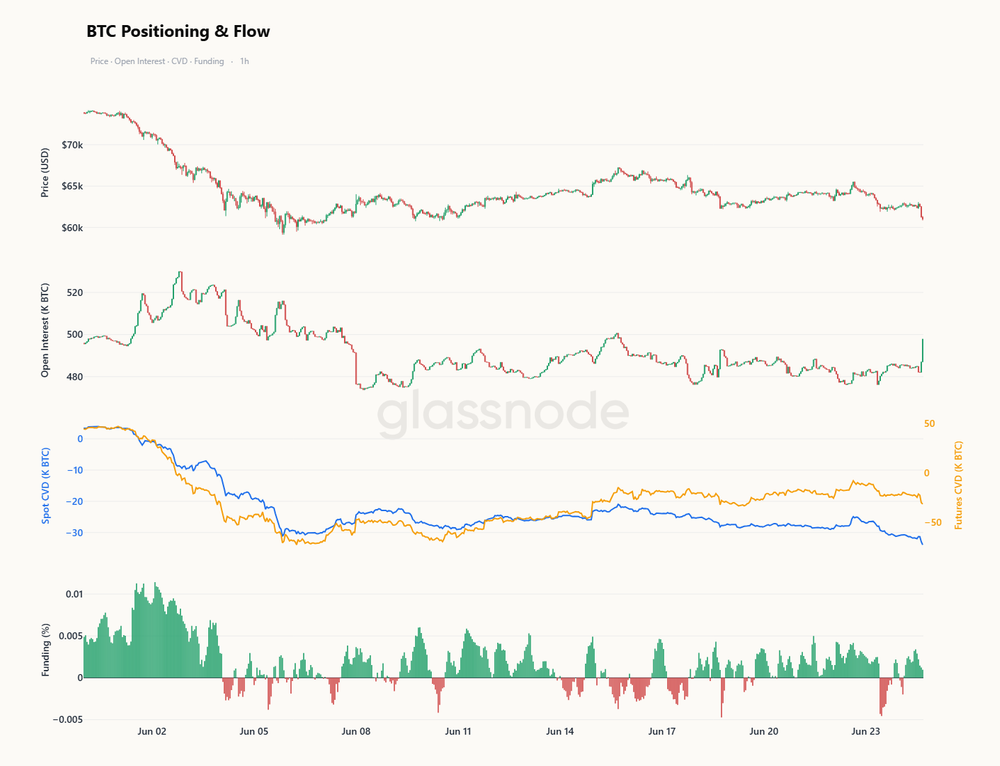
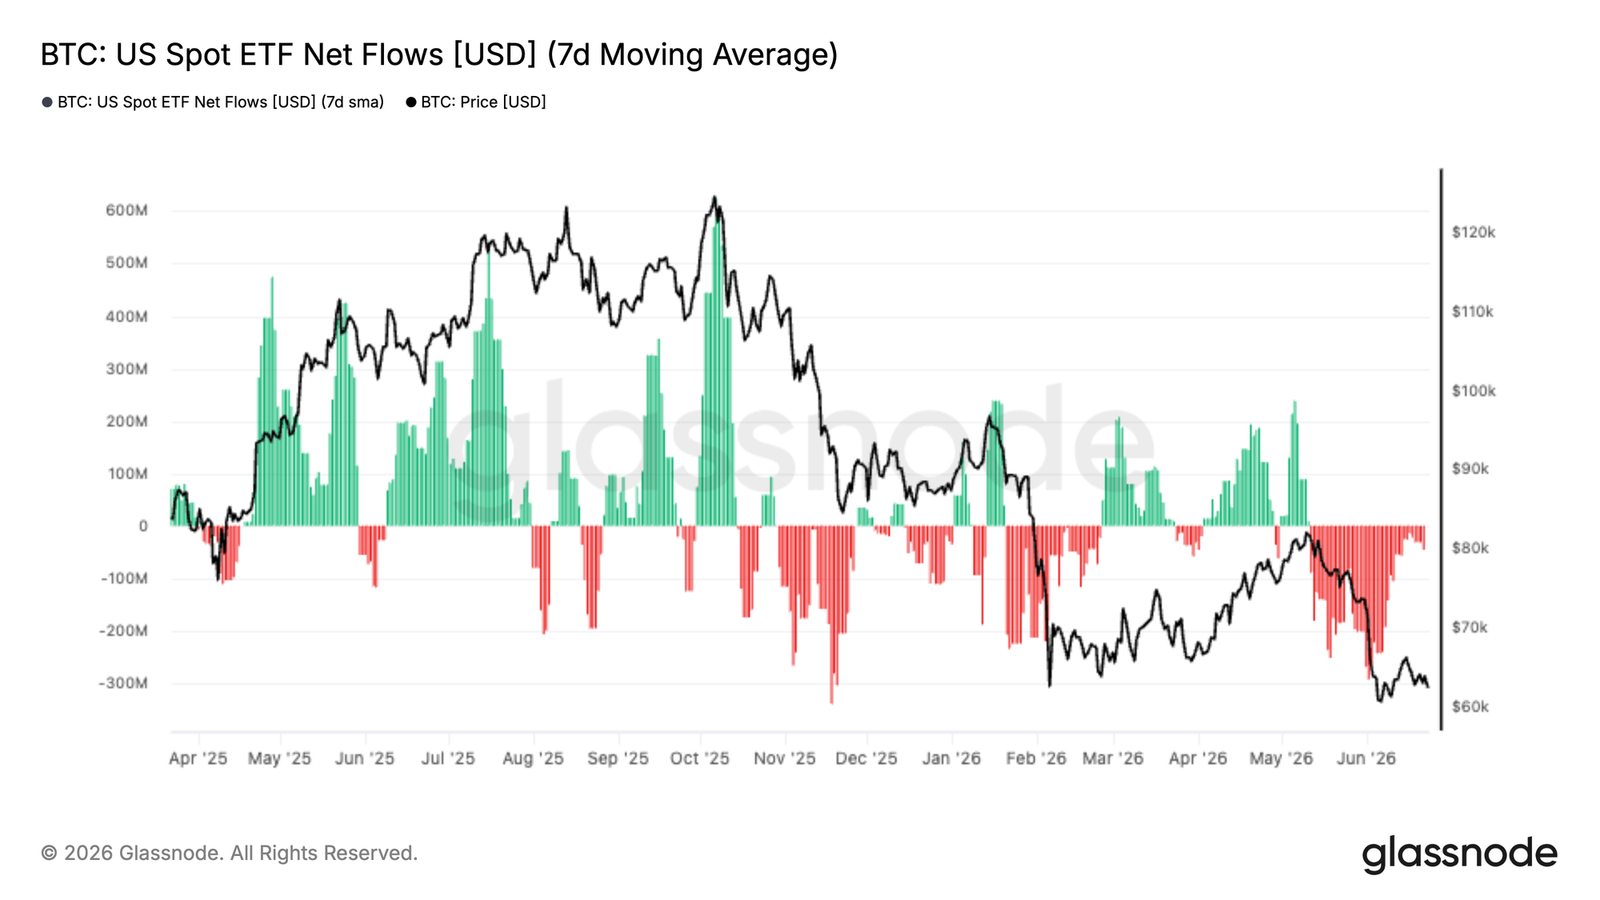
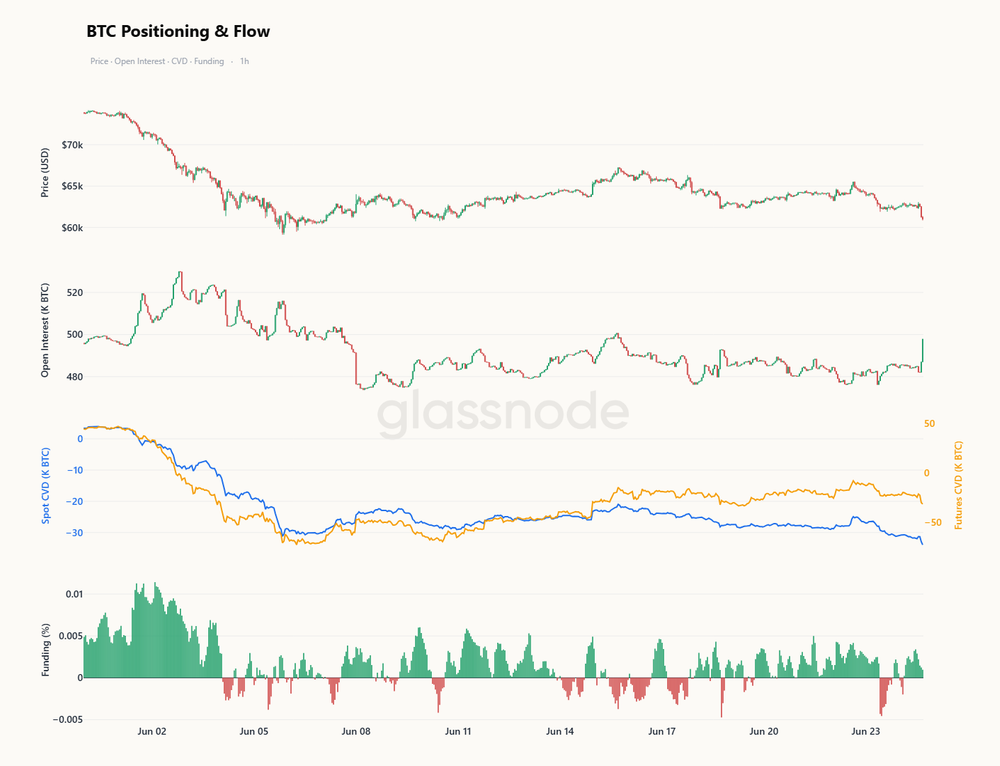
U.S. spot ETF outflows continued, with the 7-day average net outflow approaching -$300 million daily—one of the most sustained withdrawal periods since launch. Grayscale's GBTC alone saw outflows exceeding 16,000 BTC over the past 90 days, driven by legacy holder liquidation and portfolio rebalancing rather than a unified retreat. The spot market shows a clear divergence: Coinbase's spot CVD (Cumulative Volume Delta) has turned significantly positive, indicating renewed buying from U.S. institutional participants, while Binance's CVD remains negative, suggesting overseas traders remain defensive. In the futures market, open interest has surged, funding rates have cooled, and leveraged participants are finally capitulating alongside spot, amplifying the washout.
Options Market: Stable Volatility, Rising Skew, and Gamma Positioning
Options implied volatility has settled into a calmer range. The 1-week ATM implied volatility briefly exceeded 42% during the latest sell-off before retreating to around 37%. The 1-month tenor fell from ~40% to 38%, while longer tenors remained stable (3-month ~39%, 6-month ~42%). However, the volatility risk premium remains negative: 1-month implied at 38% vs. realized at 42%, meaning actual market moves outpace options pricing. Skew has risen across the curve: 1-week skew jumped from 12% to 24%, 1-month from 14% to 23%, indicating a renewed preference for downside protection. Gamma exposure shows the largest positive clusters at $60K and $64K, with the nearest negative gamma at $65K but much smaller. Market makers' long gamma positioning helps suppress volatility within the $60K–$64K range.
Early Bottom Formation Signals: A Tug-of-War
Beneath the surface, early signs of stabilization are emerging: Coinbase spot flows have turned constructive, short-term holder cost basis is adjusting downward, and recent weakness has been driven by spot selling rather than excessive leverage. While these developments do not signal an imminent reversal, they align with the early stages of a bottom formation process. The market remains in a tug-of-war between ongoing distribution and emerging value-driven demand, and the outcome of this struggle will define Bitcoin's next major move. Broad demand for accumulation has yet to return, but the pieces are being put in place for a potential transition.