

Bitcoin is back above $86,000, but still about 31.5% below its peak
Bitcoin traded back above $86,000 on Oct. 5. Yahoo Finance reported BTC at about $86,121 that day, up 2.4% over the past week and 8.6% over the past month, while still down 29.3% from a year earlier. The same report identified Bitcoin’s all-time high as $126,198.07 on Oct. 6, 2025.
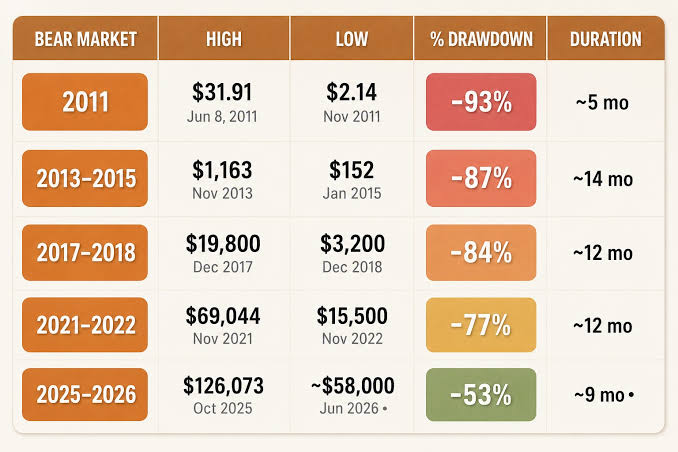
That leaves the asset in an awkward but familiar spot. It has rebounded sharply from this year’s low, yet it remains roughly 30% below the record. Using newhedge drawdown data cited in the article, BTC is about 31.5% below the Oct. 6, 2025 high.
According to an intraday record from investinglive on June 30, the 2026 low came on June 25 at $58,035, the weakest level since September 2024. From that low to $86,121 on Oct. 5, Bitcoin had rallied by nearly 50%.
The article’s central point starts there: once price has already bounced that much, the more useful question is no longer where the next target sits, but how much downside can still occur inside a broader bull-market structure.
Current positioning can support two very different readings
The piece argues that Bitcoin is sitting between two extremes at once. It is down about 30% from the all-time high, but up close to 50% from the June low. Historically, that kind of structure has appeared both in the middle of an ongoing uptrend and during relief rallies after a cycle top. Drawdown size alone does not settle which one this is.
That is why the article treats historical drawdowns less as a forecasting tool and more as a risk-management framework. For holders, the practical lesson is that 30% pullbacks have been common inside rising cycles, and 50% pullbacks have happened as well. The bigger uncertainty often lies in how long the decline lasts and how long recovery takes.
Key takeaways highlighted in the article
- Bitcoin’s current position sits between two extremes: about 31.5% below the all-time high and nearly 48% above the June 25 low.
- A 30% drawdown is presented as a normal cost of participation in a rising cycle. CoinDesk analysis dated Jan. 10 said the current broader advance had already seen at least two mid-cycle pullbacks of more than 30%, one after the January 2024 spot ETF launch that lasted 147 days, and another tied to tariff shocks that lasted 77 days.
- A 50% drawdown also has precedent. In 2013, Bitcoin fell more than 50% in April and still made a new high in November. In 2021, BTC dropped below $30,000 in June and later rose above $68,500 in November.
- The current cycle’s maximum decline appears smaller than in earlier cycles. Bitcoin.com cycle data cited in the article show prior peak-to-trough declines of about 87%, 84%, and 77%, versus roughly 54% from the $126,200 area to the June low in this cycle.
- Recovery time is harder to predict than drawdown depth. Blockworks data cited in the piece show the 2013 high took about 1,200 days to reclaim, while the November 2021 high of $69,000 was broken in less than 850 days.
- Two near-term windows matter: the Federal Reserve’s next policy meeting on Oct. 27-28, and whether ETF flows continue the shift from net outflows to net inflows that began in late August.
2026 price structure: 30% below the top, nearly 50% above the low
Using Bitcoin price history compiled by SoFi, the article says Bitcoin reached $97,860 in January 2026, then fell to $60,074 in February. The June 25 low of $58,035 marked a fresh low for the year. From $58,035 to $86,121 on Oct. 5, the gain was about 48%, but price still remained below the all-time high of $126,198.
The article says this setup leaves room for two interpretations. If it is a deep correction in the middle of a cycle, the rebound can be read as trend repair. If it is a bounce after a top, the same structure points somewhere else entirely. Drawdown data can define a reasonable volatility range, but they cannot by themselves identify the cycle stage.
Macro repricing and capital flows shifted at the same time
The rebound is traced in part to changing rate expectations. In a policy implementation statement dated Sept. 16, the Federal Reserve confirmed that the target range for the federal funds rate was raised to 3.75% to 4%, while the interest rate on reserve balances was raised to 3.90%. CNBC reported that this was the Fed’s first rate hike since July 2023, and that the decision passed unanimously, 12-0.
After that, September nonfarm payrolls showed only 29,000 jobs added. The article says market bets on further tightening fell quickly. The Yahoo Finance market report it cites said the probability of rates being left unchanged rose from 29.1% to 80.6% within a week.
Capital flows turned around in the same period. Based on Bitcoin.com’s ETF flow statistics, U.S. spot Bitcoin ETFs have taken in about $4.6 billion in net inflows since Aug. 19, offsetting redemptions from the first half of the year and pushing 2026 net inflows back into positive territory at about $320 million. The article argues that because ETFs have become the main channel for incremental capital, changes in those flows often show up before price structure shifts.
How deep have bull-market pullbacks been in past cycles?
2013: a halving-style collapse inside a year of explosive gains
SoFi’s historical data, as cited in the article, show Bitcoin starting 2013 near $13, climbing to almost $250 in April, then falling by more than 50%. Even so, it later surged to about $1,193 in November and December of that year. On an annual basis, it was a year of multi-fold gains. For anyone trading with leverage, the mid-year drawdown would have been enough to force liquidation.
2017: a 20x year interrupted again and again
The same SoFi record shows Bitcoin starting 2017 near $960 and rising roughly 20-fold in less than 12 months, ending the year near $20,000. The article stresses that the move was not a straight line. When Chinese regulators pushed trading platforms to halt services in September that year, Bloomberg described the market reaction as another crash. Regulatory shocks, exchange disruptions, and fork disputes all appeared during the same year, and each one was large enough to darken sentiment without ending the annual trend.
2021: below $30,000 in June, above $68,500 in November
The 2021 cycle offers one of the clearest examples of a severe drawdown followed by a fresh high. Al Jazeera reported on June 22 that BTC fell below $30,000 as China kept tightening restrictions on mining and trading. SoFi’s data, cited in the article, show Bitcoin later climbing back above $68,500 in November. In other words, the June low was less than half of the year’s later peak. For holders who exited in June, that drop looked like the end. For those who stayed in the trend, it was an expensive interruption.
2024 to 2025: smaller drawdowns, longer waiting
The article says the shape of pullbacks changed once institutional capital became more dominant. CoinDesk data cited in the piece show that the drawdown following the January 2024 spot ETF launch exceeded 30% and lasted 147 days. Another drawdown of more than 30%, linked to tariff policy, lasted 77 days in 2025.
The same analysis said the early-2026 decline reached 36% in about 95 days, while the first 90 days after cycle tops in 2021, 2017, and 2014 saw declines of about 51%, 70%, and 71%, respectively. The article’s conclusion is straightforward: the depth may be narrowing, but the duration has not shortened in step. The pain is shifting from price to time.
Duration and recovery can be harder to bear than the drawdown itself
The time cost of a correction
Looking across the examples, the article says mid-cycle drawdowns of more than 30% lasting 77 to 147 days are not unusual. That is long enough to break many position-management plans, especially when investor tolerance is measured in weeks rather than quarters.
Leverage makes the problem more immediate. CoinJar’s review of the market turbulence on Oct. 10-11, 2025 recorded more than $19 billion in liquidations over 24 hours, affecting more than 1.6 million traders, while Bitcoin itself fell only from about $125,000 to around $115,000 by Oct. 13. The price move was less than 10%, yet the liquidation total set a record. The article uses that episode to argue that risk often comes from position structure rather than price alone.
It points to funding rates, open interest, and options expiry calendars as practical indicators for tracking that kind of stress.
How long does it take to reclaim a high?
Blockworks offers another benchmark. The article cites its data showing that the November 2013 high near $1,240 was not reclaimed until April 2017, a wait of about 1,200 days. By contrast, the November 2021 high of $69,000 was broken in less than 850 days, the fastest recovery among recent cycles mentioned in the piece.
That acceleration is often linked to changes in market structure, but the range itself still matters. Even if the trend eventually recovers, the waiting period can still be measured in years.
Why this cycle looks shallower, and where that argument stops
Compression in drawdown size is visible in the data
Bitcoin.com cycle data cited in the article show peak-to-trough declines narrowing from about 87% to 84%, then 77%, and now roughly 54%. Inside the rising phase, a Glassnode on-chain weekly report from October 2024 said the largest drawdown in that cycle, measured on closing prices, was 26%, shallower than in prior bull-market phases.
The article says the usual explanations include persistent buying through spot ETF channels, more mature market-making, and better pricing efficiency between spot and derivatives markets.
There is still disagreement over the four-year cycle
This is where the market split becomes most visible. Fidelity Digital Assets, in research cited by the article, argues that the traditional four-year cycle has lost explanatory power and that 80% drawdowns may belong to the past, with Bitcoin behaving more like a maturing asset that rises and falls in a more gradual way.
On the other side, Cointelegraph reported in August 2025 that Glassnode still saw price action echoing earlier cycle rhythms. Based on historical patterns, the cycle top could have arrived as early as October that year, and the actual high did in fact land on Oct. 6, 2025.
As for the current decline, the article cites a recent Glassnode report relayed by ChainCatcher saying that as of Sept. 23, Bitcoin was down about 30% from its all-time high, while comparable declines in the prior three cycles were each more than twice as deep. On that basis, the report said the odds of another decline of similar magnitude were falling. The article adds an important limit: this is a probability judgment based on historical distribution, not a guarantee, and the sample covers only four full cycles.
Risks, scenarios, and what the market is watching next
Risks that cannot be ignored
The article warns against using historical recoveries as an excuse for unlimited position size. The sample is small, and four cycles are not enough for strong statistical certainty. Institutionalization may have reduced volatility, but it has also introduced new transmission channels. ETF redemptions and tighter correlation with traditional risk assets could make drawdowns more sensitive to macro events than to crypto-native rhythms.
Leverage remains the amplifier. The liquidation wave in October 2025 showed that price does not need to fall very far to force structurally weak positions out of the market. The article also notes that if the market is already in a post-top phase, the current rebound should not automatically be treated as a restored trend.
Three scenarios laid out in the article
- Trend-repair scenario: ETF inflows continue, rate expectations stay neutral to easier, and Bitcoin moves back toward the six-figure zone. Even in that case, 20% to 30% pullbacks could still occur, in line with the distribution seen over the past two years.
- Range-bound scenario: Macro conditions fail to provide a clear direction and price swings repeatedly between $60,000 and $90,000. In this setup, time cost exceeds price cost, making it especially difficult for leveraged traders and short-horizon strategies.
- Downtrend-extension scenario: Macro conditions tighten again or ETF flows turn back to net outflows, leading the market to retest or break the June 25 low of $58,035. In that case, the reference point would no longer be this cycle’s roughly 54% decline, but the 77%+ peak-to-trough losses seen in earlier cycles. The article also mentions a lower-probability but higher-impact tail risk: a credit event involving major custody or trading infrastructure, where liquidity and counterparty quality would matter more than price calls.
What comes next
The next Federal Reserve meeting is scheduled for Oct. 27-28, which the article treats as the baseline date for judging the rate path. It also says the durability of ETF inflows since Aug. 19 will determine whether the market has a sustainable source of incremental buying.
On price levels, the June 25 low of $58,035 and the February low of $60,074 form the downside reference zone, while $126,198.07 remains the final confirmation level for a full trend recovery. Across assets, the article says changes in Bitcoin’s correlation with risk assets are worth tracking, as is the rotation between major coins and altcoins through Bitcoin dominance.
James Mitchell’s view: drawdown data matter because they turn volatility into a calculable cost
The article closes with an exclusive view attributed to James Mitchell. In his reading, the real value of drawdown data is not to tell investors what level of decline is “normal,” but to convert volatility into a cost that can be planned for in advance. Two drawdowns of around 30% over the past two years lasted 147 days and 77 days. That means any position plan built on a monthly horizon should assume a net-asset decline of roughly 30% lasting close to a quarter. If a position would force the holder to exit at the low under those conditions, the flaw lies in the position design, not in the market.
He points to two common misreadings. The first is treating smaller drawdowns as proof that volatility risk has fallen. Glassnode’s 26% maximum in-cycle drawdown and the current cycle’s roughly 54% peak-to-trough decline both show compression in depth, but not in duration. Liquidation risk depends on the combination of leverage and drawdown, not on historical averages. The more than $19 billion in liquidations during the October 2025 drop, when price fell by less than 10%, is cited as direct evidence.
The second is equating a 30% decline from the high with a mid-cycle correction by default. The same drawdown size can appear both in the middle of a cycle and after a top. The article says distinguishing between the two requires cross-checking flows, on-chain cost bases, and macro conditions. Price alone cannot do that job.
Mitchell highlights three variables to watch next. First, whether ETF net inflows can hold their direction after the roughly $4.6 billion added since Aug. 19. Second, the time structure of the drawdown: if price stays around 30% below the high for more than a quarter without making a new low, the pattern would look more like mid-cycle digestion than trend damage. Third, leverage concentration. When open interest builds quickly and funding rates stay positive, even a mild pullback can trigger a chain of liquidations.
For investors using dollar-cost averaging, the article says the key question is not how deep the next drawdown will be, but whether a cash-flow plan remains workable if Bitcoin falls within a 30% to 50% range.
A broader cross-asset message
The article’s broader conclusion is that Bitcoin is going through the same transition seen when any asset class becomes more institutionalized: volatility amplitude falls, while the time cost of holding rises. Traditional market participants have seen versions of this before. Equity indexes in long-term uptrends also go through repeated 20% corrections and multi-year sideways periods.
The difference is that Bitcoin’s sample is still short, which makes it easy for investors to mistake a four-cycle pattern for a law. The article says Fidelity’s view that the four-year cycle is losing explanatory power and Glassnode’s view that cycle rhythm still persists do not necessarily contradict each other. They may simply describe two sides of the same transition. In that setting, setting position limits by drawdown tolerance may be more useful than setting expectations by target price.
Questions addressed in the article
How much can Bitcoin fall in a bull market?
Historical records cited in the article show that pullbacks of more than 50% have happened inside rising cycles. In 2013, Bitcoin fell by more than 50% in April and still made a new high near $1,193 in November. In 2021, BTC dropped below $30,000 in June and later rose above $68,500 in November. More commonly, the article places the range at 20% to 35%, with one 30%+ drawdown in 2024 and another in 2025 during the current broader cycle.
How far is Bitcoin below its all-time high now?
Using newhedge drawdown data cited in the piece, Bitcoin is about 31.5% below the Oct. 6, 2025 all-time high of $126,198.07. On Oct. 5 it traded around $86,121, down 29.3% year over year but up 8.6% over the past month. At the same time, it had rebounded about 48% from the June 25 low of $58,035.
Is this a mid-cycle correction or a post-top phase?
The article says there is no definitive answer yet. ChainCatcher’s relay of a Glassnode report says the current decline is less than half as deep as the comparable drops in the prior three cycles, lowering the probability of another equally deep move. Fidelity Digital Assets argues that the four-year cycle has weakened as an explanatory model. The opposing view noted in the article is that the June 2026 low represented a decline of about 54% from the high, already within the range historically associated with cyclical bear markets. The distinction requires combining ETF flows, on-chain cost bases, and the macro rate path.
How long do deep pullbacks usually last?
CoinDesk data cited in the article show that the 30%+ drawdown after the 2024 spot ETF launch lasted 147 days, the tariff-driven drawdown in 2025 lasted 77 days, and the early-2026 decline reached 36% in about 95 days. That puts a typical deep correction in a range of roughly two and a half to five months.
How long does it take to recover a prior high?
Blockworks data cited in the article show that the November 2013 high near $1,240 took about 1,200 days to reclaim, while the November 2021 high of $69,000 was broken in less than 850 days. Even the fastest example still required more than two years.
Why does this cycle look shallower than earlier ones?
The article says the compression is visible in the data. Bitcoin.com cycle figures show peak-to-trough declines narrowing from about 87% to 84%, then 77%, and now roughly 54%. A Glassnode on-chain weekly report also recorded a 26% maximum drawdown within the rising phase. Common explanations listed in the article include persistent allocation demand through spot ETFs, more mature market-making and derivatives structures, and a holder base tilted more toward long-term capital. It also notes that with only four full cycles, there is no statistical certainty that the compression trend will continue.
How should investors manage risk during large drawdowns?
The article’s answer is to treat drawdowns as a calculable cost rather than a surprise event. It points to setting position limits based on stress scenarios, matching leverage to tolerable drawdown, watching funding rates and open interest to avoid chasing when leverage is crowded, and using staged buying such as dollar-cost averaging to reduce dependence on a single entry point. The October 2025 episode, when Bitcoin fell by less than 10% but liquidations exceeded $19 billion, is used to show that position structure can matter more than price itself.