

Bitcoin is slipping deeper into October instead of following the market’s usual "Uptober" pattern. The asset fell 2.67% over the past 24 hours to $81,125, nearly wiping out half of its gains from September.
According to Decrypt, the move runs against the historical pattern many traders watch: a weak September followed by a stronger October. The same kind of break from seasonality also showed up last year.
Macro backdrop remains a drag
Decrypt said Bitcoin is trading against an unfriendly macro setup. On Wednesday, Wall Street pulled back from record highs as Brent crude hovered near $100 a barrel and Treasury yields stayed close to their highest levels since 2002. Minutes from the latest Federal Reserve meeting also showed that most officials still expect another rate hike before the end of the year.
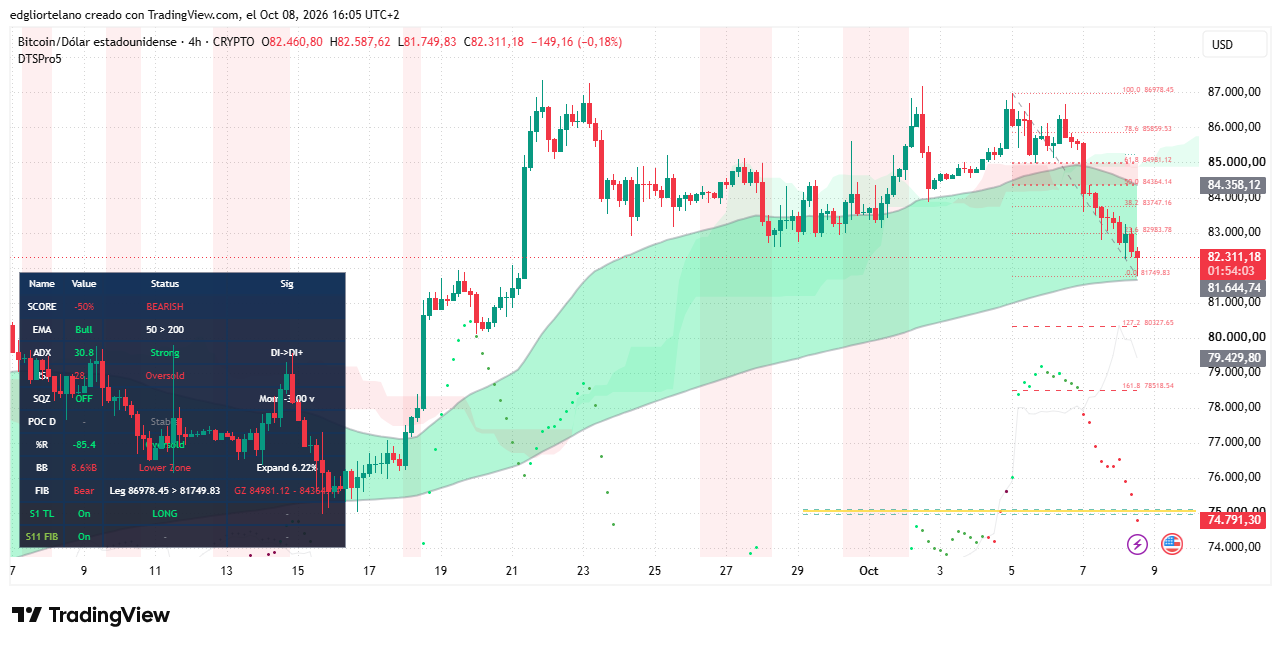
Those pressures have been weighing on Bitcoin for some time. Decrypt noted that the previous day’s selloff had slowed, but not stopped. Bitcoin sold off alongside stocks and gold, while still showing a bullish daily chart against a bearish four-hour chart. That split remained in place on Thursday.
Daily trend is still intact, but with less room
The day’s candle opened at $83,310.16 and barely pushed higher, touching $83,475.78 before falling to around $81,337, a 2.37% drop. That low broke below the $82,776.30 floor highlighted a day earlier and left BTC under a short-term price zone at $82,626.41.
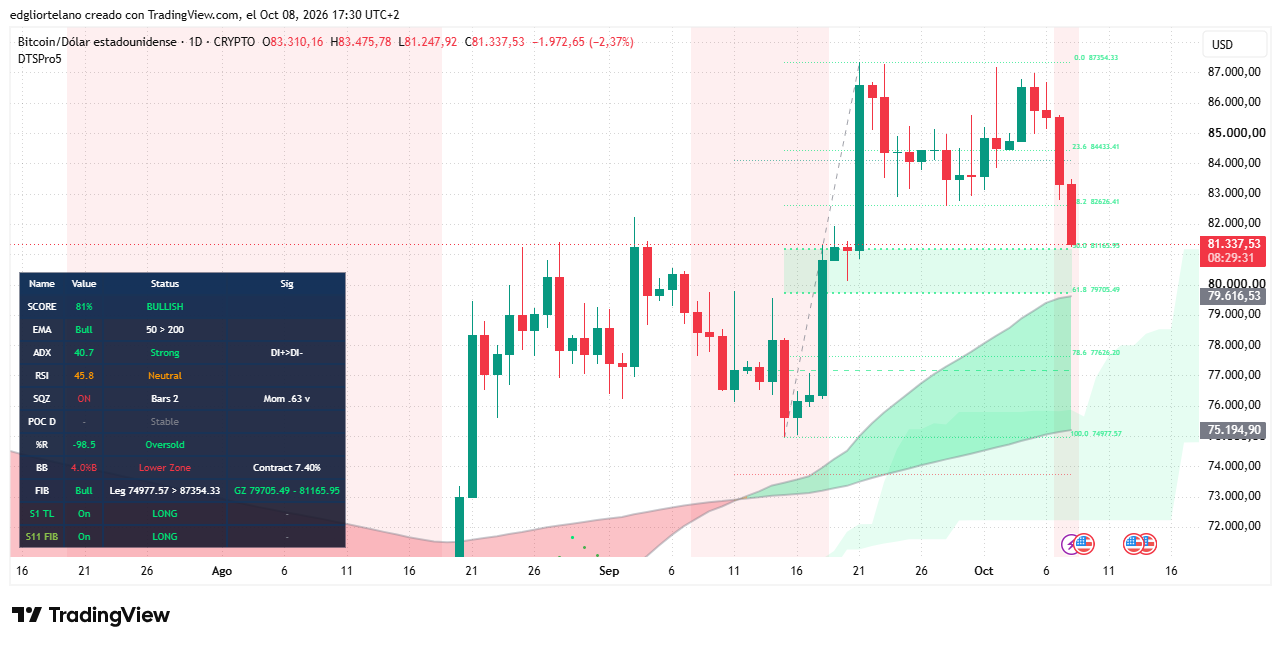
After peaking at $87,354.33 on Sept. 21, Bitcoin traded sideways between roughly $83,000 and $87,000 for more than two weeks. It now sits about 5.6% below that high.
The Average Directional Index, or ADX, which measures trend strength regardless of direction, stands at 40.7 on the daily chart, down from 42.8 a day earlier. Readings above 25 generally confirm a trend. Buying pressure, shown by +DI, remains ahead of selling pressure, or -DI, but bullish conditions are cooling.
The 50-day exponential moving average remains above the 200-day EMA, a setup traders usually read as a long-term uptrend that is still in place. The golden cross remains active on the daily chart, though it is starting to fade on intraday timeframes as Bitcoin approaches the EMA200 line.
Momentum looks weaker than trend strength alone would suggest. The Relative Strength Index, or RSI, fell to 45.8 from 52.5 the day before, slipping slightly below the 50 line that separates bullish from bearish momentum. The Squeeze Momentum Indicator remains on, which Decrypt said points to compressed volatility ahead of a larger move.
ETF outflows and liquidations added pressure
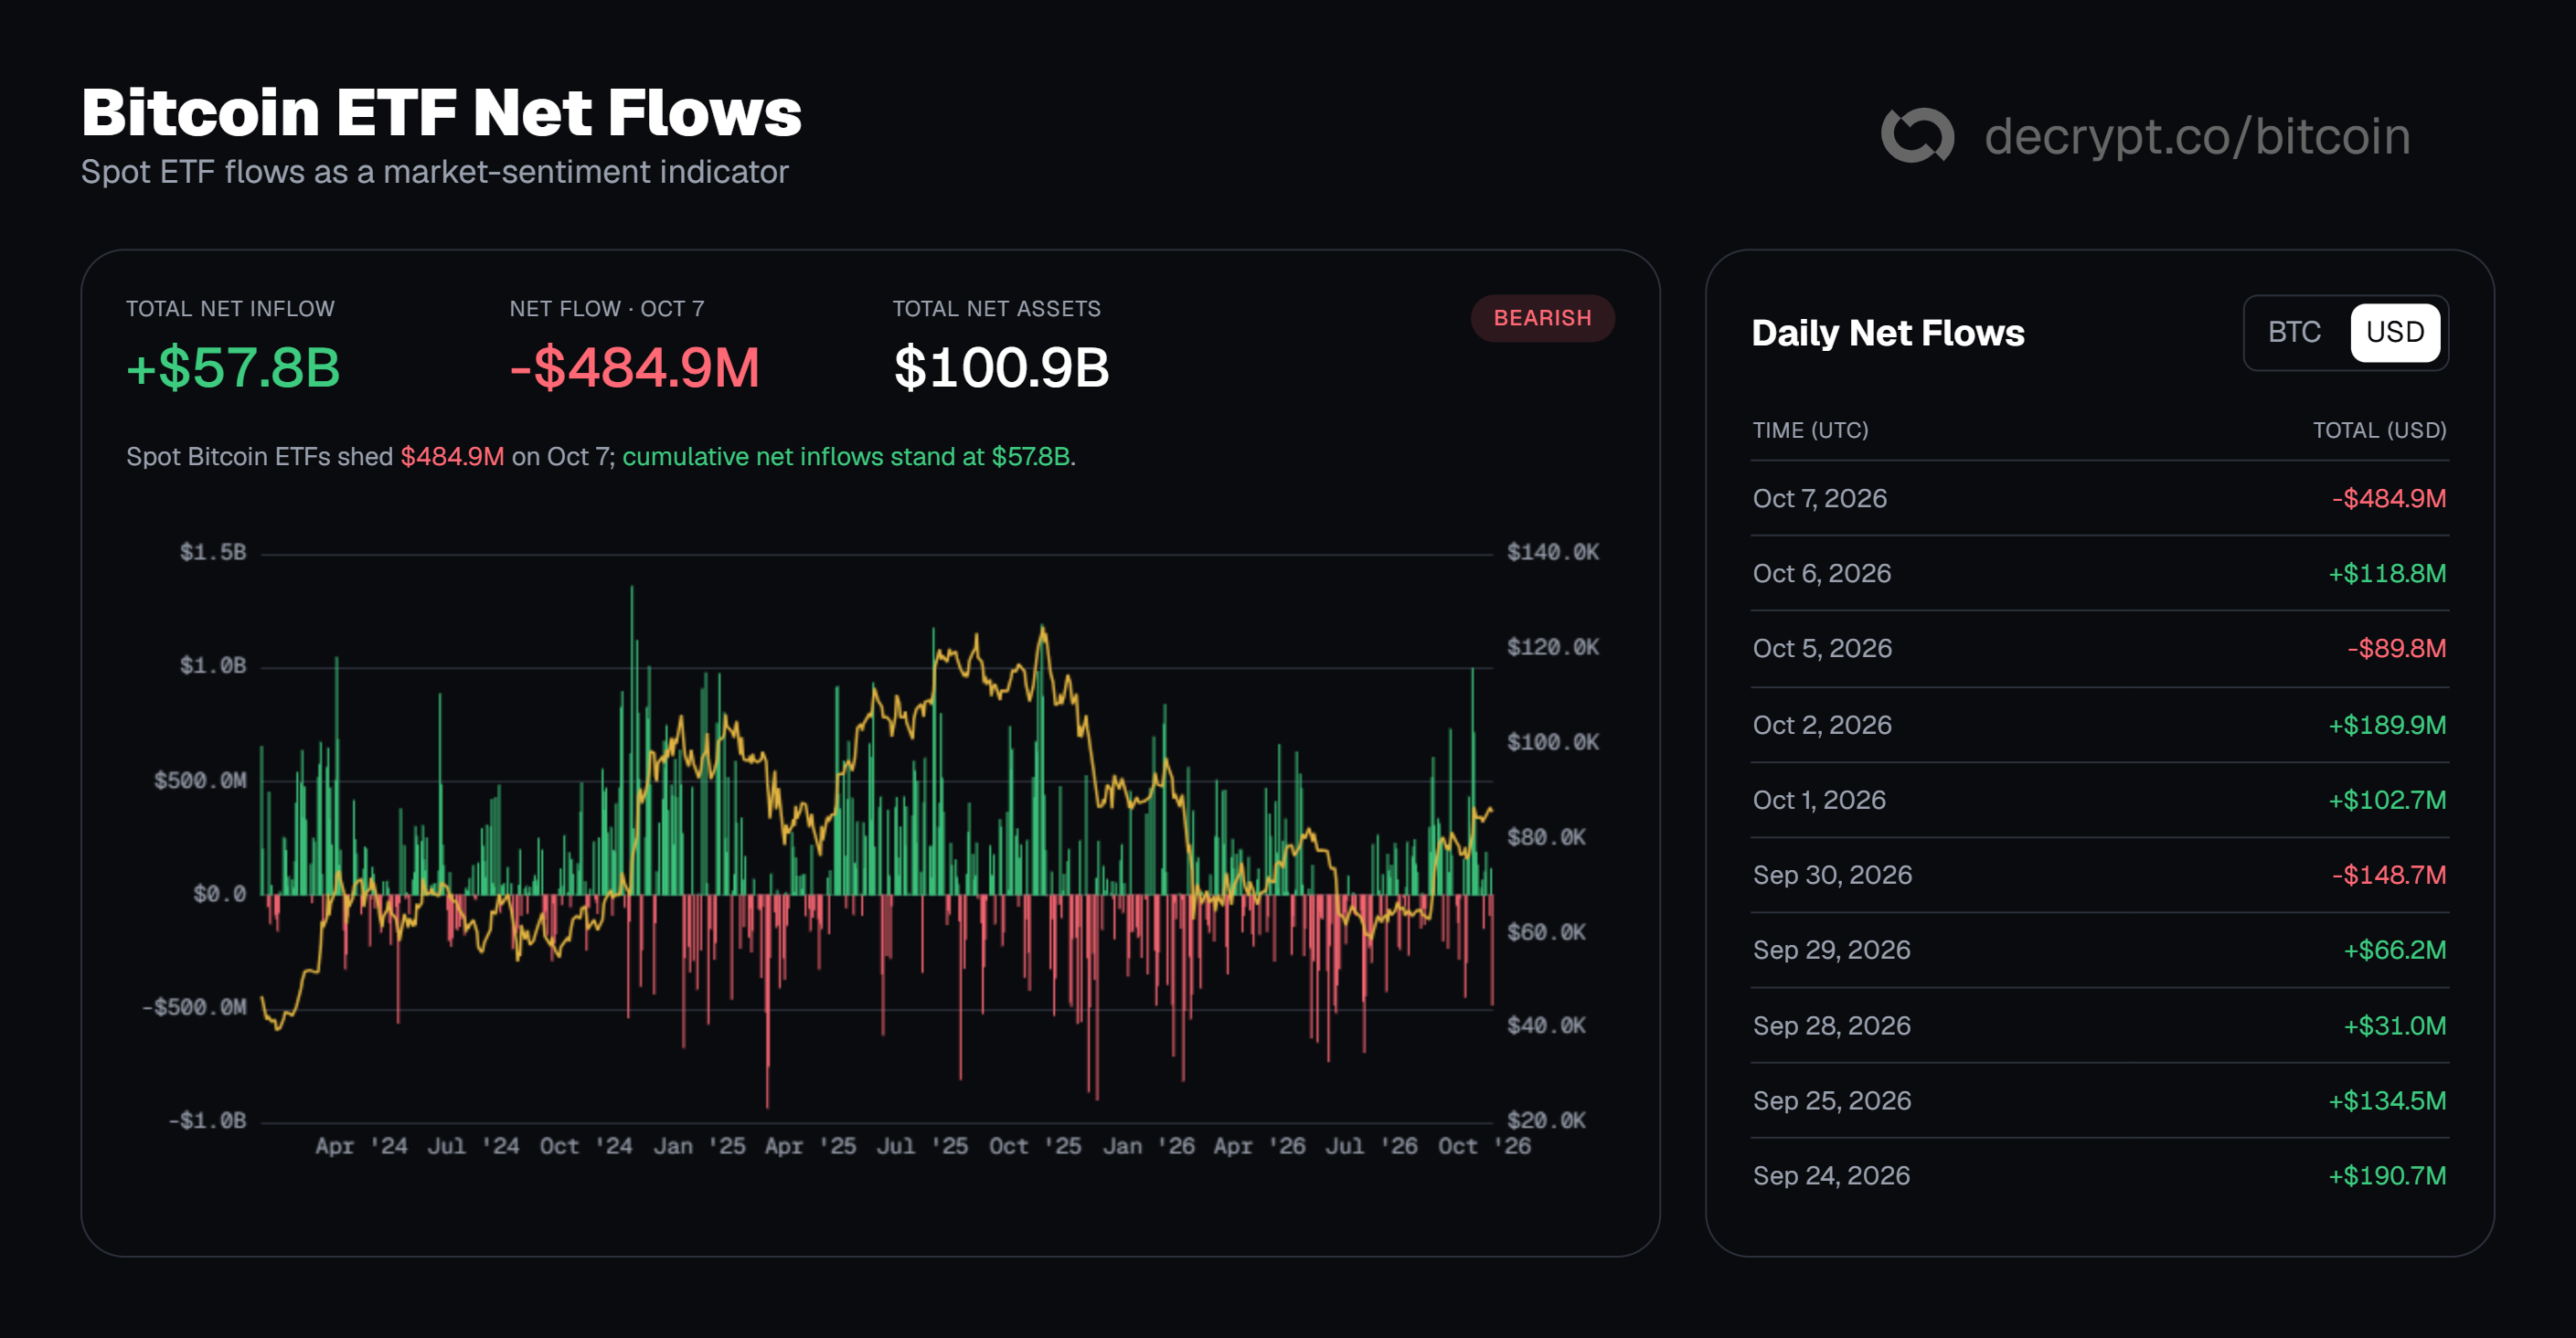
Spot Bitcoin ETFs recorded $484.9 million in net outflows on Oct. 7, their worst day since June, according to ETF flow data cited by Decrypt. That single session erased about 81% of the $595.3 million that had come in over the previous nine sessions and cut the 10-day net inflow to $110.4 million.
Cumulative net inflows still stand at $57.8 billion. Decrypt described the move as a hit, not an exodus.
Leverage amplified the decline. CoinGlass data showed about $429 million in positions liquidated over the past 24 hours, with 87.5% of those liquidations coming from longs. A liquidation happens when an exchange force-closes a leveraged position that can no longer cover its losses, and that forced selling can push prices lower.
Bitcoin accounted for $135.51 million of the total and Ethereum for $96.14 million. Nearly half of all liquidations, or $202.24 million, came in the last four hours. That is less than half of the previous day’s $969 million, but it still shows long positions are continuing to get flushed out.
Levels and events to watch next
Decrypt said a daily close below $82,626.41 would confirm a break of weak support and extend a short bearish correction. A close back above that level would keep the multi-week range intact.
Below that sits what Decrypt called the golden zone between $81,165.95 and $79,705.49, an area where pullbacks inside uptrends often attract buyers. The upper edge of the daily trend band is at $79,661.95, about $44 from the lower boundary of that zone.
The next catalysts on the market’s radar are oil prices, headlines tied to shipping through the Strait of Hormuz, Treasury yields, daily ETF flows, and the Federal Reserve’s Oct. 27-28 meeting, where a rate hike appears unlikely, according to Decrypt.