
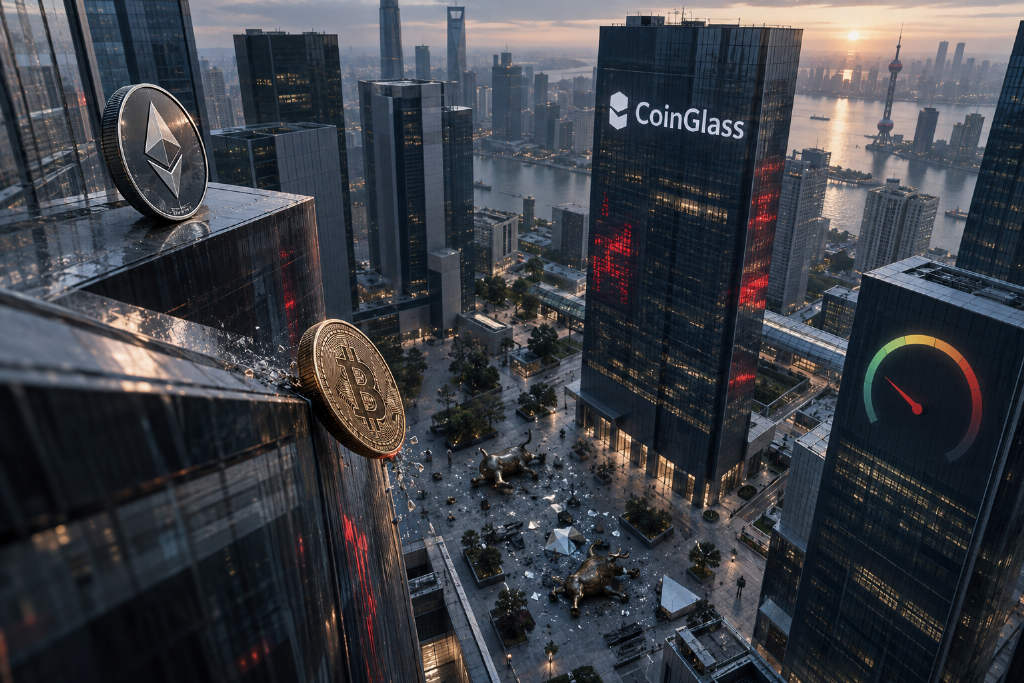
Crypto markets traded in a weaker range on Sept. 9, with Bitcoin pulling back to $78,700 and Ether holding near $2,497. Over the past 24 hours, total liquidations across the market reached $252 million, while Alternative.me’s Fear and Greed Index fell to 66 for a second straight daily decline.
Bitcoin tests $78,271 while Ether stays relatively firm
According to the report, the crypto market showed a softer tone on Sept. 9. Bitcoin moved between $77,600 and $79,500 before falling back to $78,700. Its intraday low was $78,271, and its 24-hour loss stood at 0.64%.
Ether was steadier. It rose 0.11% to $2,497 and touched a low of $2,477. The report said trading volumes remained light after the U.S. Labor Day holiday, while rising geopolitical tension in the Middle East weighed on overall risk appetite.
$252 million in liquidations, with longs taking the bigger hit
CoinGlass data cited in the report showed that liquidations across the crypto derivatives market totaled $252 million over the past 24 hours. Of that, long liquidations accounted for $163 million, or about 65%, while short liquidations came in at $89 million.
A total of 85,596 traders were liquidated. The largest single liquidation was a $2.96 million BTCUSDT order on Binance.
U.S. stocks reopen lower after holiday as oil climbs
U.S. equities resumed trading on Tuesday, Sept. 8, after the Labor Day holiday, and all three major indexes finished lower. The S&P 500 fell 45.08 points, or 0.6%, to 7,673.52. The Dow Jones Industrial Average dropped 628.18 points, or 1.2%, to 52,786.07. The Nasdaq fell 85.58 points, or 0.3%, to 26,421.41.
The market is watching for CPI data due later this week. At the same time, the report said tensions in the Middle East intensified, and after U.S. forces bombed an Iranian oil tanker, oil prices moved close to the $100 mark, adding to inflation concerns.
Other major tokens were mixed
Among other large-cap tokens, Solana (SOL) traded at $103.81, down 0.2%. XRP outperformed most major tokens, rising 1.44% to $1.4205. The report described price action among the top 10 tokens by market value as mixed, with investors largely staying on the sidelines.
Technical levels: BTC and ETH remain above key moving averages
Bitcoin
BTC closed its daily candle at $78,456. Its 14-day relative strength index, or RSI(14), was 60.1, placing it in a relatively strong zone. Price remained above the 20-day simple moving average at $78,438, the 50-day SMA at $69,995, and the 200-day SMA at $69,901. Still, MACD stayed in a bearish alignment and the histogram expanded, which the report described as weaker momentum.
On Bollinger Bands, Bitcoin’s close was near the mid-band at $78,438. Near-term resistance was listed at the upper band of $81,735 and the 30-day high of $82,300. Support levels were the 20-day SMA at $78,438, the lower Bollinger Band at $75,142, and the 50-day SMA at $69,995.
Ether
ETH closed its daily candle at $2,485. Its RSI(14) was 62.8, also in a relatively strong zone. Price held above the 20-day SMA at $2,460, the 50-day SMA at $2,128, and the 200-day SMA at $2,045, and it remained above the Bollinger mid-band at $2,460. MACD was also in a bearish alignment, with momentum increasing.
For Ether, resistance levels were the upper Bollinger Band at $2,553 and the 30-day high of $2,567. Support was listed at the 20-day SMA of $2,460, the lower Bollinger Band at $2,367, and the 50-day SMA at $2,128.
Fear and Greed Index slips to 66
Alternative.me data showed the Fear and Greed Index stood at 66 on Sept. 9, still in the “Greed” zone. That was down 3 points from 69 a day earlier, marking a second consecutive daily decline. Over the past eight days, the index ranged from 63 to 74, suggesting market sentiment has cooled gradually from its early-September peak.
The report said traders are now focused on this week’s U.S. CPI release, developments in the Middle East, and expectations for Federal Reserve interest rates. If oil prices continue to rise, inflation pressure could weigh again on risk-asset pricing.
The article said the report was compiled by BlockTempo using data from Binance, CoinGecko, Alternative.me, and CoinGlass.