

Bitcoin and Ether closed out the third quarter of 2026 with a strong rebound. According to Blockcast, Bitcoin rose from about $58,500 to the $83,000-$85,000 range in Q3, leaving its quarterly gain at roughly 42% to 43% depending on the closing point used in the calculation. Ether advanced from around $1,570 to near $2,686, for a quarterly rise of about 71%.
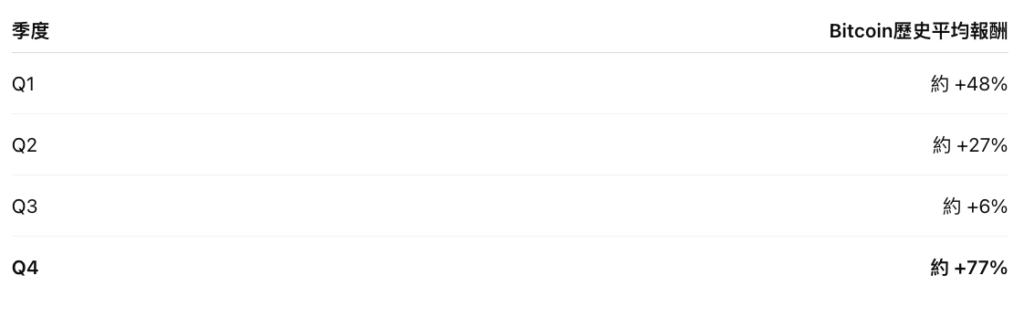
The move came after a volatile first half of the year and marked a clear return of capital to the crypto market. With Oct. 1 now here, attention has shifted to the fourth quarter. Historical data shows Q4 has long been Bitcoin’s strongest quarter on average, though Blockcast noted that elevated U.S. Treasury yields, oil prices, and geopolitical risk still leave open the question of whether that pattern will hold this time.
Bitcoin ends a three-quarter slide
CoinGlass historical data cited by Blockcast showed Bitcoin gained about 42.4% in the third quarter of 2026. Other calculations using different quarter-close timestamps put the increase closer to 43%. Either way, it was Bitcoin’s first positive quarter after three straight quarterly declines.
- 2026 Q1: -22.1%
- 2026 Q2: -14.2%
- 2026 Q3: about +42% to +43%
That made Q3 Bitcoin’s best quarter since Q1 2024, when it rose about 68.6%. The report said the third quarter is not usually Bitcoin’s strongest period. Historically, average Q3 gains have been only about 5% to 9%, well below the fourth quarter, which makes a rebound of more than 40% relatively unusual.
Ether outperformed with a roughly 71% quarterly gain
Ether’s rebound was even stronger. CoinGlass data cited in the report showed ETH started July at about $1,569.91 and was trading around $2,687 on Sept. 30, translating to a gain of about 71.2% for the quarter.
- 2026 Q1: about -29%
- 2026 Q2: about -25%
- 2026 Q3: about +71%
Even after that rally, Ether had still not fully recovered its first-half losses by the end of September, according to the report. Blockcast described the move as a major recovery of lost ground rather than a full break above previous highs.
ETF inflows returned in the third quarter
Blockcast said institutional capital returning to the market was an important part of the Q3 backdrop. U.S. spot Bitcoin ETFs recorded about $2.4 billion in net inflows during the last full week of September, one of the largest weekly inflow totals since October 2025. That also helped improve cumulative flows for the year after they had briefly turned negative.
Spot Ether ETFs also saw stronger demand. The report said U.S. spot ETH ETFs drew about $1.75 billion in August. In Blockcast’s account, the third-quarter rally was not driven only by high-leverage futures activity, as rising spot and ETF demand also supported BTC and ETH.
Q4 has the strongest historical seasonality, but not every year ends higher
One of the main market questions now is whether Bitcoin can follow its historically stronger fourth-quarter pattern. CoinGlass statistics cited by the report showed that since 2013, Bitcoin’s median Q4 return has been about +47.7%, well above other quarters.
Some of Bitcoin’s biggest rallies were recorded in Q4:
- 2013 Q4: +479.6%
- 2017 Q4: +215.1%
- 2020 Q4: +168.0%
- 2023 Q4: +56.9%
- 2024 Q4: +47.7%
That history is part of why October is often called “Uptober.” Still, the report stressed that seasonality should not be read as a guarantee of gains. Across the 13 full fourth quarters from 2013 to 2025, about eight ended higher and five ended lower. The losing years included Q4 2018, down about 42%, Q4 2019, down about 13%, Q4 2022, down about 15%, and Q4 2025, down about 23%.
Blockcast also noted that the 77% “average gain” is skewed by extreme bull-market years such as 2013 and 2017. On that basis, the median return of about 48% may give a better picture of a more typical year. In short, Q4 has historically been Bitcoin’s strongest quarter, but that does not mean this year must follow the same path.
PCE data eased rate expectations as Q4 began
The report said the latest U.S. Personal Consumption Expenditures price index for August rose 3.4% year over year, below the market expectation of 3.7%. Core PCE came in at about 3.0%, also below the expected 3.3%. That led the market to reduce bets on another Federal Reserve rate hike in October, and Bitcoin briefly moved higher.
At the time referenced in the report, Binance data showed BTC at about $83,795, with a 24-hour range of roughly $82,928 to $85,600. ETH was around $2,692, with a 24-hour range of about $2,657 to $2,737.
That left Bitcoin holding above the $80,000 level even after its Q3 surge of more than 40%, while Ether continued to trade near $2,700. From a technical standpoint, the report said the first issue for Q4 is not whether prices can immediately challenge record highs, but whether BTC can stay in the $80,000 to $83,000 area and whether ETH can establish itself above $2,700.
Three variables the market is watching in Q4
Blockcast said the fourth quarter may have favorable seasonal history, but whether this year can repeat past year-end rallies depends on three practical factors.
- ETF and institutional fund flows. After Bitcoin rebounded from about $58,000 to above $80,000 in Q3, sustained spot demand from institutions remains a key condition for any extension of the rally.
- U.S. interest rates and bond yields. A high-rate environment increases the appeal of cash and Treasuries and limits valuation expansion for risk assets such as BTC and ETH.
- Whether leverage overheats again. If futures open interest and funding rates rise quickly after the Q3 surge, the market could face long-side deleveraging pressure.
The report’s closing point was that the central question for Q4 is not simply whether Bitcoin usually rises in the fourth quarter. It is whether the capital that returned to crypto in Q3 will remain in the market through the rest of the year.