

A MarsBit market analysis by Benson Sun (@BensonTWN) says Bitcoin may be moving into more than just another bull market. In the author’s view, the current setup could be the start of a much larger one.
The call follows a striking week ending Aug. 22, when BTC jumped 24%. That rally sparked familiar debate over whether the market has already turned. Sun’s answer was direct: yes, and possibly on a bigger scale than many expect.
Bitcoin and gold strengthened together while the Nasdaq lagged
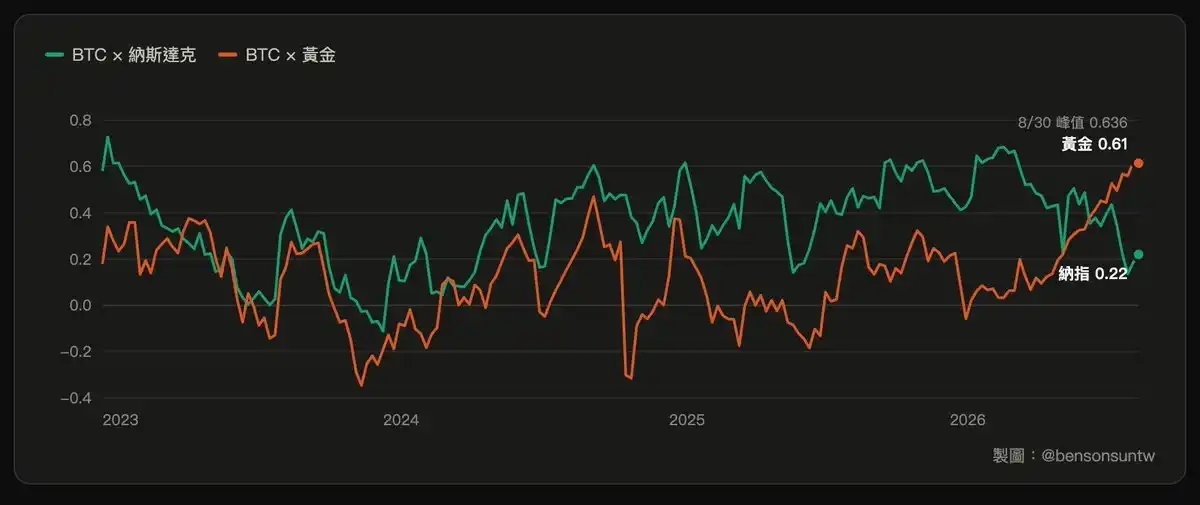
The article begins with what it describes as an unusual cross-asset pattern. During the same week that BTC surged, gold gained 5.6% and the Nasdaq fell 2.1%.
For years, Bitcoin has often traded like a high-beta tech asset. When U.S. equities moved into a risk-on phase, BTC typically rose with them. When liquidity tightened, Bitcoin usually dropped harder.
Sun argues that this time looks different. After Aug. 17, BTC and gold both turned stronger while the Nasdaq stayed largely flat.
From May, the 60-day correlation between BTC and gold climbed steadily and reached 0.636, close to the historical high of 0.64 recorded in November 2020. Its long-term median is only 0.12, according to the article. Over the same period, Bitcoin’s correlation with the Nasdaq fell to 0.13 before rebounding to 0.22.
A correlation above 0.5 with gold has appeared only rarely
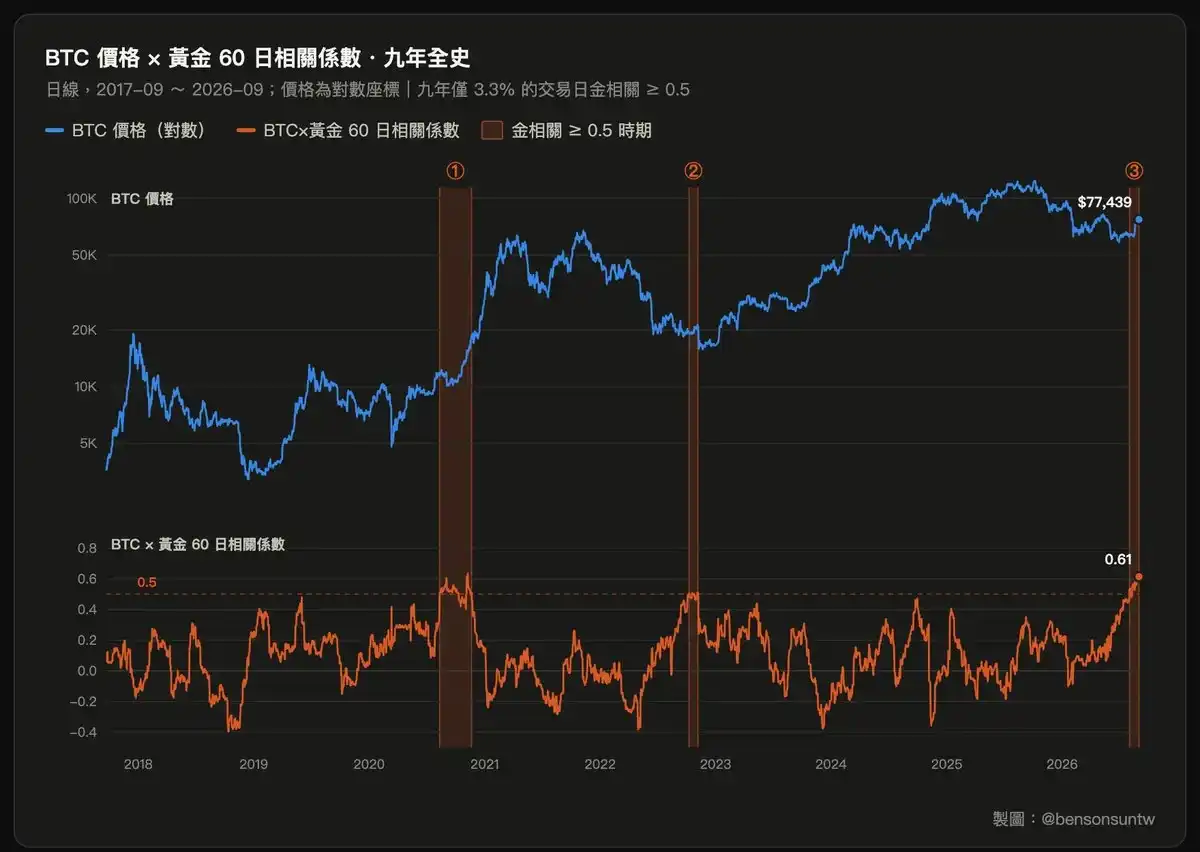
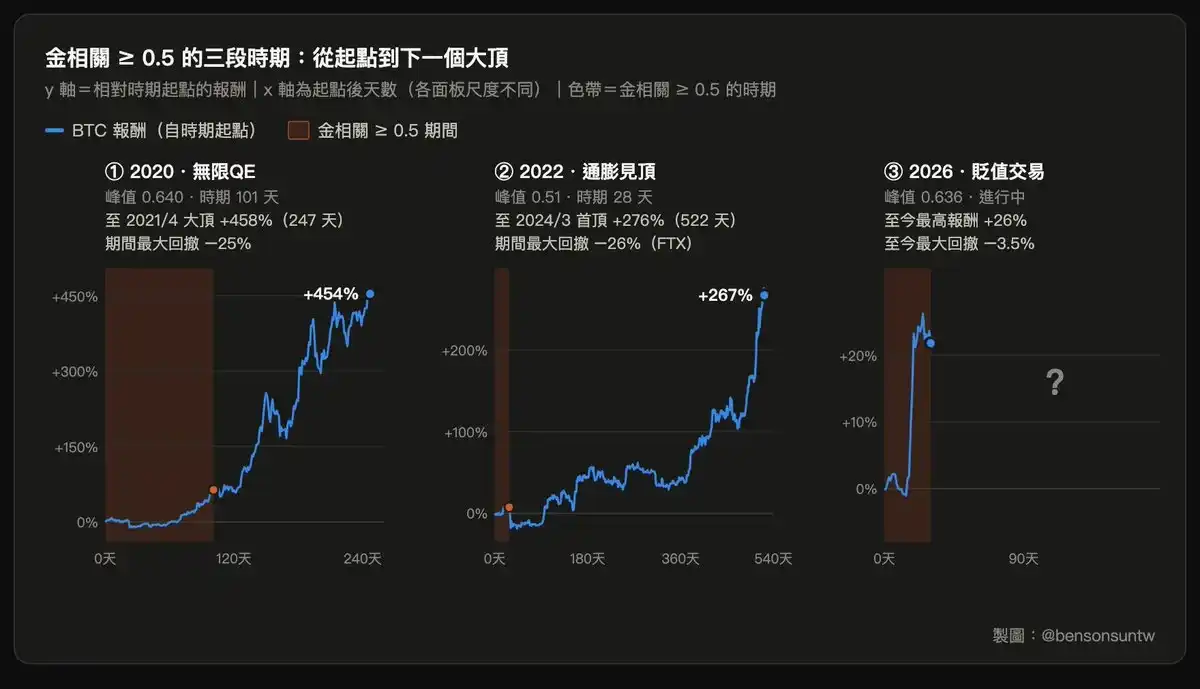
Sun says days when Bitcoin’s correlation with gold stands above 0.5 account for only 2.2% of all trading days since BTC began trading. Before the current stretch, that happened in only two periods: August 2020 and October 2022.
Looking back, the August 2020 episode came just before the main leg of a large bull run. Bitcoin was still moving sideways around $10,000 to $12,000, then broke above its prior high a few months later and eventually climbed to $64,000, producing a peak gain of 458%.
The October 2022 case was rougher. Bitcoin was building a base near $20,000, then the collapse of FTX in November pushed the price down to $15,700. Even so, Sun writes that October 2022 still sat in a long-term bottoming zone. Measured from that signal level to the later $73,000 peak, the maximum gain reached 276%.
He argues that the current market is now the third period in Bitcoin’s history with a high correlation to gold. If history rhymes, he says, this may be where the next bull market starts.
This cycle stands apart from the prior two
The article says the current structure differs from earlier cases in one important way.
In the 2020 episode, Bitcoin’s median correlation with the Nasdaq was still 0.44. That was the era of broad quantitative easing, when a wide range of assets were lifted by the same liquidity wave.
In the 2022 episode, BTC’s correlation with the Nasdaq was even higher than its correlation with gold, at 0.62.
This time, Sun says, Bitcoin’s correlation with gold has broken above 0.6 while its correlation with the Nasdaq has dropped below 0.25. He describes that combination as unprecedented.
If correlation shows which framework the market is using to price BTC, then among the three gold-linked periods, this one is the purest “anti-debasement hard asset” pricing structure, the article argues.
The author points to a repeated bottoming signal
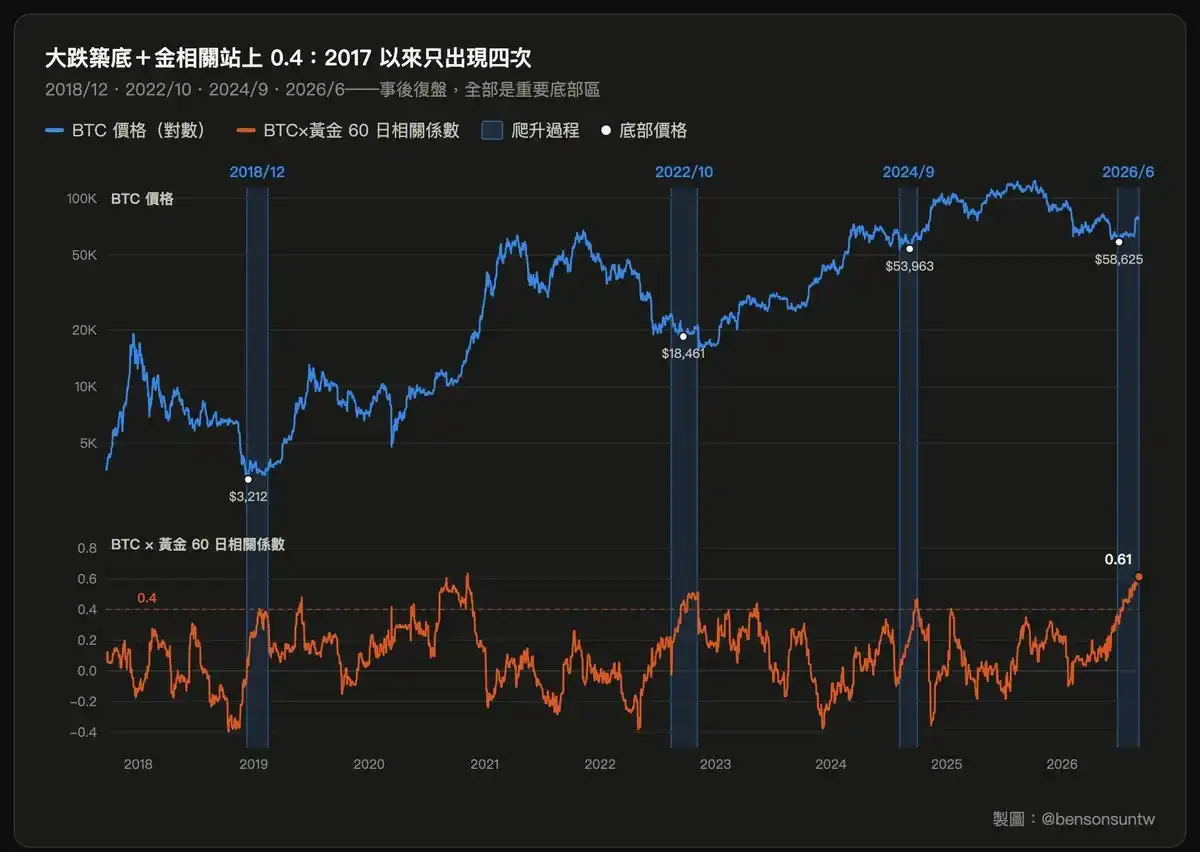
Sun also looks at how gold correlation behaves around cycle lows. He says that after Bitcoin falls more than 25% from a prior high, its 60-day correlation with gold has at times risen quickly from low levels and broken above 0.4. By his count, that happened four times: December 2018, October 2022, September 2024, and June 2026.
The first three signals all landed near major bottom zones in hindsight, according to the piece. On that basis, Sun says the $57,000 to $58,000 area could be the bottom zone for the current cycle if the same pattern holds again.
He notes the contrast in Bitcoin’s longer history. Despite the “digital gold” label, BTC’s long-term median correlation with the Nasdaq is 0.45, while its correlation with gold is only 0.12. In normal periods, the asset behaves far less like gold than its narrative suggests and much more like a highly volatile beta tech trade.
Sun’s explanation is that two groups of capital are active in Bitcoin and they treat it very differently. One group trades BTC as a high-risk growth asset. When that group dominates, Bitcoin stays tightly linked to the Nasdaq. The other group buys it as a long-duration hedge against fiat debasement.
During deep drawdowns, the shorter-term speculative money tends to leave first. As price falls into a bottoming area and supply gradually shifts into longer-term hands, the market’s dominant pricing logic changes with it. When more buyers start valuing BTC through the hard-asset lens, the digital-gold narrative returns and Bitcoin begins moving more closely with gold, the article says.
Karma Index is used as a cycle and sentiment gauge
Beyond correlation, the analysis brings in Karma Index to judge sentiment and cycle position.
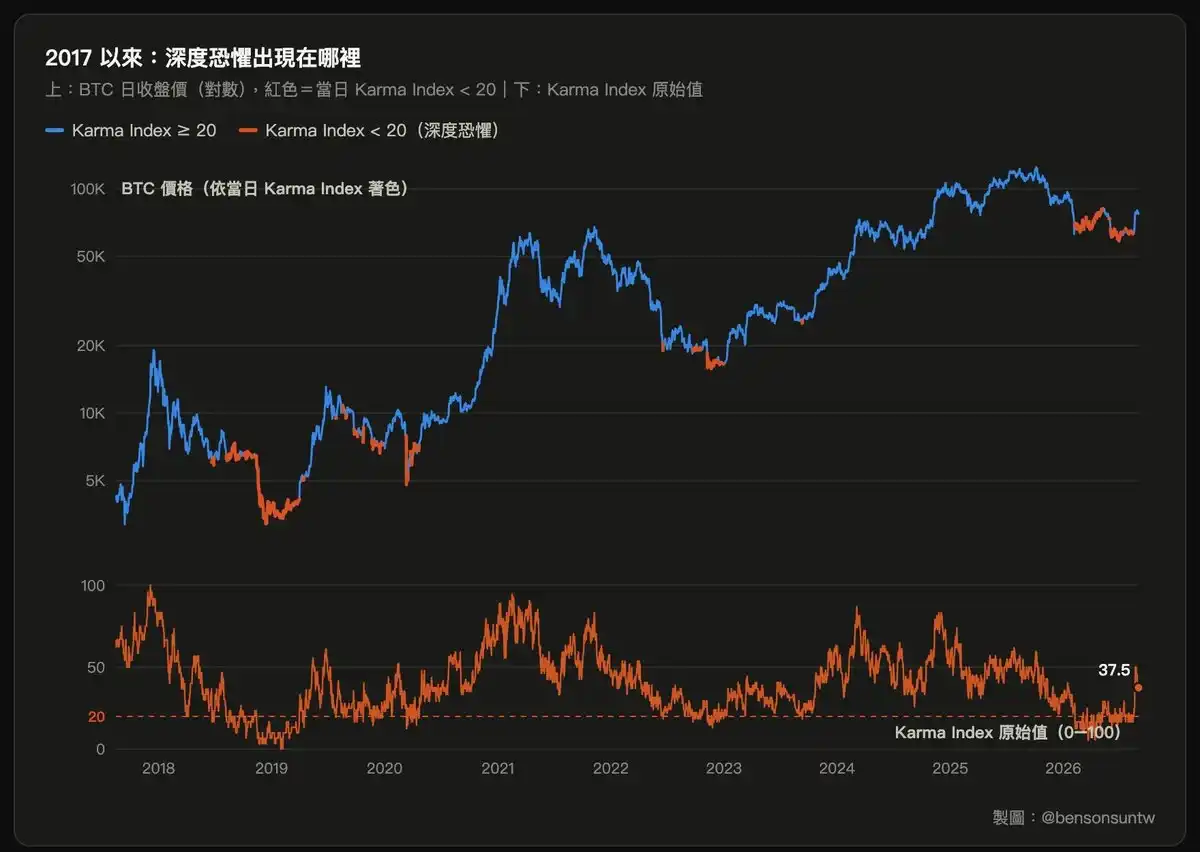
Sun describes Karma Index as a cycle indicator developed by CoinKarma. It combines nine dimensions, including market liquidity, funding rates, on-chain cost, app rankings, and search interest, into a 0-to-100 market thermometer. A reading above 80 indicates overheating, while anything below 20 points to extreme fear.
Before the latest rally, the index stayed depressed for an extended period and fell below 20 several times, matching the sentiment profile seen near important past bottoms, according to the article.
A 20% weekly surge alone was not enough in past data
Since 2017, Bitcoin has posted a weekly gain of more than 20% on 28 occasions including the current one, Sun writes.
Across the prior 27 instances, buying immediately after the breakout produced a median six-month return of only 3.6%. By comparison, choosing a random trading day over the same period delivered a median six-month return of 13.9%. On that sample, chasing a weekly move of more than 20% had no statistical edge.
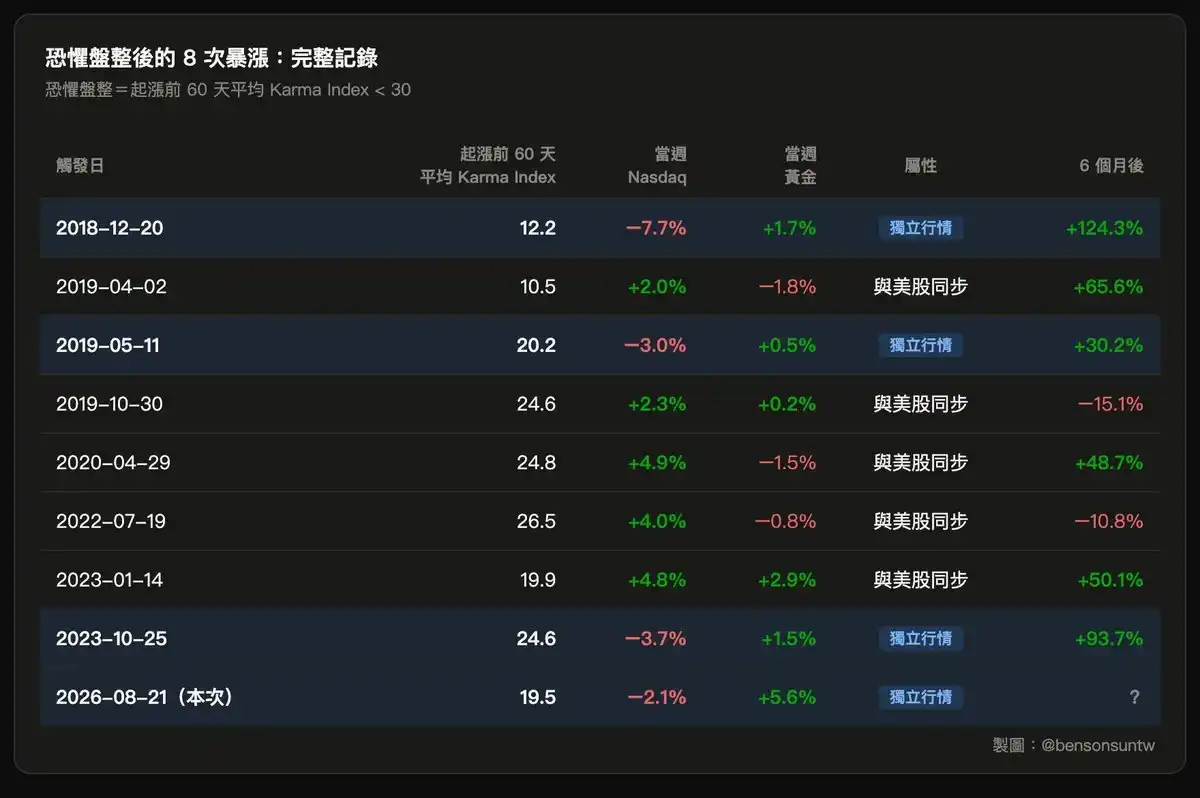
The picture changes when Karma Index is added. Restricting the sample to cases where the average Karma Index in the 60 days before the rally was below 30 leaves eight events. Among them, six were winners and two were losers, giving a 75% win rate. The median six-month return jumped from 3.6% to 49.4%.
Three earlier cases also detached from the Nasdaq
The Nasdaq filter made the result even more specific. Of those eight low-sentiment cases, only three occurred while the Nasdaq was not rising and Bitcoin still managed to post a weekly gain above 20%.
- December 2018: up 124.3% six months later
- May 2019: up 30.2% six months later
- October 2023: up 93.7% six months later
Sun says those three instances lined up with a bear-market floor, the start of a main uptrend, and the ETF bull market starting line. All three still showed positive returns six months later.
In the current case, the average Karma Index in the 60 days before the rally was only 19.5, the third-lowest reading among the nine low-sentiment samples that include this one. During the same period as Bitcoin’s breakout, the Nasdaq fell 2.1%.
That leaves the present move fitting what Sun calls a fourth historical example of “a large BTC surge after a long low-sentiment washout, while trading independently from the Nasdaq.”
Two signals, one conclusion in the article: early bull market conditions
The piece then combines the two frameworks.
First, Bitcoin’s linkage with gold has climbed to a level the author calls historically rare. In earlier periods, similar signals after a deep drawdown appeared near major bottoms.
Second, Karma Index suggests the washout has already gone far enough. In Sun’s historical sample, rallies that began after long stretches of depressed sentiment tended to produce much better follow-through than simple momentum chasing after a sharp weekly rise.
One indicator tracks cross-asset pricing. The other tracks sentiment and cycle position. Taken together, the author says both support the idea that Bitcoin is in the early phase of a bull market.
He adds that many traders now feel hesitant because Bitcoin spent so long in a bear market that expectations became anchored lower. During the previous stretch, U.S. stocks and gold kept rising while BTC drifted down, making every rebound feel like an exit chance rather than a fresh trend. In his reading, the relative-strength picture has changed over the last two weeks: Bitcoin is now outperforming not just equities but gold as well.
Sun points to late 2018 as an example. Many buyers started averaging in from $6,000 only to see BTC keep falling to $3,000, and some sold as soon as they got a partial recovery. In hindsight, he says, the more comfortable entry was the move from above $3,000 to $4,000. It was not the exact low, but it came with greater confirmation because the main uptrend was just beginning.
His conclusion is that the current setup looks similar. In the historical sample he cites, every case that combined high gold correlation, an independent move away from U.S. equities, and a Karma Index washout appeared near the start of a main bullish phase.
The macro backdrop in the article centers on debt, yields, and liquidity
Sun writes that previous Bitcoin bull cycles drew much of their fuel from the halving narrative and spillover from U.S. dollar liquidity. The digital-gold thesis surfaced each time but usually stayed at the level of a theme rather than becoming the core driver.
This cycle, he says, may be different.
The article notes that the 30-year U.S. Treasury yield recently touched 5.34%, the highest level since 2007. Higher yields mean investors demand greater compensation to lend money to the U.S. for longer periods.
It also states that the U.S. is carrying close to $40 trillion in debt. If rates stay elevated, refinancing maturing debt becomes more expensive, interest costs rise further, deficits widen, and the government needs to issue more debt.
Two dates are highlighted as signs of growing market sensitivity
The article says those debt-related concerns have been around for a long time, but the market has started reacting to them more quickly.
On Aug. 19, the U.S. Treasury announced that it would at least double the liquidity-support repo cap for long-dated Treasuries, according to the piece. After that announcement, long-end Treasury yields fell and both gold and BTC rallied sharply. Sun says the market interpreted the move as a sign that the Treasury was willing to inject liquidity to keep the long-bond market functioning normally.
Then came Sept. 4. The article says U.S. nonfarm payrolls rose by 162,000, far above the market expectation of 56,000, pushing the probability of a rate hike to as high as 65% at one point. Treasury yields rose quickly, the dollar strengthened, and U.S. stocks, gold, and BTC were all hit.
Sun argues that a payrolls report might not have triggered such a broad move a few months earlier. Now, in his reading, the market is watching the Federal Reserve, long-dated Treasury yields, and liquidity conditions far more closely.
Two possible paths for markets
From there, the article lays out two broad ways the U.S. debt issue could be traded across markets.
One is to grow out of it through AI. If productivity rises and corporate profits and economic growth outpace debt expansion, the debt-to-GDP ratio can decline over time. In the article, that path corresponds to AI stocks.
The other is to dilute the real value of debt through monetary expansion and inflation. That path maps to gold and Bitcoin in Sun’s framework.
He says markets have spent the last few years committing a large share of capital to the first path, the productivity revolution tied to AI. If investors start shifting more attention back to debt, liquidity, and the purchasing power of fiat currencies, trades built around protection from debasement could move back to center stage.
The issue is broad, he writes. Anyone globally who holds cash, government bonds, pensions, or fiat assets faces the same question: how much purchasing power will that money still hold in ten years? If markets begin to doubt that sovereign debt can keep expanding without persistent currency dilution, capital will look for assets with limited supply that cannot be issued at will. Gold is the traditional answer. Bitcoin, in his telling, is becoming another one.
Spot ETFs are presented as the regulated access point for larger pools of capital
The article closes by saying that even when institutions accepted Bitcoin as digital gold, they still had to deal with exchanges, private keys, custody, compliance, and accounting. Spot ETFs approved in the last cycle changed that access route in a practical way.
Asset managers, family offices, pension funds, and even ordinary brokerage accounts can now gain exposure to BTC through familiar financial instruments, Sun writes. The narrative is not new, but this cycle has added a compliant channel that can absorb larger allocations.
That is also why the current Bitcoin-gold synchronization matters more than it did in the prior two episodes, according to the article. Gold correlation is near a historically rare high while Nasdaq correlation remains low. In terms of its market behavior, Sun argues, this may be the closest Bitcoin has ever come to gold.
If the anti-fiat-debasement trade moves from being a recurring talking point in each cycle to becoming the market’s next central theme, the pool of capital available to Bitcoin would look very different. If BTC starts capturing global hedging demand tied to monetary credibility, sovereign debt, and declining purchasing power, Sun says the market could be looking at the largest wave of capital in Bitcoin’s history. Under that framework, what is visible now may only be the beginning of a much bigger bull run.