

This week, the market focuses on Bitcoin's weakening daily structure and whether HYPE's seven-wave rally has reached a terminal point. The following analysis walks through multi-timeframe structures, support/resistance channels, and specific trade plans, along with a review of last week's short trade execution.
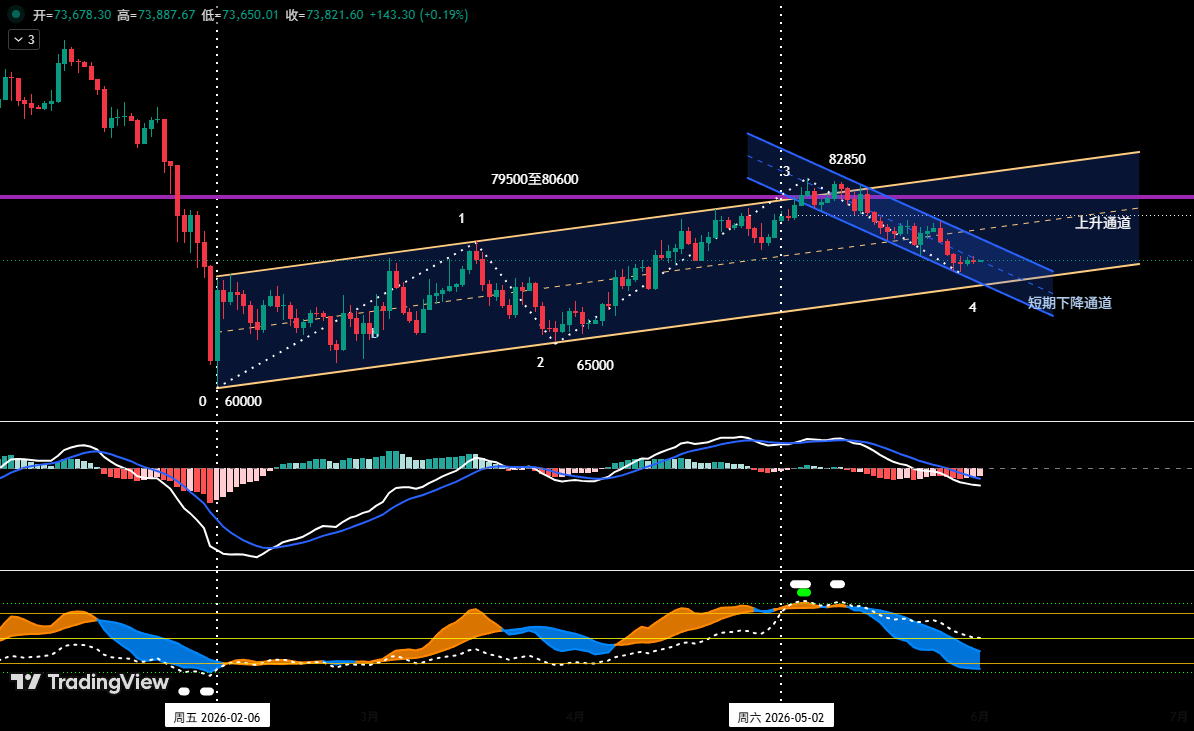
BTC Multi-Timeframe: Channels Broken, Rebound Faces Serious Resistance
Since its February 6, 2026 low, Bitcoin has traded within an ascending channel (yellow), with the lower trendline connecting the February 6 and March 29 lows, and an upper parallel drawn from the March 17 high. However, price has lost the channel's midline and is now seeking support at the lower boundary. Simultaneously, a short-term descending channel (blue) has formed since the May 6 high at 82,850 USD, with the upper trendline linking the May 14 and May 26 peaks and the lower line from the May 7 and May 23 troughs. Price found temporary support near 72,500 USD and is now staging a weak rebound toward the blue channel's upper line.
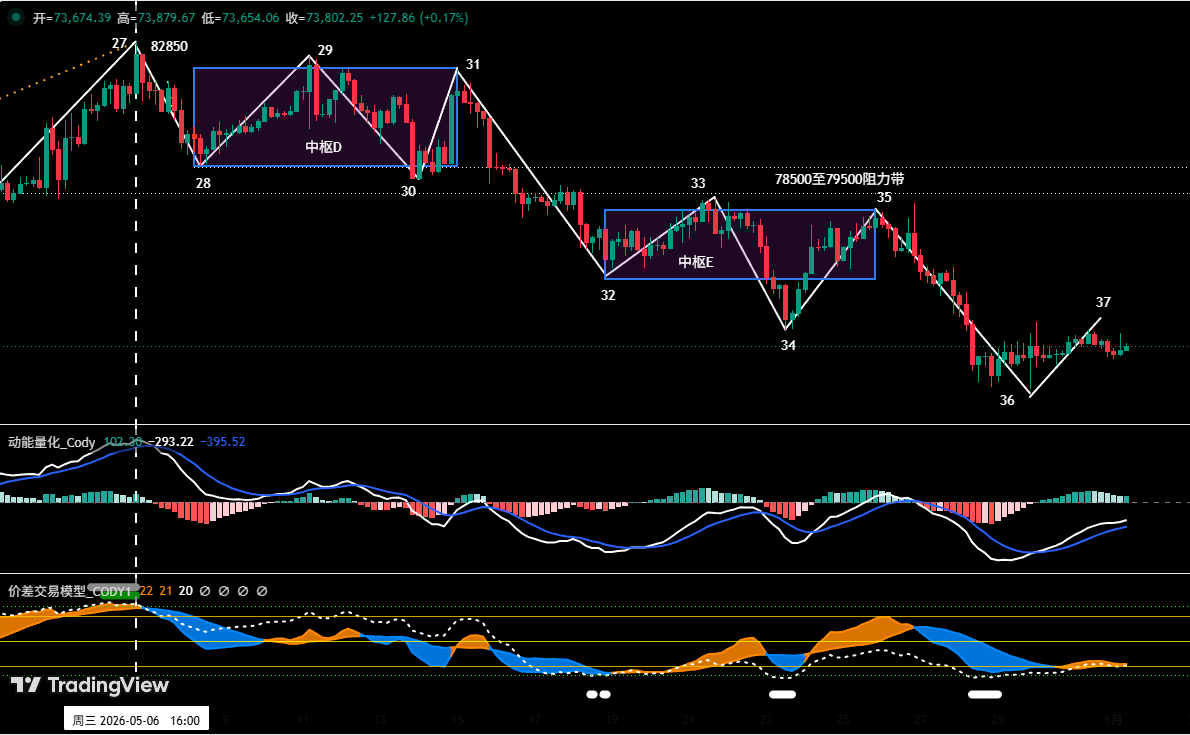
On the 4-hour chart, the correction from 82,850 USD has unfolded into a 10-segment structure with two consolidation zones. Central zone D formed from the overlapping segments 28-29, 29-30, 30-31; zone E from 32-33, 33-34, 34-35. The current segment 36-37 is a rebound. If price stalls in the 75,000-76,000 USD area (near the lower edge of zone E), the market will likely continue its downward oscillation, testing the 69,500-70,500 USD zone and even 65,000 USD. The second resistance area lies at 78,500-79,500 USD.
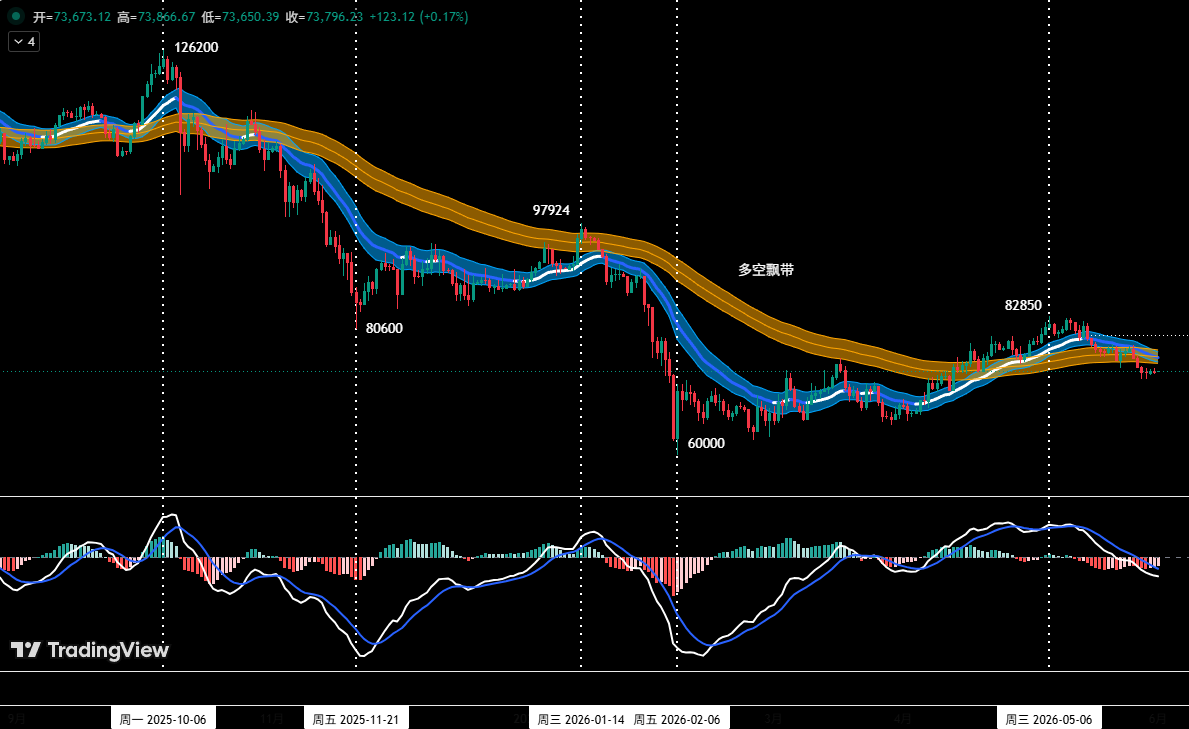
BTC Trade Plan: Sell Rallies with Strict Risk Control
This week's short-term approach remains selling rallies. Use 30% of position capital to target key price zones. Plan A: On a rebound to 75,000-76,000 USD with top signals from quantitative models, initiate a short position up to 30% with a stop loss above 77,000 USD, and take profits near support. Plan B: If price breaks below 69,500-70,500 USD with model confirmation, also short with a stop above 72,000 USD, following the same exit logic.
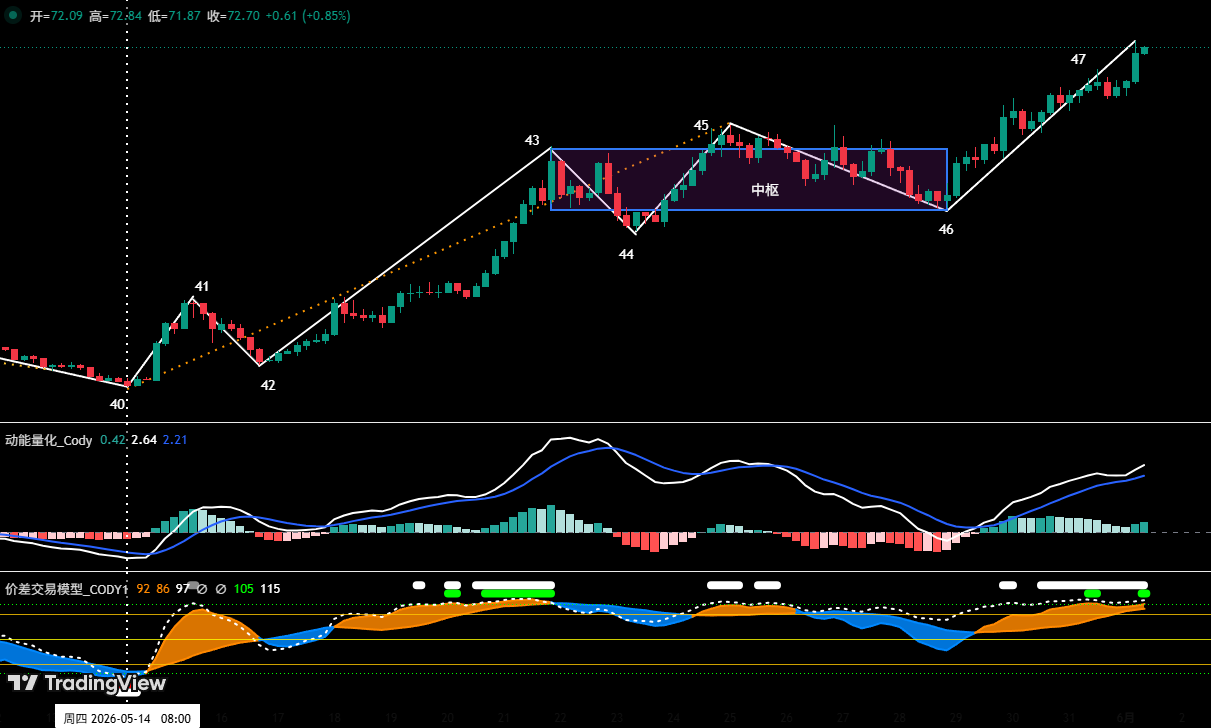
HYPE Seven-Wave Rally Nears Exhaustion, Top Signals Intensify
On HYPE's 4-hour chart, the advance from the May 14 low at 38.14 USD shows a clear seven-wave structure (40-41 to 46-47). Segments 43-44, 44-45, and 45-46 overlapped to form a running consolidation. Endpoint 45 already exhibited momentum divergence and a top warning from the price differential model, leading to a drop from 64.75 USD to 56.30 USD—a maximum decline of 13.05%. The current wave 46-47 shows weaker momentum compared to the entry wave 42-43, indicating potential momentum divergence. The proprietary price differential model has triggered a strong top signal (red+white dots) at endpoint 47. If price subsequently breaks below the 62.5-64.57 USD support zone, endpoint 47 will likely be confirmed as the peak of the rally since May 14.
HYPE Short-Term Strategy: Light Longs with Tight Stops
The approach is to buy on dips and avoid chasing rallies. Focus on the 62.5-64.75 USD zone: if price pulls back to this area and forms a bottoming signal with confirmation from both models, a long position of less than 30% can be considered. Should price break decisively below this zone, the correction escalates to a daily-level adjustment, with a downside target of 54-56.3 USD.
Last Week's Short Trade Review: 5.07% Profit
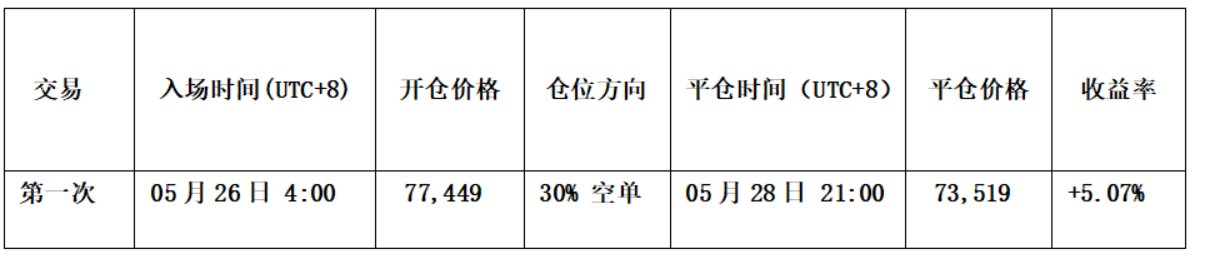
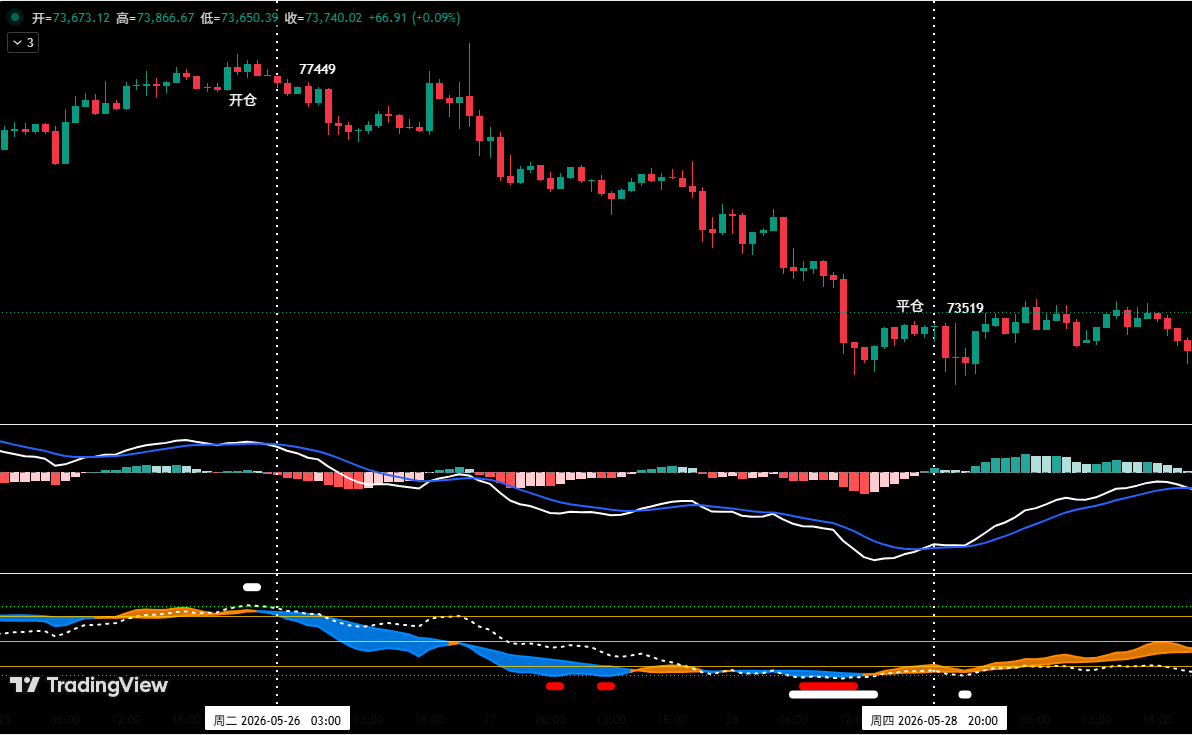
Based on the price differential model and momentum quantitative model, one short trade was executed last week. Entry: price rebounded to near 78,000 USD with a bearish engulfing pattern, the differential model triggered a white-dot top warning, and the momentum model showed divergence—a 30% short was opened at 77,449 USD. Exit: near 73,000 USD, a bullish engulfing pattern formed, and both models issued bottom resonance signals, leading to a full close at 73,519 USD, netting approximately 5.07% profit.

Risk management rules: set a stop-loss immediately upon entry. Move stop to breakeven after a 1% gain; move it to lock in 1% profit after a 2% gain. Then trail the stop by 1% for each additional 1% gain. Markets are volatile; all views are personal trade logs and do not constitute investment advice.