

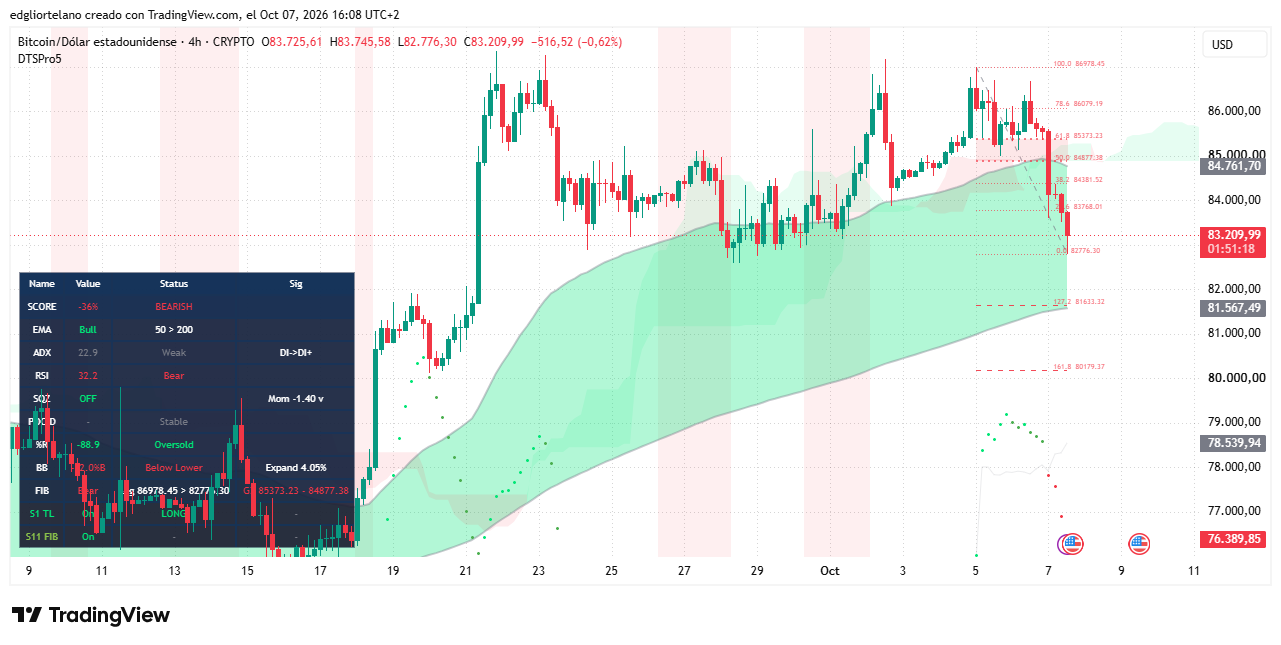
Bitcoin sold off early Wednesday, opening at $85,543.66 before falling to as low as $82,776.30. It was last trading at $83,178.54 after a fast move lower that briefly put a key support area under pressure.
The 3.2% drop hit leveraged traders hard. CoinGlass data showed about $969 million in crypto positions were liquidated over the past 24 hours, including $644.47 million in long positions.
Oil, yields and equities moved together
Decrypt framed the decline as part of a broader macro selloff rather than a crypto-specific event. In morning trading, the S&P 500 fell 0.59% to 7,772.60, while the Nasdaq dropped 0.71% as Wall Street pulled back from record highs.
Oil was at the center of the move. Brent crude climbed back above $101 a barrel. At the same time, the 10-year U.S. Treasury yield was near 5.34% and the 30-year yield reached 5.70%, its highest level since 2002. Gold, often treated as a safe-haven asset, also fell 1.53% to $4,123.10.
According to the report, oil prices have been rattled by repeated ship attacks in and around the Strait of Hormuz. Al Jazeera, citing the UK Maritime Trade Operations agency, said at least one such incident has been logged each day in the strait or the Gulf of Aden since October 2.
On Monday, Iran’s Revolutionary Guard ordered a tanker entering the strait to turn around or face the risk of attack. Higher oil prices can intensify inflation concerns, lift bond yields and weigh on risk assets such as Bitcoin.
Decrypt also pointed to a similar episode in June, when Bitcoin fell to $65,590 as Brent rose to $96 on Middle East tensions. Even after the latest drop, Bitcoin remains about 40% above the roughly $59,500 level seen in late June.
Markets were also watching for minutes from the Federal Reserve’s September 15-16 meeting, which Decrypt said added to the nervous tone.
Four-hour weakness, daily trend still intact
On the technical side, the four-hour chart showed Bitcoin getting rejected near $86,978.45 before the slide began. The price later bounced after dipping below $83,000, giving traders some sign of support in that area.
Measured across that decline, the key Fibonacci retracement levels on the intraday chart sit at $83,768.01 and $84,877.38. Decrypt said both are now acting as resistance.
The Relative Strength Index, or RSI, on the four-hour timeframe stood at 32.2. That reading points to an oversold market in the short term after the sharp drop. Decrypt described it as bearish momentum for intraday trading, while also noting that bargain buyers often start to appear in this zone when they are looking at longer timeframes.
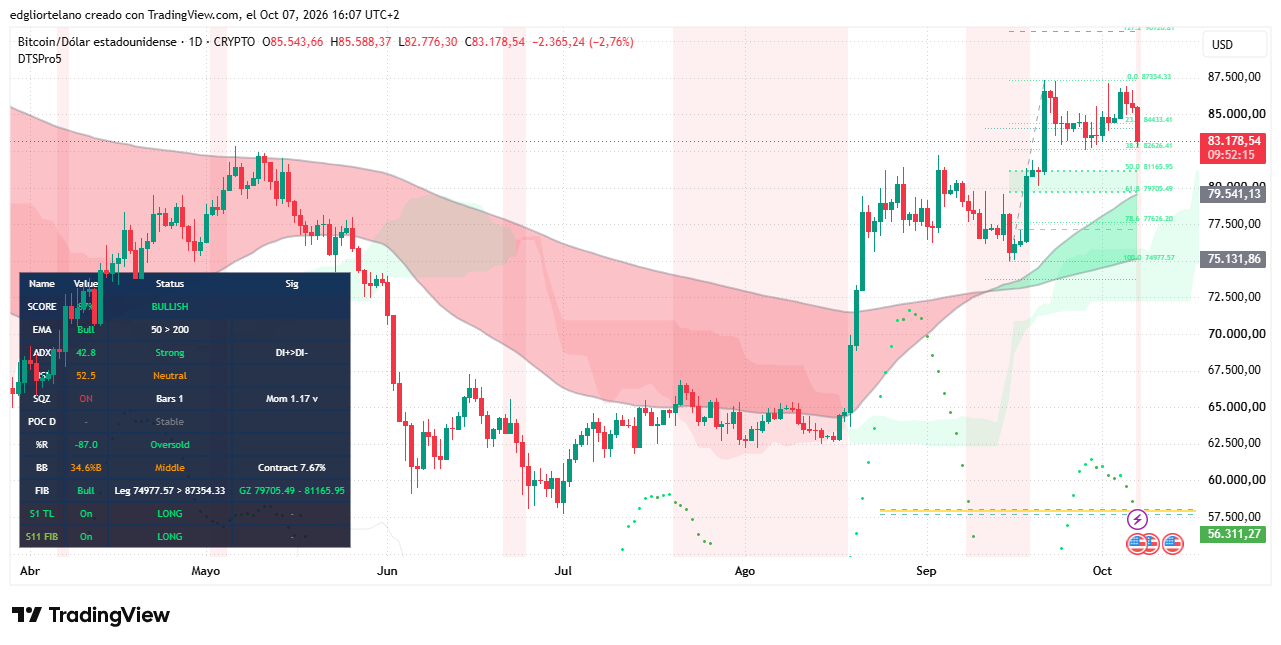
On the daily chart, the Average Directional Index, or ADX, was 42.8, which the report described as a strong bullish trend with buyers still ahead of sellers. Daily RSI came in at 52.5, a neutral reading that suggests the larger trend has not taken much damage from the latest selloff.
Exponential moving averages, or EMAs, also remained supportive on the broader trend. The 50-day EMA stayed above the 200-day EMA on both the daily and four-hour charts, a setup that usually indicates the wider uptrend is still in place. The daily squeeze remained active, with a momentum reading of 1.17 that was slipping, meaning volatility was still compressed.
The intraday low of $82,776.30 also held about $150 above the Fibonacci retracement around $82,626.41.
Macro started the move, leverage amplified it
As oil and Treasury yields rose, stocks, gold and Bitcoin all sold off together. That alignment, Decrypt argued, suggests the pressure did not originate inside crypto alone.
The report said macro conditions lit the fuse, while leverage fed the fire. When prices fall, exchanges force-close leveraged positions that can no longer cover losses. Those liquidations add more selling and can push prices lower again.
Prediction market points to lower levels this month
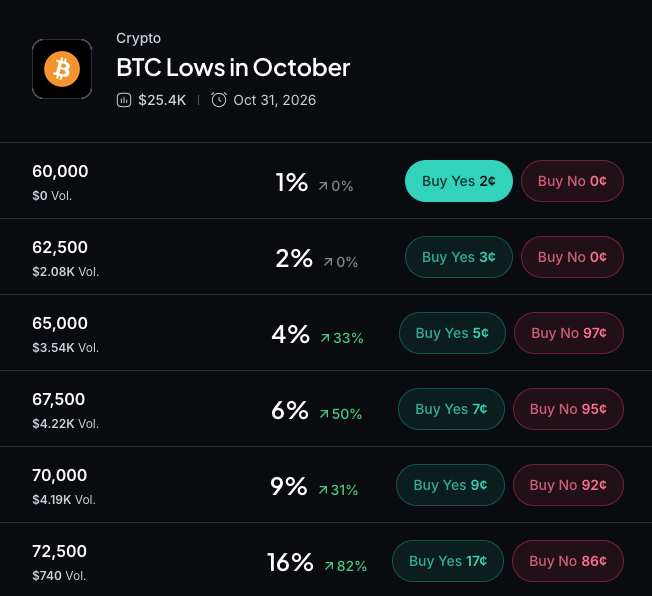
Traders on Myriad, a prediction market developed by Dastan, the parent company of Decrypt, were already pricing in the chance of more downside. At the time of writing, the BTC lows in October market assigned a 92% probability that Bitcoin touches $82,500 this month, a 67% probability for $80,000 and a 43% probability for $77,500.
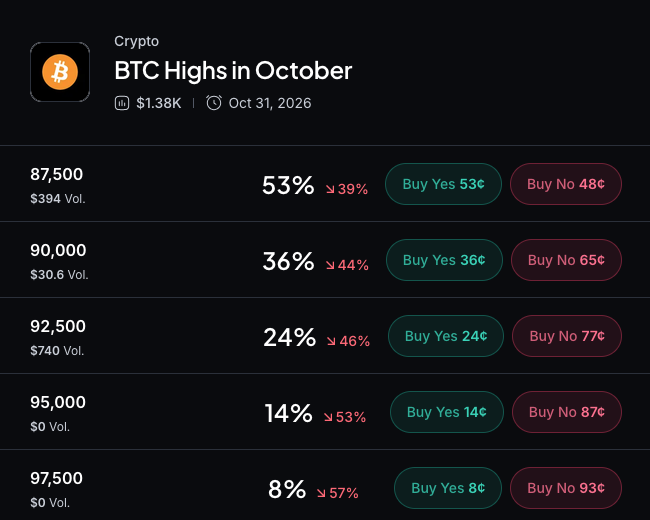
Upside pricing was more restrained. The BTC highs in October market showed 55% odds of a touch at $87,500 and 36% odds for $90,000. Decrypt noted that both markets settle on Binance touches rather than closes, meaning a drop and a rebound could both resolve as yes within the same month.
Levels traders are watching next
For bulls to argue the dip is over, Bitcoin needs to reclaim $84,761.70, the top of the four-hour trend band, and then retake the $84,877.38 retracement level.
If $82,776.30 breaks, the next levels Decrypt highlighted are the bottom of the four-hour band at $81,567.49 and the daily 50% retracement at $81,165.95. The report said the next catalysts to watch are the Fed minutes and any new headlines tied to the Strait of Hormuz.
The views and opinions in the original article were presented for informational purposes only and did not constitute financial, investment or other advice.