

A guest analysis published by MarsBit says Bitcoin has continued the rebound structure that began from the July 1 low. On the daily chart, BTC has already traced out a seven-leg advance and completed the first upward consolidation zone, referred to in the report as Zone A. After confirmation of "endpoint 5," the market entered a correction-and-rebound phase. Combined with top signals and overbought readings from the author’s quantitative models, the report argues that Bitcoin is likely to spend the next two to three weeks in a high-level trading range while building a second upward consolidation zone, Zone B.
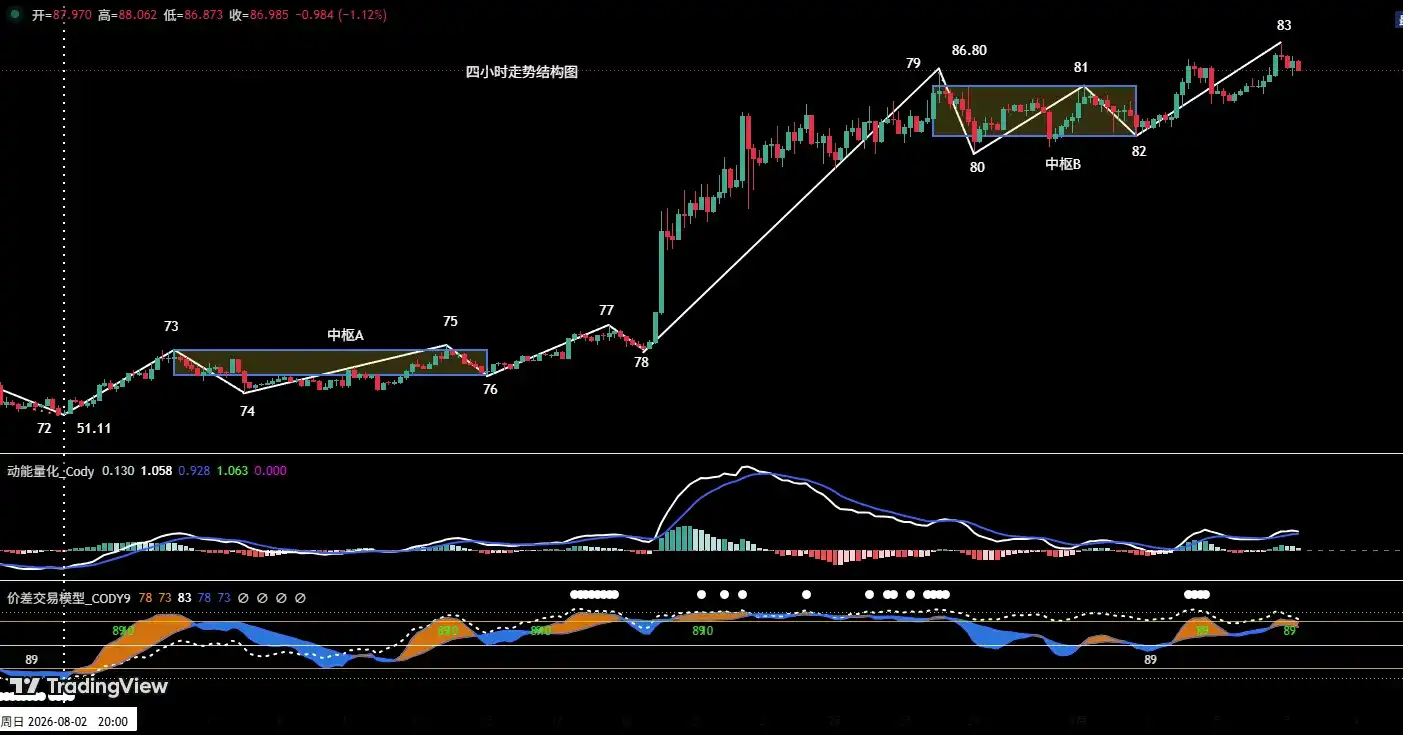
The report also focuses on HYPE. On the 4-hour chart, the rally that started from the August 2 low of $51.11 has extended into the departure leg of a second consolidation zone, Zone B. The next step, according to the analysis, is to compare the strength of that departure leg with the entry leg. If momentum divergence appears, the probability that the current advance has ended would rise sharply. The article adds that technical indicators are already showing overbought conditions, making momentum chasing at current levels a risk.
The analysis also reviews a BTC short-term trade from last week. Following a pre-set plan, the team completed one short-term long using 1x leverage and booked a return of about 4.45%. The article says that trade served as a live-market validation of signals generated by the "spread trading model" and the "momentum quant model" when the two aligned.
BTC daily structure points to completion of the first consolidation zone
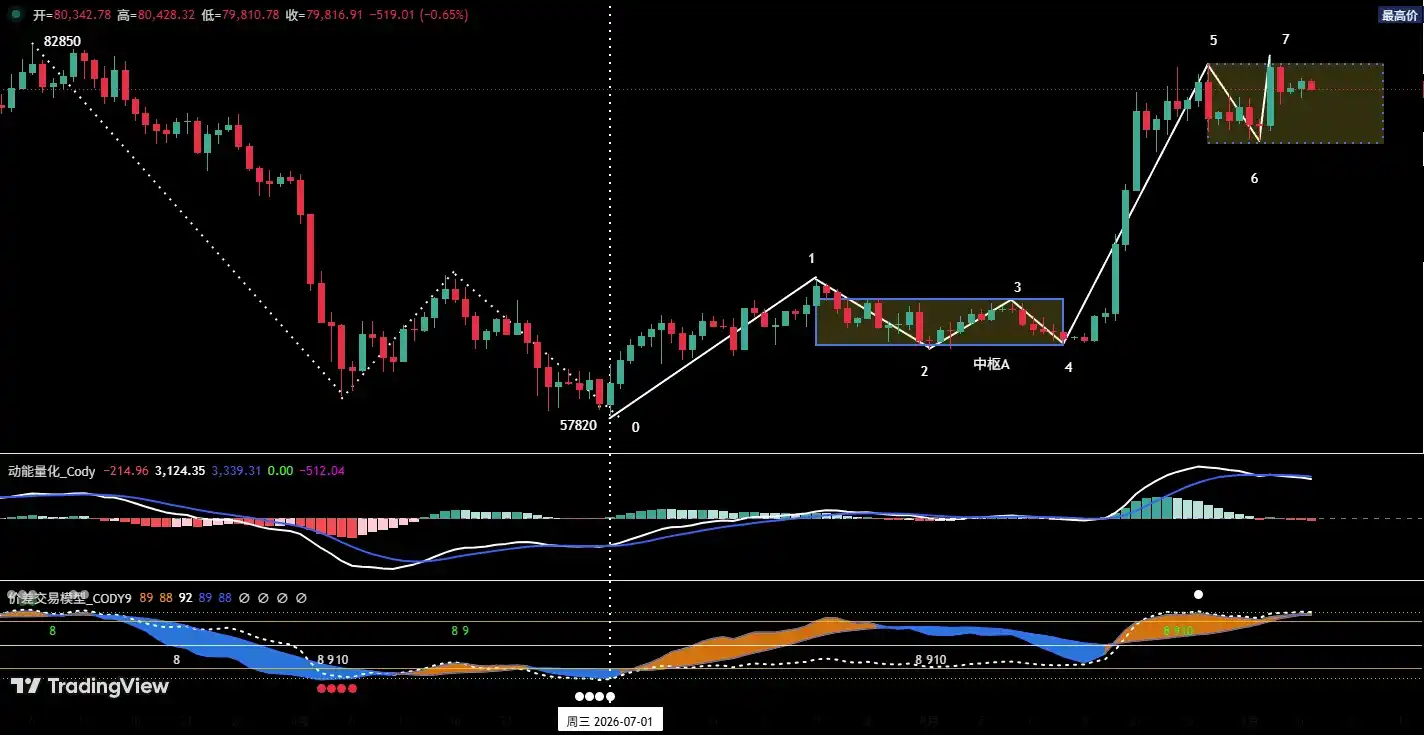
The piece says the previous weekly note introduced a Chan-theory framework to break down BTC’s rebound from the July 1 low of $57,820 and to identify its core consolidation zone. This week’s note continues under the same framework, examining the internal structure of the move through price action, zone evolution, and momentum divergence.
Based on the chart in the article, Bitcoin’s rebound from the July 1 low has formed a clear seven-leg structure, from (0-1) through (6-7). Within that move, segments (1-2), (2-3), and (3-4) overlap and form the first upward consolidation zone, Zone A. The upward departure leg, labeled (4-5), is described as having ended around $81,500.
The report makes three main observations around Zone A:
- The rebound strength of departure leg (4-5) was clearly stronger than that of entry leg (0-1), and no momentum divergence appeared between the two.
- According to the author’s in-house models, the dual signal lines of the "momentum quant model" formed a death cross, while the "spread trading model" simultaneously triggered a top warning, marked by white dots on the chart. The report interprets that alignment as a sign that the market has entered overbought territory.
- After "endpoint 5" was confirmed, the market moved through correction leg (5-6) and into the rebound leg (6-7), which is still described as in progress.
Taking those points together, the article argues that Bitcoin is likely to move into a high-level sideways pattern lasting two to three weeks from "endpoint 5." It says bulls may use broad range-bound trading to wash out profit-taking built up during the earlier fast rise, while a second upward consolidation zone, Zone B, gradually forms inside the box range. Once Zone B is completed, the report says, BTC may be able to launch another move away from that zone.
BTC outlook for the week centers on where "endpoint 7" finishes
For this week, the core view in the report is that Bitcoin is more likely to trade inside a box range, with close attention on where daily-chart "endpoint 7" eventually terminates.
The article lists the following resistance levels:
- First resistance zone: $81,700 to $82,850
- Second resistance zone: around $84,500
- Third resistance zone: around $90,000
It lists the following support levels:
- First support zone: $73,500 to $75,000
- Second support zone: $67,300 to $69,100
Medium-term positioning remains flat
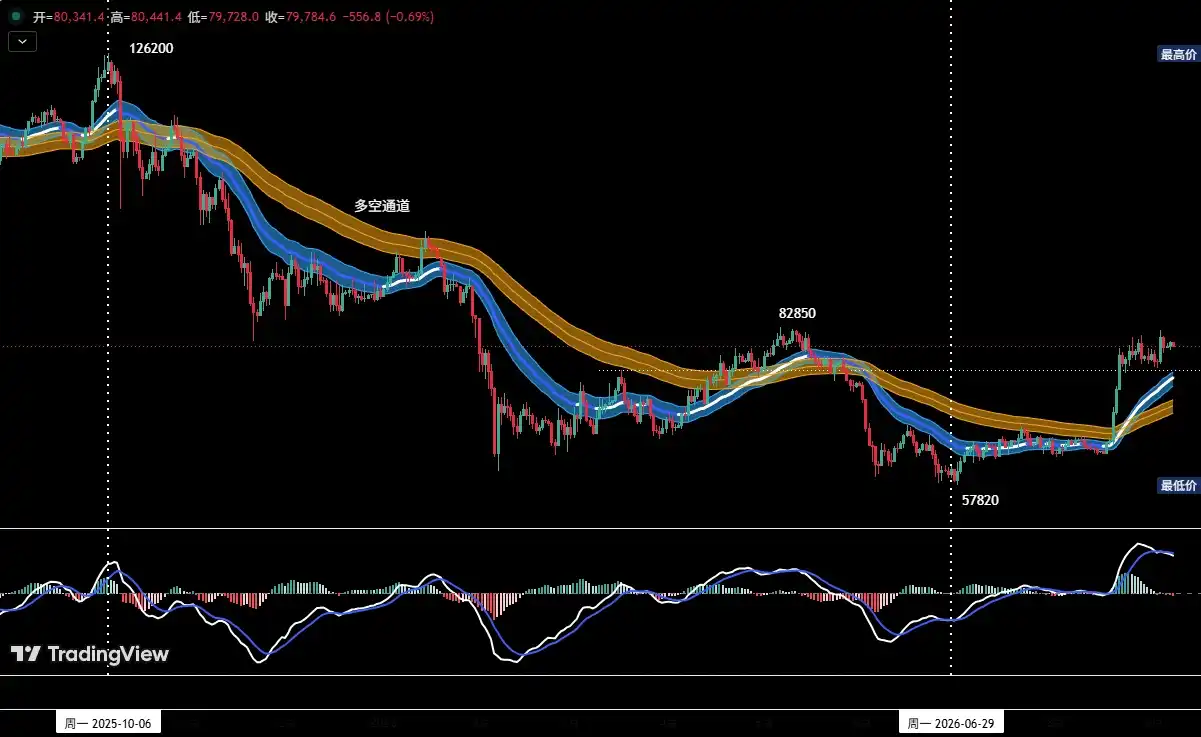
On the medium-term side, the report says a position-monitoring model shows that BTC has already broken through a bull-bear channel, changing the short-term market structure. Still, the pullback-and-confirmation phase after that breakout has not been completed, and the validity of a trend reversal remains unconfirmed. Because the signal sequence is not yet complete, the author says medium-term positioning stays at zero exposure for now.
Short-term plan uses support and resistance to trade spread opportunities
For short-term trading, the article suggests using 30% of capital with a stop-loss in place, looking for spread-trading opportunities around support and resistance on 30-minute and 60-minute timeframes.
To handle changing market conditions, the report outlines two scenarios:
- Plan A: test a light long near strong support. If BTC falls back to the first or second major support zone, forms a clear stabilization pattern, and the quantitative models issue a bottom signal at the same time, a long position of around 30% can be opened. An initial stop-loss should be set. If price rebounds toward a major resistance zone and model signals align, the position can be reduced and closed gradually for profit.
- Plan B: test a light short near strong resistance. If BTC rises into a key resistance level, shows clear rejection, and the quantitative models issue a top signal, a short position of around 30% can be opened. An initial stop-loss should be set. If the market then pulls back toward a major support zone and model signals align, the position can be closed gradually.
HYPE 4-hour structure puts the second zone’s departure leg in focus
The report says this week’s note also applies the Chan-theory framework to HYPE, breaking down the rebound that began from the August 2 low of $51.11.
On the 4-hour chart, the rise from that low is described as an 11-leg advance, spanning from (72-73) to (82-83).
For the first upward consolidation zone, Zone A, the article says segments (73-74), (74-75), and (75-76) overlap to form the structure. In the report’s strength comparison, the departure leg from Zone A, labeled (78-79), was stronger than the entry leg (72-73), and no momentum divergence appeared. On that basis, the author says that after segment (78-79) ended, HYPE still had room to move higher after a phase of consolidation.
The second upward consolidation zone, Zone B, is formed by the overlap of segments (79-80), (80-81), and (81-82). In that structure, (78-79) serves as the entry leg and (82-83) serves as the departure leg. The report says price is now in the middle of departure leg (82-83), making the next strength comparison especially important.

If the departure leg ends with momentum divergence relative to the entry leg, the probability that the rally from "endpoint 72" has finished would rise materially, according to the analysis. If no divergence appears, the article says HYPE may continue its existing uptrend after a period of consolidation and could print new highs.
HYPE strategy for the week: raise stops on existing longs, wait for pullbacks if flat
For the week ahead, the article places HYPE’s main resistance around $100. The key support areas are listed at $83 to $85 and $77 to $80.
The central point to monitor remains the finishing location of Zone B’s departure leg, (82-83), and whether its final strength shows momentum divergence when compared with entry leg (78-79).
The short-term strategy section offers three practical points:
- For traders already holding longs opened in the $50 to $52 area under an earlier plan, the article suggests moving the initial stop-loss up to around $80 to lock in gains while staying with the position.
- For traders with no position, if price pulls back into the $83 to $85 support zone, stabilizes effectively, and then generates a clear long signal, the article says a light long can be considered, with a stop-loss set and followed strictly.
- As a risk note, the report says the recent continuous rise has built up a heavy profit-taking base and several technical indicators are now in overbought territory. It warns against chasing the move at current levels and flags the risk of a short-term pullback.
BTC trade review: one 1x leveraged long returned about 4.45%
The article says that from 08.31 to 09.06, the team followed its trading plan and acted on signals from the in-house "spread trading model" and "momentum quant model" to complete one short-term BTC long trade, with total profit of about 4.45%.
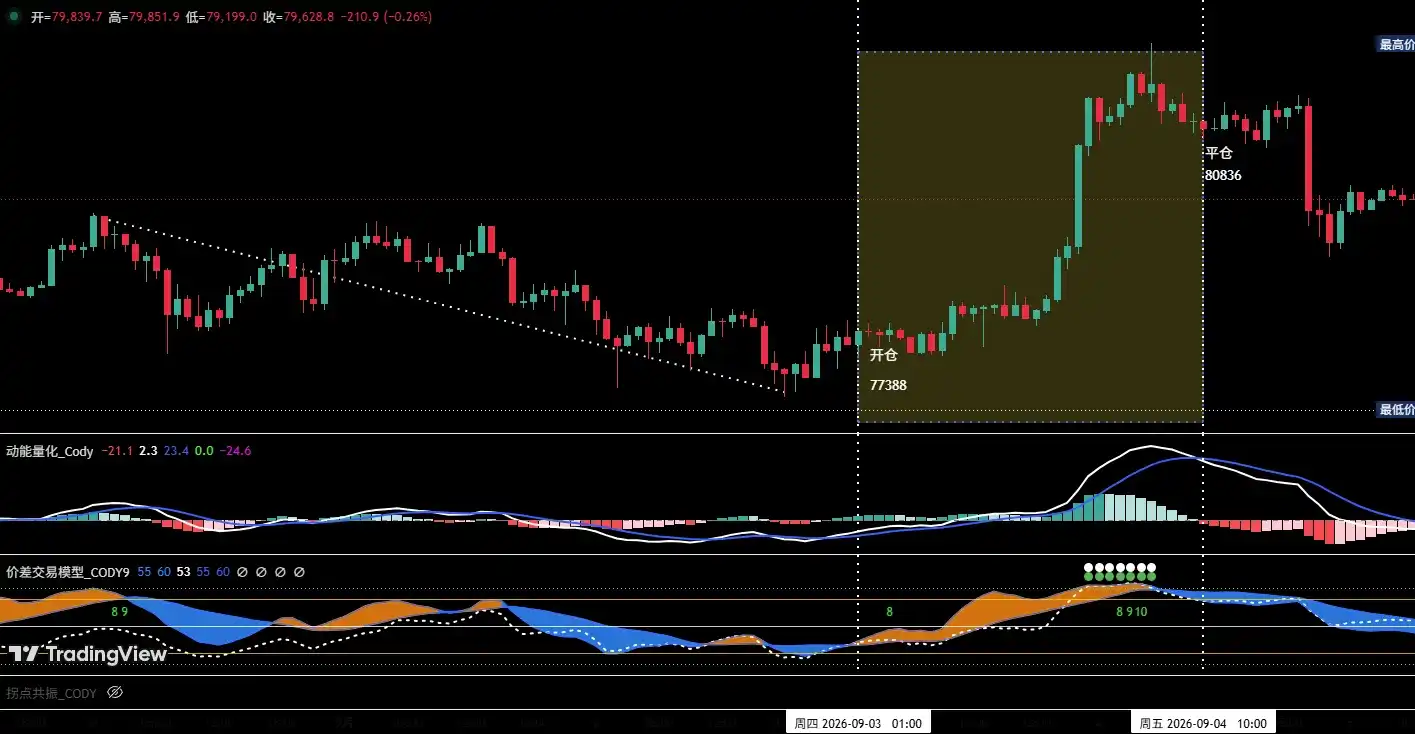
The opening logic had two parts. First, BTC had already completed a full pullback structure, and when price moved down to an area above $76,000, it began to show signs of stabilization, with candlesticks forming a bottom pattern. Second, the "momentum quant model" generated a bullish bottom divergence signal, aligning with a bottom-up signal from the "spread trading model." On that multi-factor confluence, the report says a 30% long position was opened at $77,388.
The exit logic also had two parts. First, when BTC approached $82,850, the article says the market began to stall and candlesticks formed a top pattern. Second, the "spread trading model" produced repeated top warnings, shown by white and green dots, after which the blue signal band crossed below the green skyline and aligned with the "momentum quant model" in a top signal. On that basis, the team closed the entire position near $80,836.
The review section sums up the result in one line: the trade delivered about 4.45% in profit.
Final notes: stop-loss rules move higher as profit expands
The article closes with several trading rules:
- Set an initial stop-loss immediately after opening a position.
- When profit reaches 1%, move the stop-loss to the entry price, or break-even.
- When profit reaches 2%, move the stop-loss to the level that locks in 1% profit.
- After that, for every additional 1% rise in profit, move the stop-loss up by 1% as well to protect and lock in gains dynamically.
The author also says financial markets change quickly and all market analysis and trading strategies need to be adjusted dynamically. The article states that all views, models, and trading plans discussed are part of personal technical analysis and a personal trading log, and do not constitute investment advice or a basis for trading decisions. It ends with a standard risk reminder that markets carry risk and readers should act with caution.