
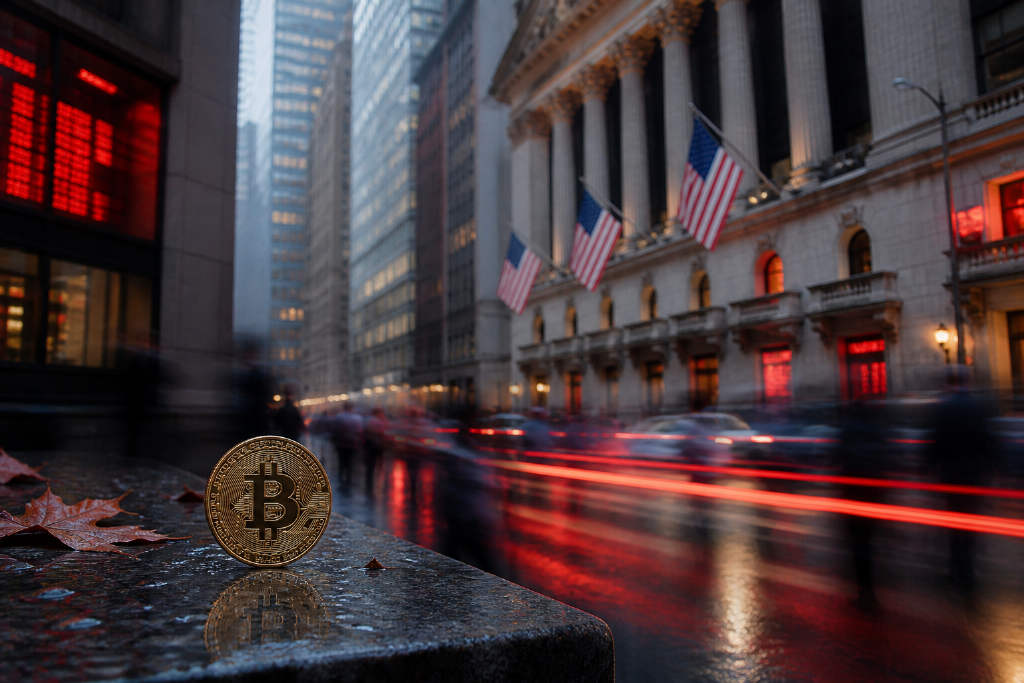
Bitcoin did not create the “Red September” curse, but it has clearly joined it.
According to Decrypt, citing monthly return data tracked by CoinGlass, Bitcoin has finished September lower in eight of the 13 completed years since 2013. That gives the month a 38.5% win rate for BTC, with an average return of -2.97% and a median return of -2.44%. The negative median matters because it shows September weakness is not just the result of a few outsized selloffs dragging down the average. A typical September has often been negative too.
Why traders keep talking about Red September
In crypto markets, traders use “Red September” as shorthand for a recurring seasonal slump. Decrypt argues the label is backed by a stubborn data pattern rather than simple superstition. A relatively young digital asset and a stock index with nearly a century of history both show the same weak month.
For Bitcoin, only June comes close to September on the downside over the same period. June has averaged a -1.59% return, while every other month on the calendar is positive on average. October stands at the other end of the range. Decrypt says it has delivered an average return of 19.92% and a median of 14.71%, which explains the “Uptober” narrative that resurfaces each year in crypto circles.
August comes with an important caveat. Its average return is a positive 2.82%, yet its median return is -6.99%. In other words, most Augusts have been losers, but a small number of unusually strong years pulled the average back into positive territory.
Wall Street has the same problem
The stock market version is older and better documented. Decrypt says the S&P 500 has averaged about a 0.6% decline in September since 1945, based on Chase market research, making it the only month with a negative long-run average. Stretch the timeline back to 1928 and the average loss worsens to roughly 1.1% to 1.2%. The article also notes that researchers at Yardeni traced the pattern back to 1928.
There is no single accepted explanation. The theories highlighted by Decrypt include mutual funds selling underperformers in September before an October 31 fiscal year-end to harvest tax losses, institutional trading desks returning from summer breaks and carrying out delayed de-risking in a cluster, and the Federal Reserve’s mid-month meeting landing in the middle of a historically choppy period.
Those explanations do not map neatly onto Bitcoin, which has no fiscal calendar and no summer vacation. Even so, Decrypt frames Bitcoin as a financial investment asset that still trades within broader market behavior.
This year adds another variable. 2026 is a U.S. midterm election year. Looking across the last 10 midterm cycles since 1986, the average U.S. stock market low has arrived on September 2, with average drawdowns of nearly 17% from the prior high before recovery, according to the article. Decrypt adds that Bitcoin now trades more like a high-beta tech stock than a hedge, so that relationship can cut both ways.
How last September unfolded
Decrypt describes last year’s Red September as a month that followed the script before reversing it. Bitcoin opened the month around $108,000, with its RSI near 38 and in oversold territory. DYOR CEO Ben Kurland told Decrypt that Red September was “more myth than math.”
At least in the first half of the month, the numbers pointed the other way. By mid-month, roughly $162 billion had been erased from total crypto market capitalization in a brutal week, while Bitcoin fell toward $112,000 and briefly touched an intraday low near $111,986. At that point, traders on Myriad, the prediction market built by Decrypt parent company Dastan, were pricing nearly 60% odds of another red day.
Bitcoin recovered anyway. Decrypt says ETF inflows helped. CryptoQuant flagged long-term holders rotating coins into ETFs as a bullish signal, and BTC rallied back above $114,000 to close September up 5.16%, giving the market its third consecutive green September on record.
Then October broke the pattern
The rebound lasted only six days. On October 6, Bitcoin set a fresh all-time high above $126,000, and the usual Uptober trade looked intact again.
That changed on October 10, when President Donald Trump threatened 100% tariffs on Chinese imports. Crypto was the only market open to react at the time, Decrypt wrote. Within 24 hours, $19 billion in margin positions were wiped out and 1.6 million traders were liquidated. Market maker Wintermute told Decrypt it stopped trading altogether because the move violated its internal risk rules.
Bitcoin dropped from above $121,000 to briefly below $102,000 that day, with altcoins hit even harder. Some layer-2 tokens lost 70% within hours. October closed down 3.69%, only the third red October since 2013. The slide continued into November, which ended down 17.67%, Bitcoin’s worst November since 2018. By this past June, BTC had fallen to a 21-month low near $59,300. Decrypt notes that crypto traders began calling that stretch a crypto winter.
The article presents last year as an outlier: a green September followed by a red October, the reverse of the seasonal pattern traders usually expect.
Bitcoin’s setup as September begins
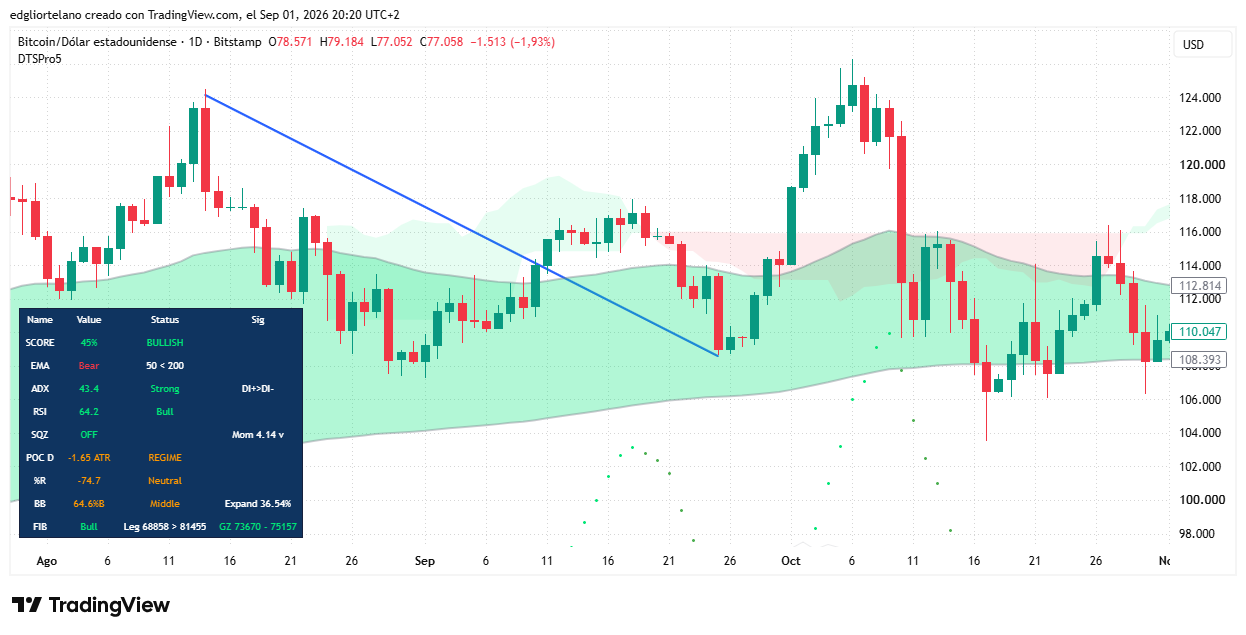
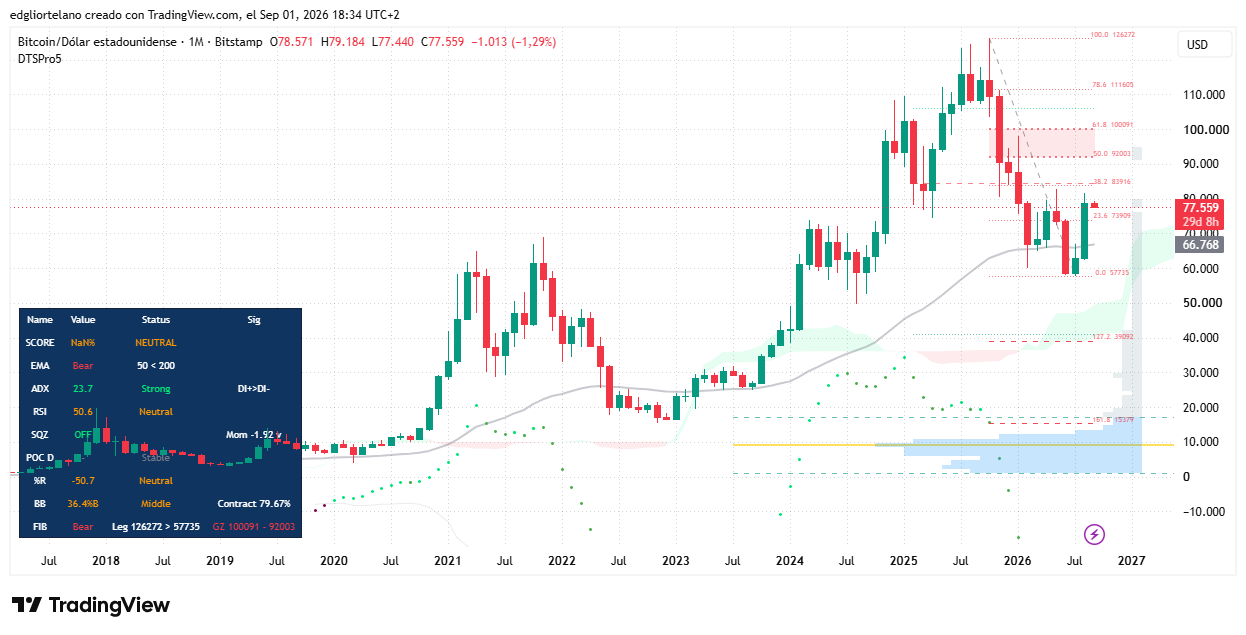
Bitcoin is trading around $77,500 at the start of this September, down slightly on the day after finishing August with a gain of nearly 25%, its best August since 2021, according to Decrypt. That rally has stalled just below resistance between $81,455 and $82,538. Support sits lower, in the $73,670 to $75,157 range.
The macro backdrop has shifted sharply since spring. In his first Jackson Hole speech, Federal Reserve Chair Kevin Warsh said the PCE price index was running at 3.7% annually and accelerating on a six-month basis. CME’s FedWatch tool now places the odds of a September rate hike at 68.2%. Decrypt also points to the 30-year Treasury yield, which touched 5.28% in late August, a level not seen since before the 2008 financial crisis.
Gold has rallied alongside Bitcoin, which Decrypt interprets as a sign that the current move is being driven less by pure risk appetite and more by a debasement trade, with investors hedging against a Federal Reserve that may be forced to keep printing while inflation stays stubborn. The SEC’s proposed Regulation Crypto Assets rule, published on August 18, adds what the article describes as a rare regulatory tailwind in an otherwise uneasy setup.
The next key date is September 15 to 16, when the Fed will decide whether to raise rates for the first time since its 2022-2023 tightening cycle. Decrypt notes that period dragged Bitcoin down about 65% to a low near $15,500 in November 2022.
Decrypt ends the piece by saying the views and opinions expressed by the author are for informational purposes only and do not constitute financial, investment, or other advice.