

Bitcoin opened the week on firmer footing, though it is still trading below a key ceiling. On Monday morning, the largest cryptocurrency changed hands around $86,100, up 1.14% over 24 hours, with market capitalization at $1.73 trillion. The broader crypto market stood at $2.94 trillion, up 1.36% on the day. The Fear & Greed Index was at 68, keeping sentiment in greed territory after last month’s pullback from extreme-greed readings.
The near-term catalyst came from Friday’s U.S. labor report. According to the Bureau of Labor Statistics, employers added just 29,000 jobs in September, roughly one-third of what economists had expected, while the unemployment rate rose to 4.2%.
Revisions made the picture weaker. July was revised from a gain of 21,000 jobs to a loss of 10,000, and August was cut from 162,000 to 133,000. Annual wage growth also cooled to 3.0%.
That was negative for workers but supportive for risk assets. In this cycle, softer economic data has fed expectations that the Federal Reserve may be less aggressive on rates.
The Fed raised rates by 25 basis points on September 16, taking them to 3.75%-4.00% in a unanimous decision. A week before Friday’s jobs report, bond traders were assigning a 64% chance to another October hike. After the report, those odds fell to about 16%-22%, depending on the snapshot.
The move reversed what happened a month earlier. On September 4, a stronger-than-expected August jobs report helped lift rate-hike bets and sent Bitcoin down more than 2% to near $79,300. Bitcoin is now trading about 8% above that level.
Stocks moved up as well. The S&P 500 closed Friday at 7,722.72, up 0.73%. The Nasdaq rose 1.19% to 27,190.86, and the Dow added 0.49% to 51,176.96. Nvidia set a fresh record high, while stock futures edged higher on Sunday night.
Altcoins were mixed. Ethereum traded at $2,711, up 0.59%, and XRP changed hands at $1.51, up 0.81%. Solana slipped 0.91% to $120.31. The article also said all top 10 altcoins were in the green, though none had gained more than 1% except Hyperliquid, which rose 3.68% on the day to $93.17 and was up 6% on the week.
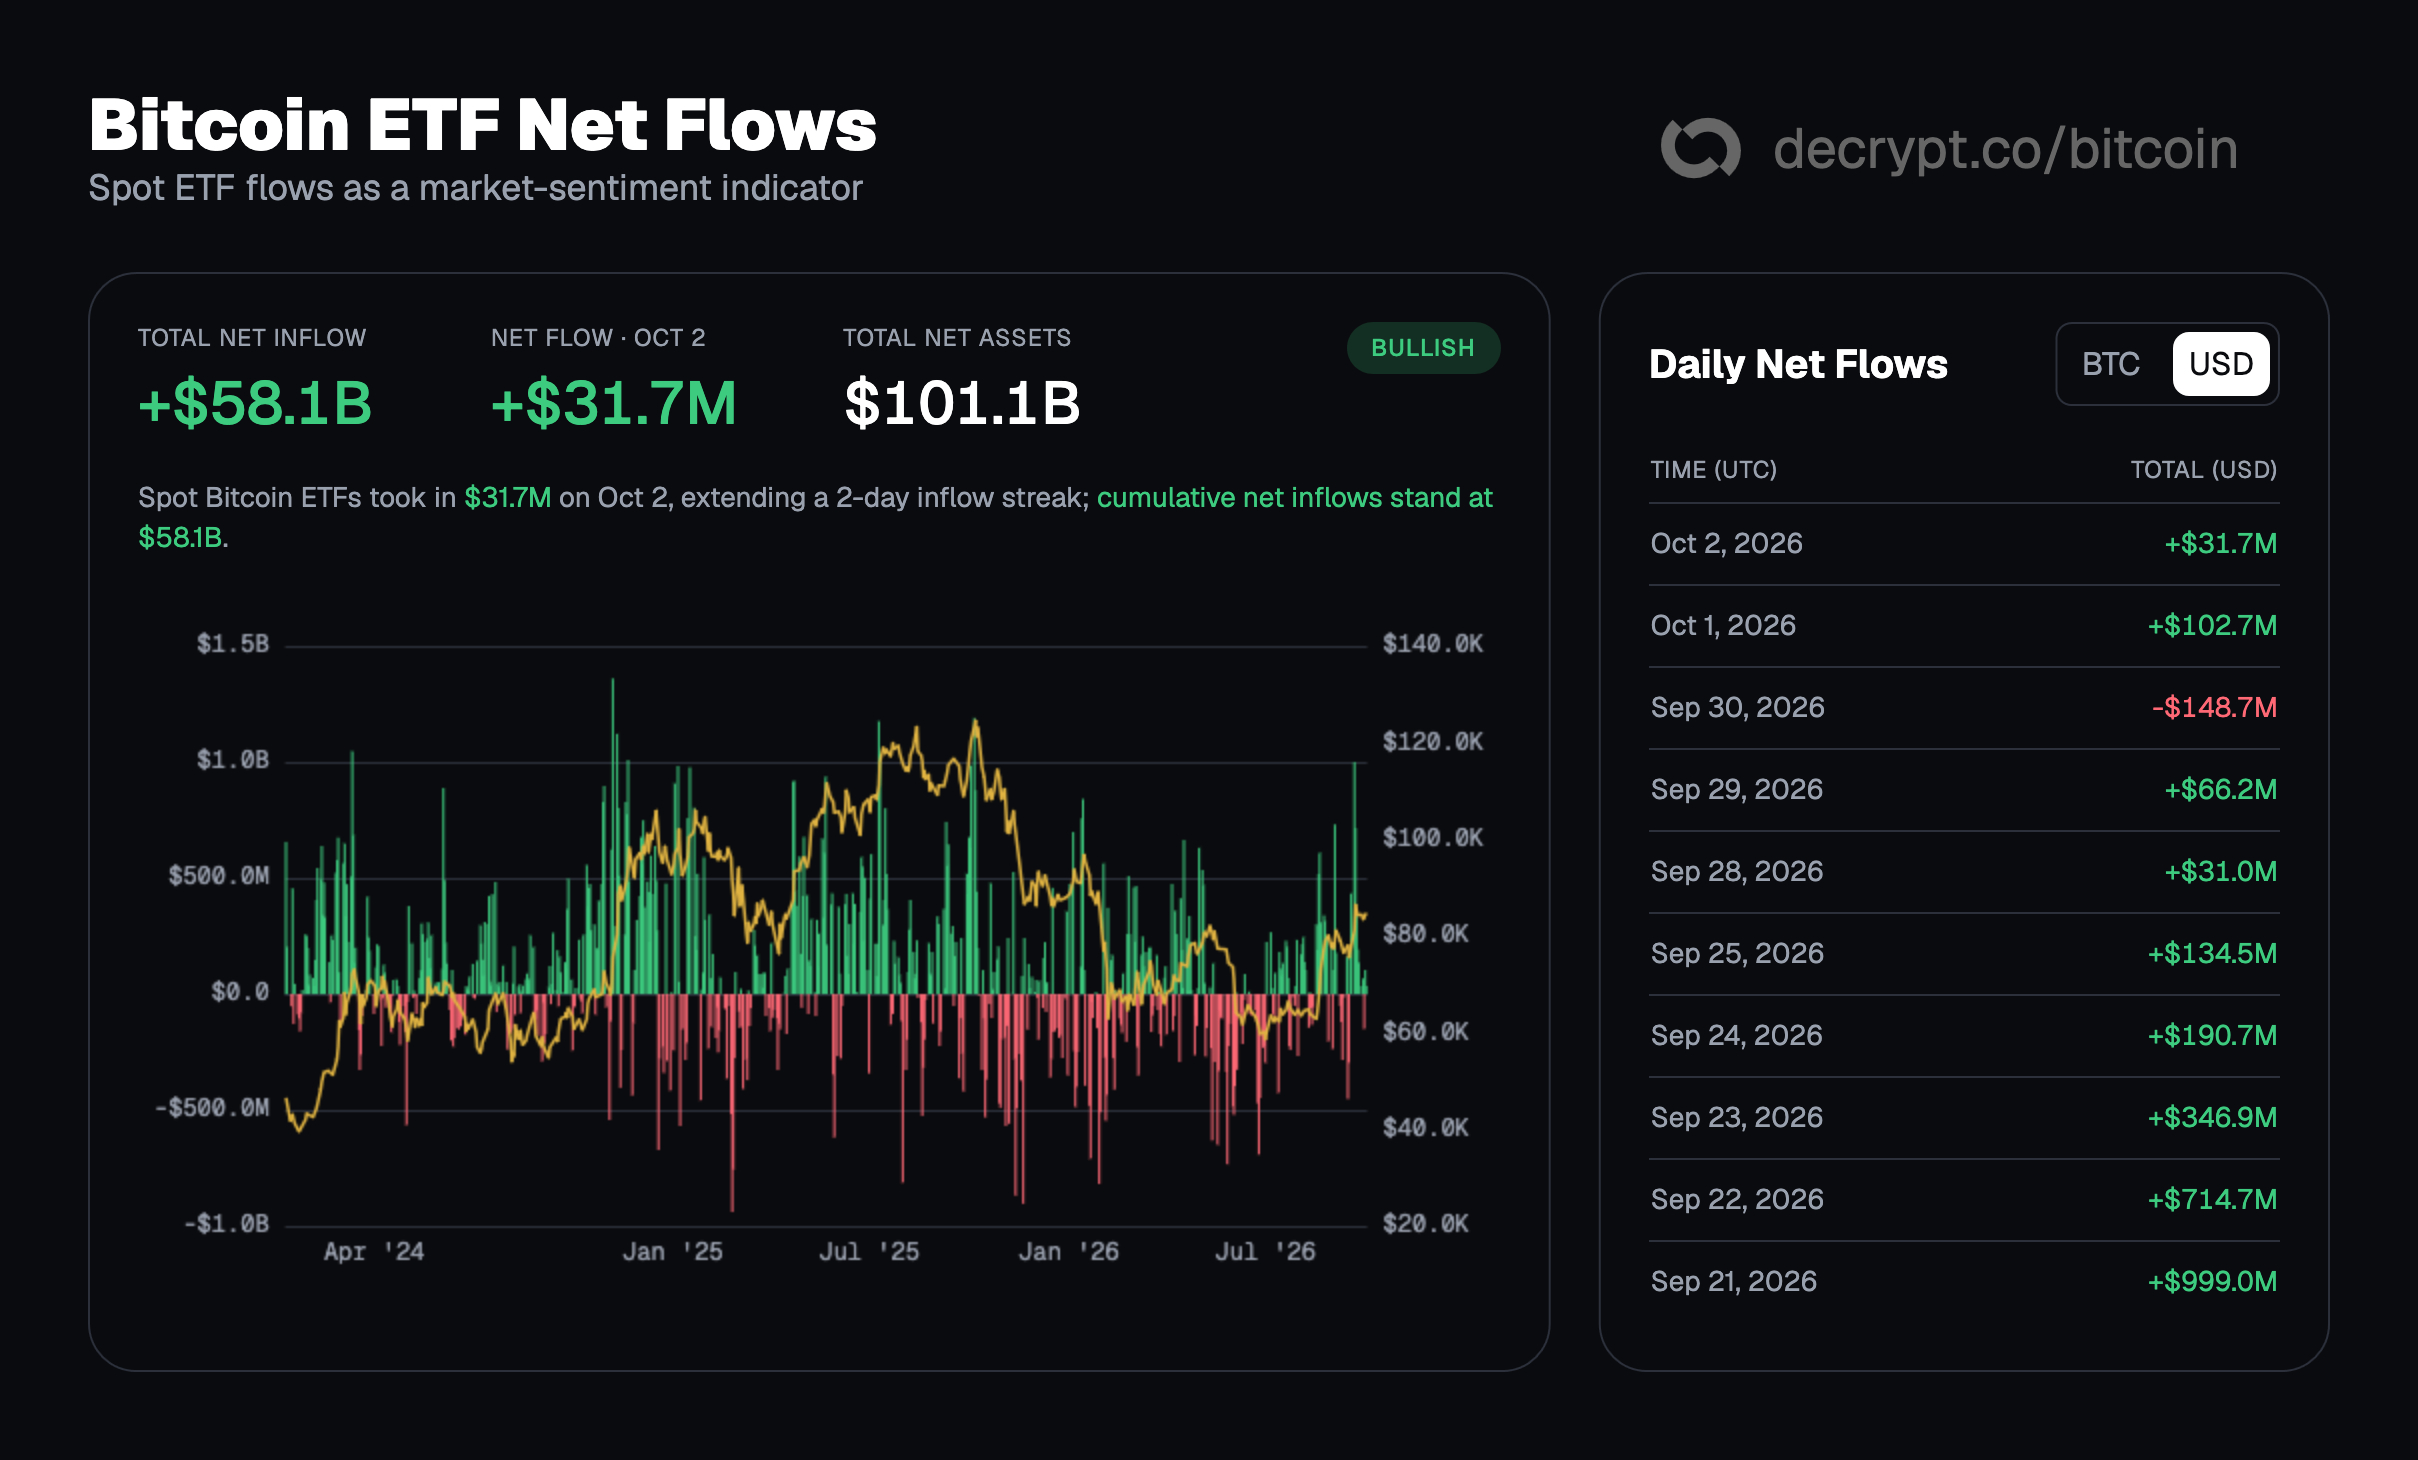
ETF demand has not faded. According to Decrypt data, U.S. spot Bitcoin ETFs recorded $189.84 million in net inflows in the latest daily reading, bringing total net assets to $101.1 billion.
$87,354 remains the level to clear
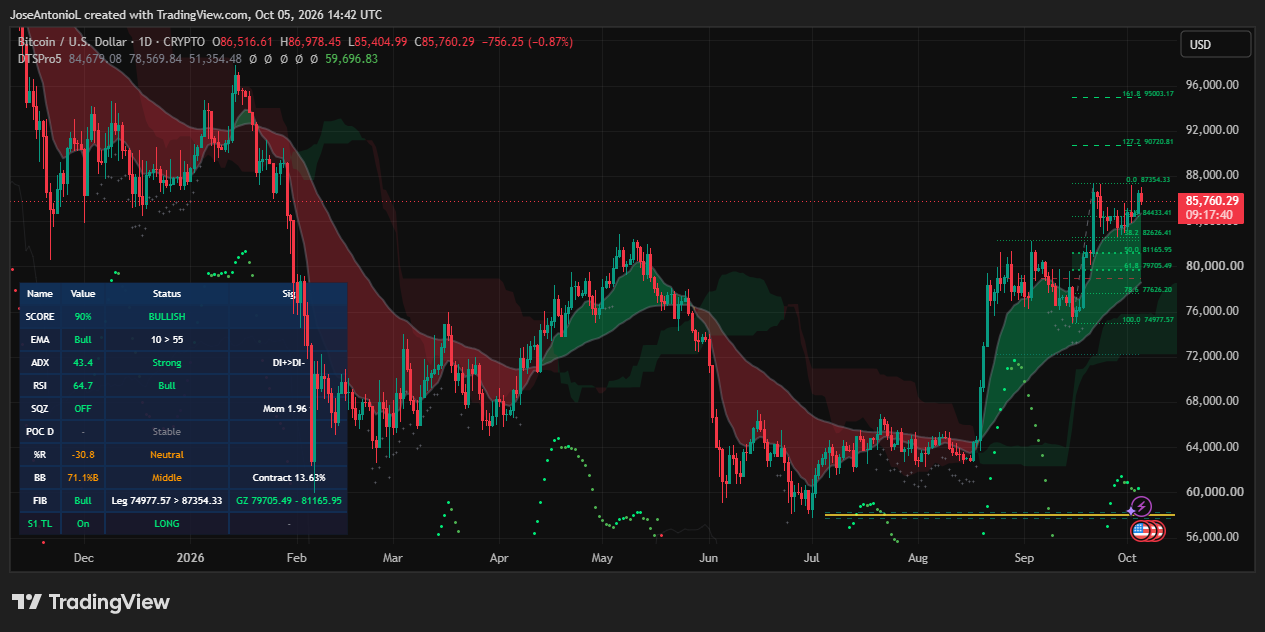
The daily chart shows why Bitcoin has hesitated. The high at $87,354 remains the key line on the upside.
Momentum, though, is still strong. The Relative Strength Index, which measures recent gains against losses on a 0-100 scale and is commonly seen as overbought above 70, stood at 64.7. That is elevated, but not at an extreme. The Average Directional Index, which measures trend strength regardless of direction and is generally viewed as strong above 25, came in at 43.4.
Exponential moving averages, or EMAs, track average prices across set periods while placing more weight on recent data. A golden cross happens when a faster EMA rises above a slower one. On the chart, the 50-day EMA is already above the 200-day EMA, the standard version of a golden cross. That took place in mid-September, when Bitcoin logged what the article described as its second-best performance ever for that month.
A stronger signal has now appeared as well: the 100-day EMA has crossed above the 200-day EMA. In the chart referenced by the article, the 100-day EMA is the dotted white line.
Why the 100-day/200-day cross is viewed as stronger
The article’s argument is that this setup is harder to produce with a short-lived rebound. A sharp two-month rally can pull the 50-day EMA above the 200-day EMA. Getting the slower 100-day EMA over the 200-day EMA requires Bitcoin to hold elevated levels for months.
In that reading, BTC has done more than rebound from the sub-$60,000 levels seen in July. It has rebuilt its medium-term trend.
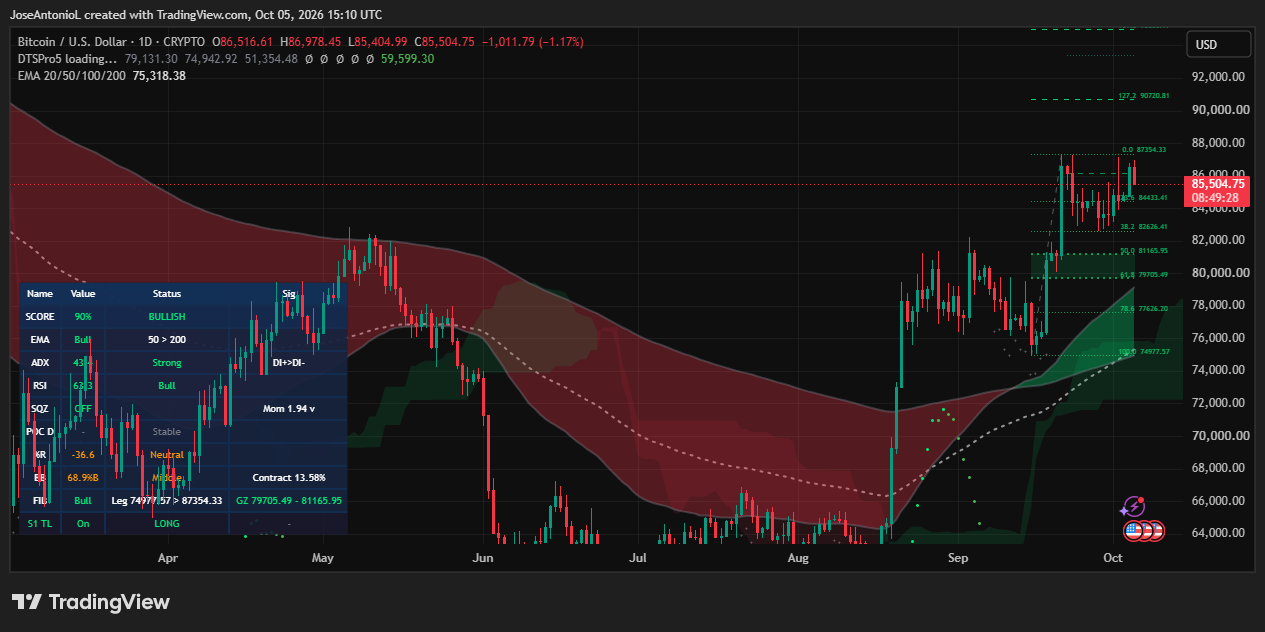
With both crosses in place, the short-term and medium-term averages are now above the long-term average. The article describes that as a second confirmation of the same trend. It also notes the usual limitation: EMAs are lagging indicators, so a golden cross confirms a move that has already happened rather than forecasting the next one.
Prediction market levels and the week ahead
On Myriad, the prediction market built by Decrypt parent company Dastan, traders were leaning bullish on a short-term push. In the October highs market, an $87,500 touch was trading at 80%, $90,000 at 59%, $95,000 at 25%, and $100,000 at 12%.
The macro calendar for the week is short, but the listed events are important. The Federal Reserve is due to release minutes from its September meeting on Wednesday, October 7, at 2:00 p.m. ET. The Bureau of Labor Statistics will publish September CPI on October 14. The Fed’s next policy meeting is scheduled for October 27-28, with a press conference set for October 28 at 2:30 p.m. ET.
The article adds that the views and opinions expressed by the author are for informational purposes only and do not constitute financial, investment, or other advice.