
Glassnode says Bitcoin is moving through a bear phase that is unusually shallow by historical standards, while the visible parts of the market have turned notably quiet. Spot volume has fallen to its lowest level since 2019, exchange flows have nearly stalled, U.S. spot ETF activity has faded, and sell-side depth in spot order books has thinned sharply.
The report traces that calm back to a macro shift. With the bond market no longer pricing rate cuts and instead leaning toward hikes, Treasury yields have moved above returns available in crypto cash-and-carry trades. In that setup, marginal buyers are being paid to sit in cash rather than provide leverage, liquidity, and turnover to crypto markets.
Bitcoin lost one of the few supports it had in June
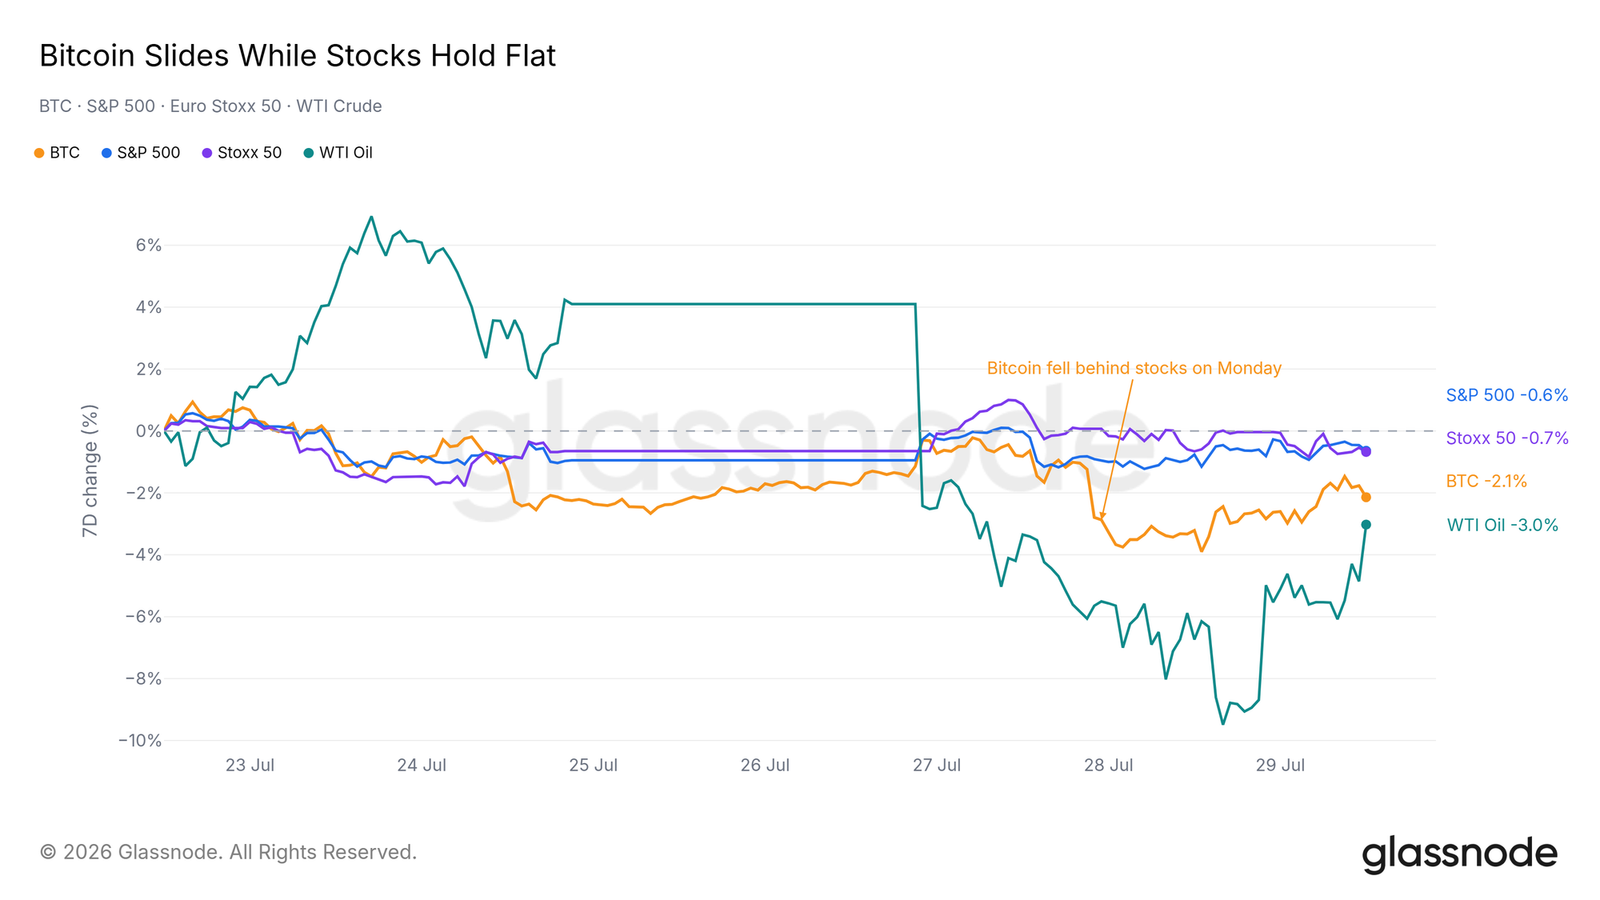
Last week, Bitcoin outperformed stock indexes and absorbed the oil shock while equities were mostly flat. That relative strength has now faded, Glassnode said. Bitcoin declined over the course of this week while U.S. and European equities went sideways, with the turning point arriving on Monday. From that session on, Bitcoin no longer kept pace with stocks. Oil also gave back last week’s gains and became the weakest asset in the group.
Glassnode said one week of relative weakness does not amount to a regime shift. Still, it removes one of the few supports that had been visible during the June recovery, when Bitcoin was still attracting buyers on days when stock indexes showed little movement.
The report argues that the bond market had already formed a view before the Federal Open Market Committee decision. The 2-year Treasury yield, which it describes as the cleanest read on the policy path, has traded above the federal funds rate since April. The gap between the two is now the widest since November 2022. In Glassnode’s reading, that is not a market waiting for rate cuts. It points more toward pricing for the next move to be a hike.
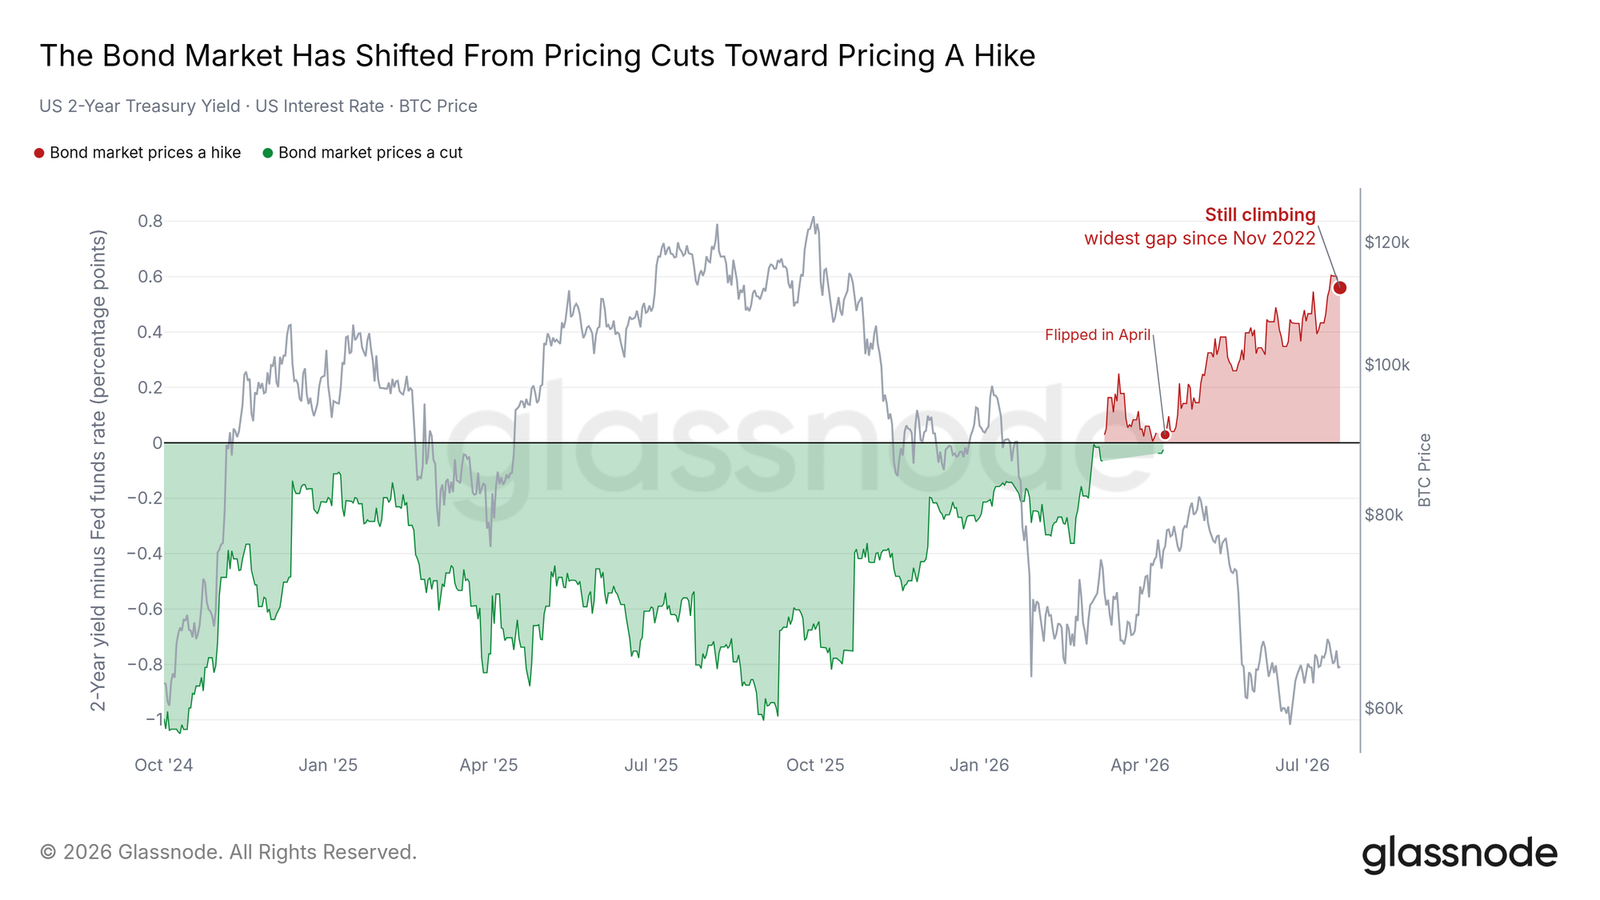
It added that if the Fed were to cut rates on the day, much of the market would be caught off guard, and that outcome would also fit naturally with the softer core inflation data cited in the prior week’s report. But the more important signal would come from the market reaction itself. If an upside surprise still failed to hold buyer interest, that would say more about the absence of marginal demand than about the decision alone.
Why buyers stepped back
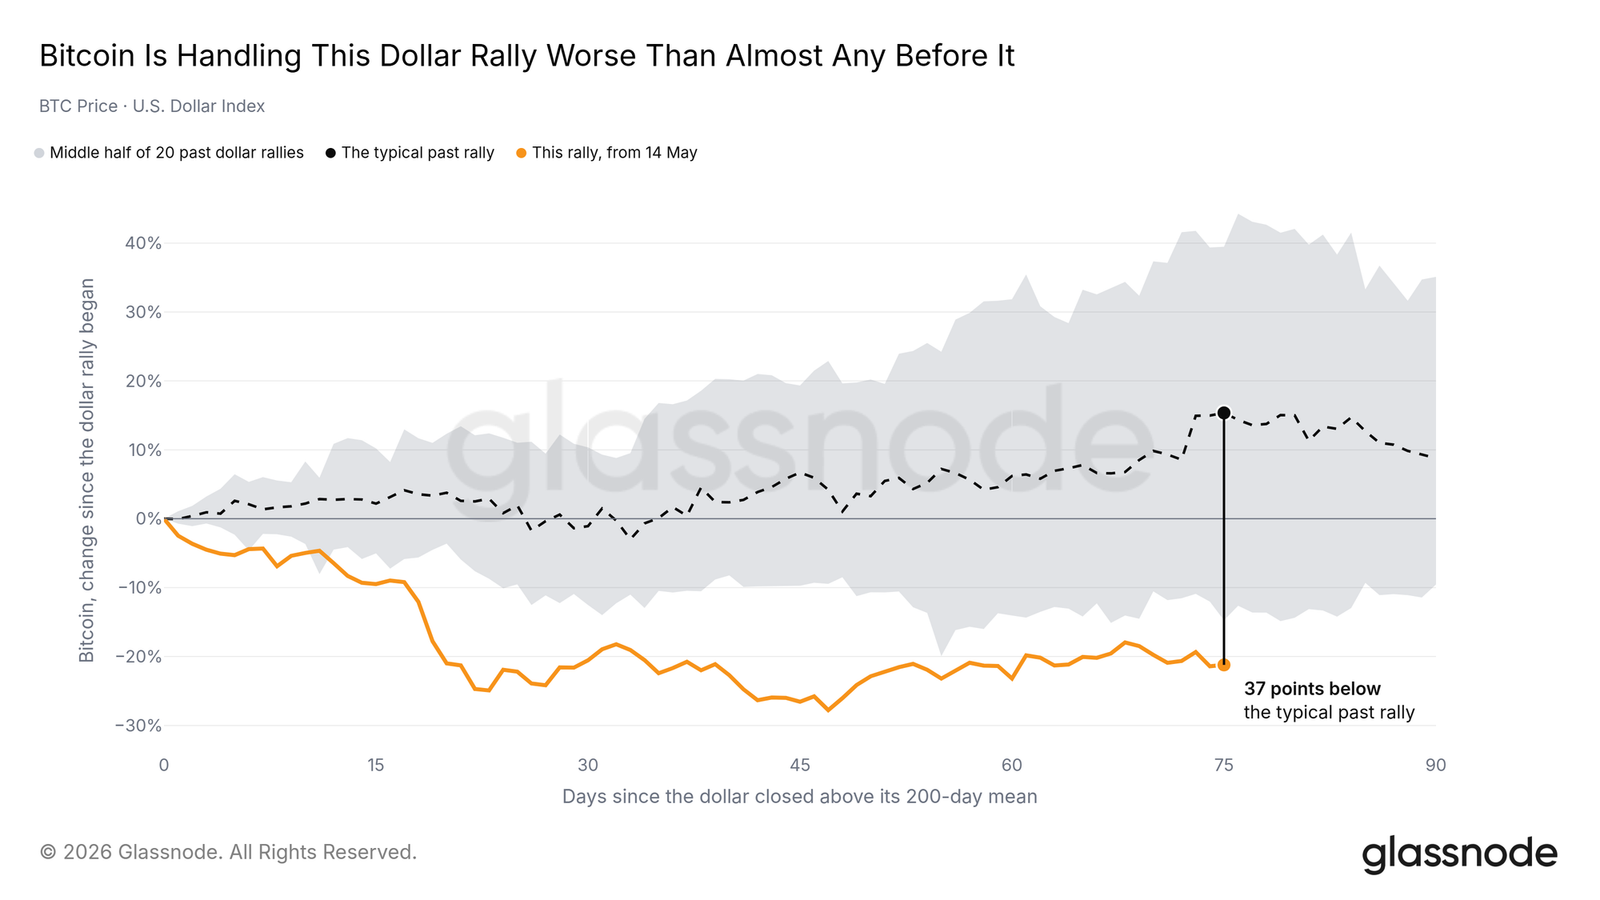
Glassnode laid out two channels. The first is the U.S. dollar. Since May, the dollar has kept strengthening, and Bitcoin’s ability to absorb that move has been close to the worst on record. In typical comparisons going back to 2015, Bitcoin had usually risen by this stage of a dollar rally. This time it remains in negative return territory, with only three worse cases out of the last 20 similar episodes.
The second channel is more mechanical. The 3-month futures basis, used here as a proxy for institutional cash-and-carry yield in crypto, has stayed below the 2-year Treasury yield since February. Historically, there has been only one stretch that lasted this long, from August 2022 to January 2023, and that period ended at the cycle bottom.
When Treasury yields exceed the basis, desks that normally supply leverage, depth, and volume to the market have little reason to remain active. Glassnode said many of the weak off-chain readings discussed later in the report can be traced back to that spread.
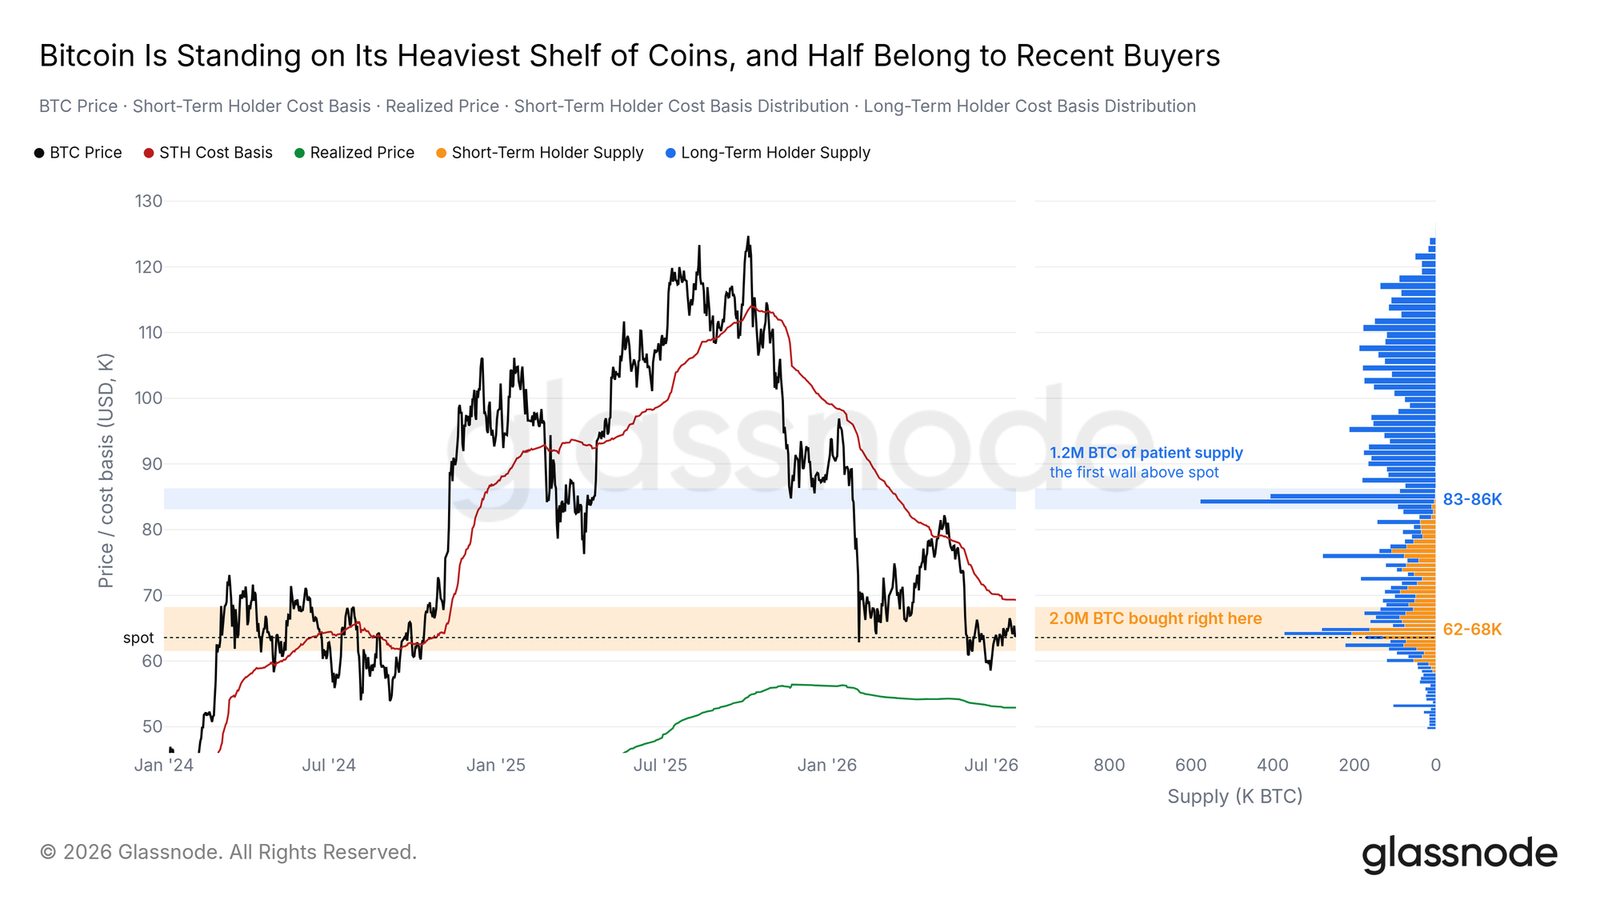
Bitcoin is sitting in its heaviest cost-basis shelf
On-chain, Bitcoin is trading inside the heaviest single cluster in the cost-basis distribution, roughly between $62,000 and $68,000. More coins changed hands in that band than at any other price range on the chart. The supply in that zone is split almost evenly, Glassnode said: one half belongs to short-term holders who bought during this year’s decline, and the other half belongs to long-term holders who kept holding through the drawdown.
The long-term holder side tends to behave like patient supply and often acts as a floor. The short-term holder side is more sensitive, and most of it is underwater, which means it often becomes the first source of supply when the market rallies. Above the current range, the short-term holder cost basis at $69,000 remains the key line for the next leg. Higher up, the larger supply wall sits between $83,000 and $86,000, where long-term holder supply is concentrated.
The drawdown is shallow, but the clock has not run out
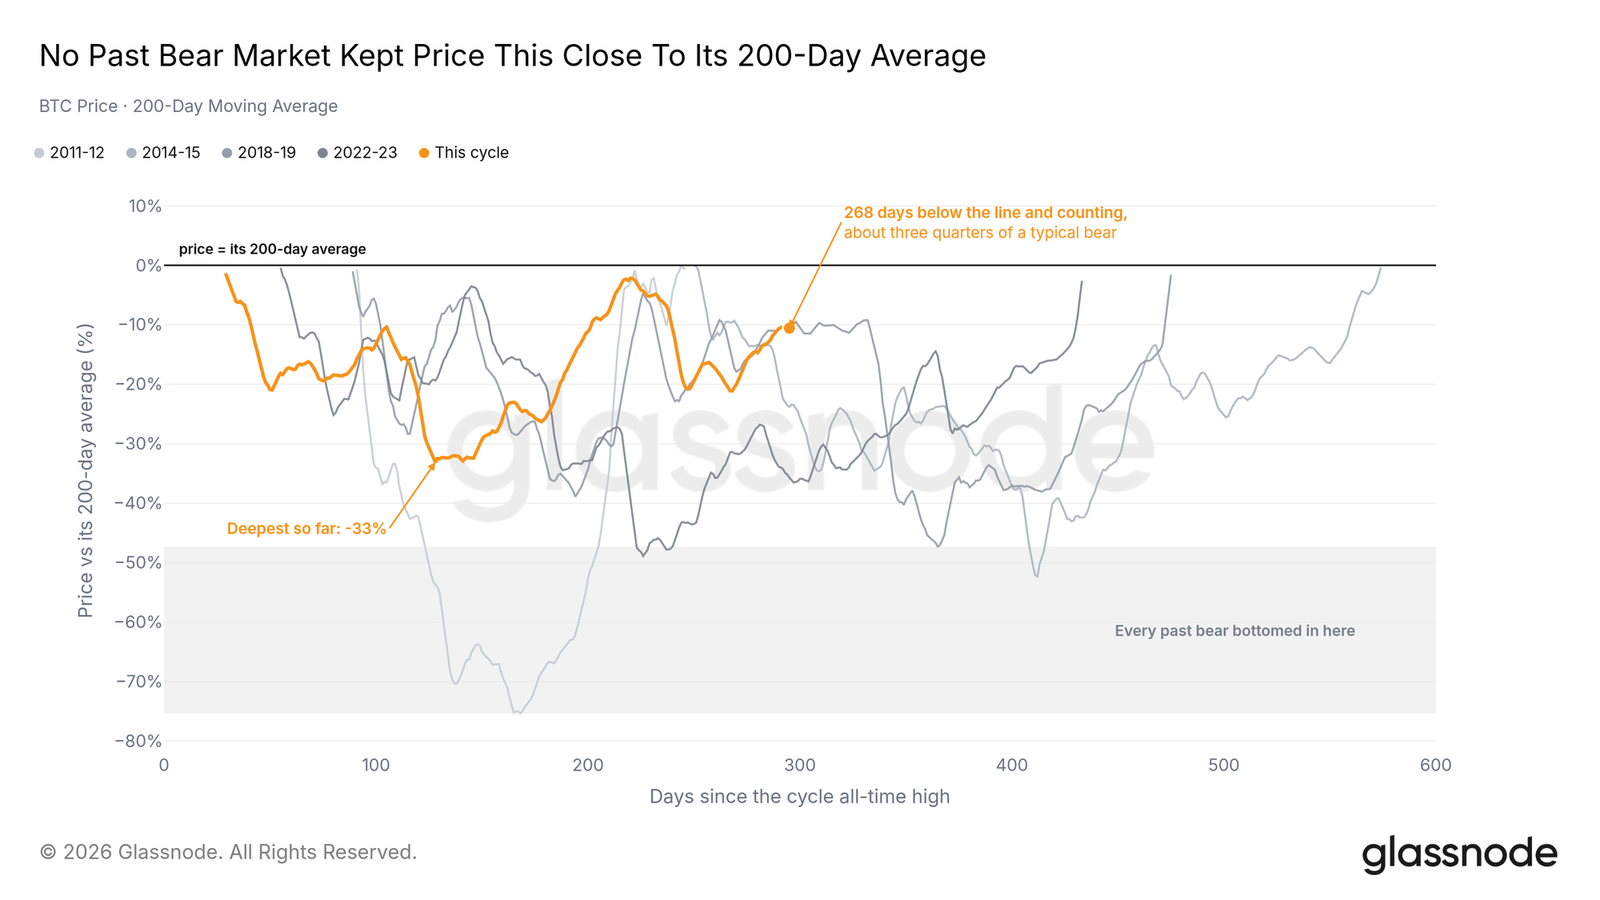
Glassnode used two measures to judge the depth of the current bear market, and both point in the same direction. Against the 200-day moving average, no prior bear market pushed Bitcoin this close to trend. The deepest discount in this cycle still remains well above the depth seen even in the mildest earlier bear phases.
Measured from the all-time high, the picture is similar. The bottoms of prior bear markets all traded far below the range that has contained the market so far in this cycle.
Time tells the other half of the story. Bitcoin has spent roughly three-quarters of the typical duration of earlier bear markets below the 200-day moving average, and most of those previous bear phases lasted longer. In other words, the drawdown has been mild, but it has not yet matched the time that earlier cycles required. For that reason, Glassnode said patience makes more sense than rushing to declare a bottom, especially for traders who still work from a four-year cycle framework.
Exchange activity points to indifference, not aggressive accumulation
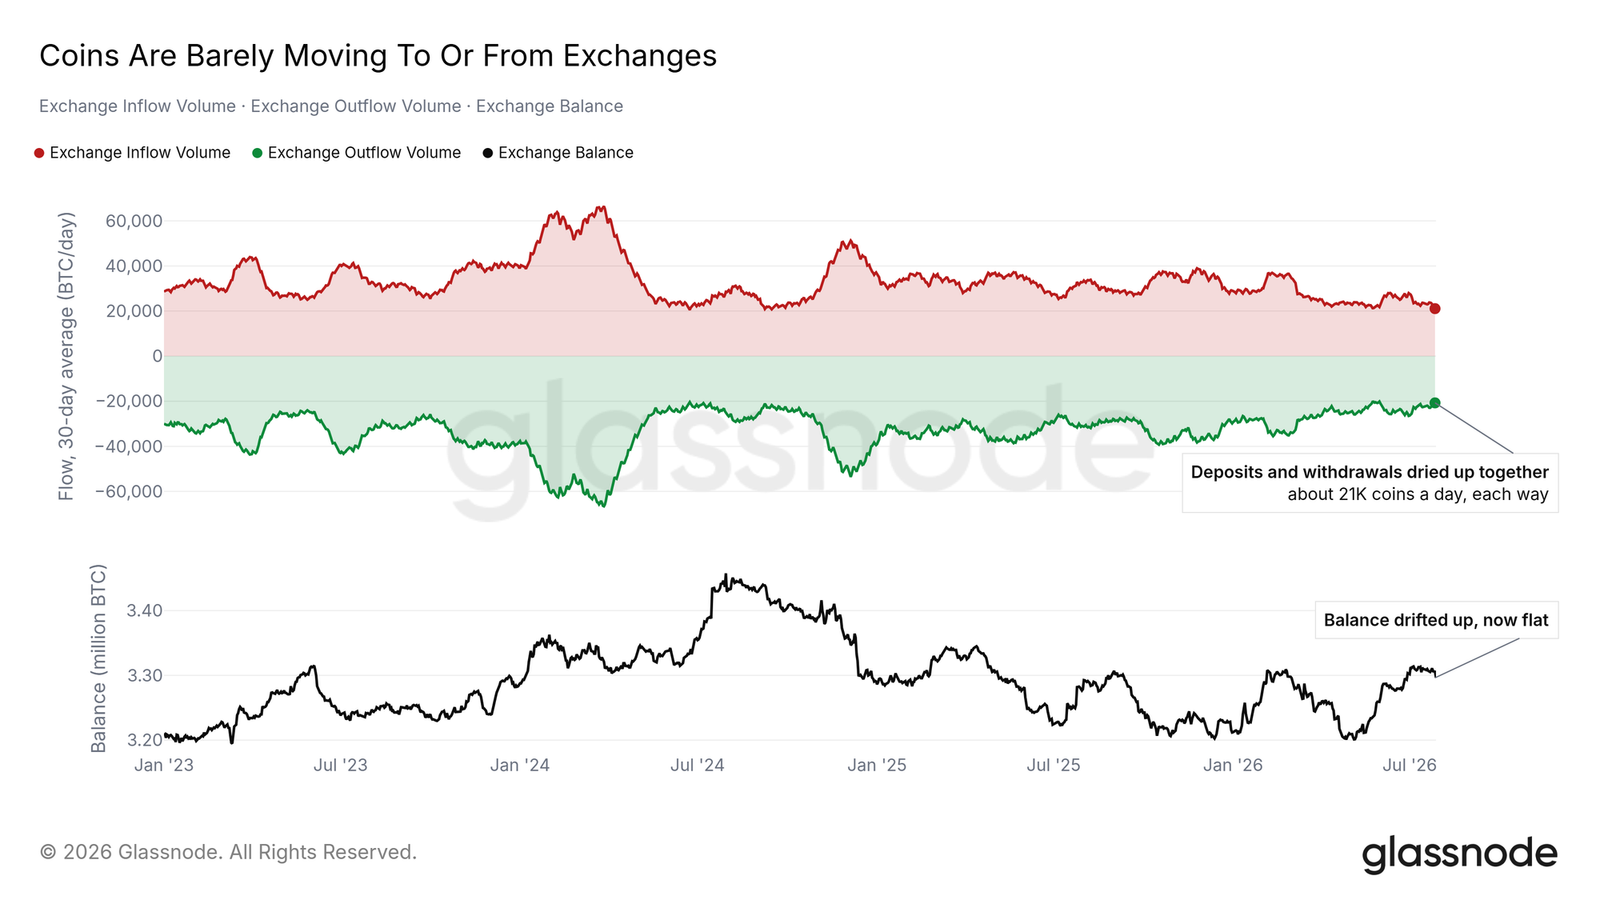
Exchange inflows and outflows have both thinned. Glassnode said each side is now running at a similarly soft pace, creating one of the quietest combined flow environments of the last three years and sitting far below what was normal from 2023 through 2025.
Exchange balances tell a similar story from the other side. They have been rising slowly from the April low and have been mostly flat since early July. The report reads this more as indifference than as distribution or accumulation, a pattern more often seen during the quiet middle stretch of a bear market.
That lack of on-chain movement also matters because if demand changes suddenly, there is very little ready supply already moving that could absorb it.
ETF demand has gone idle
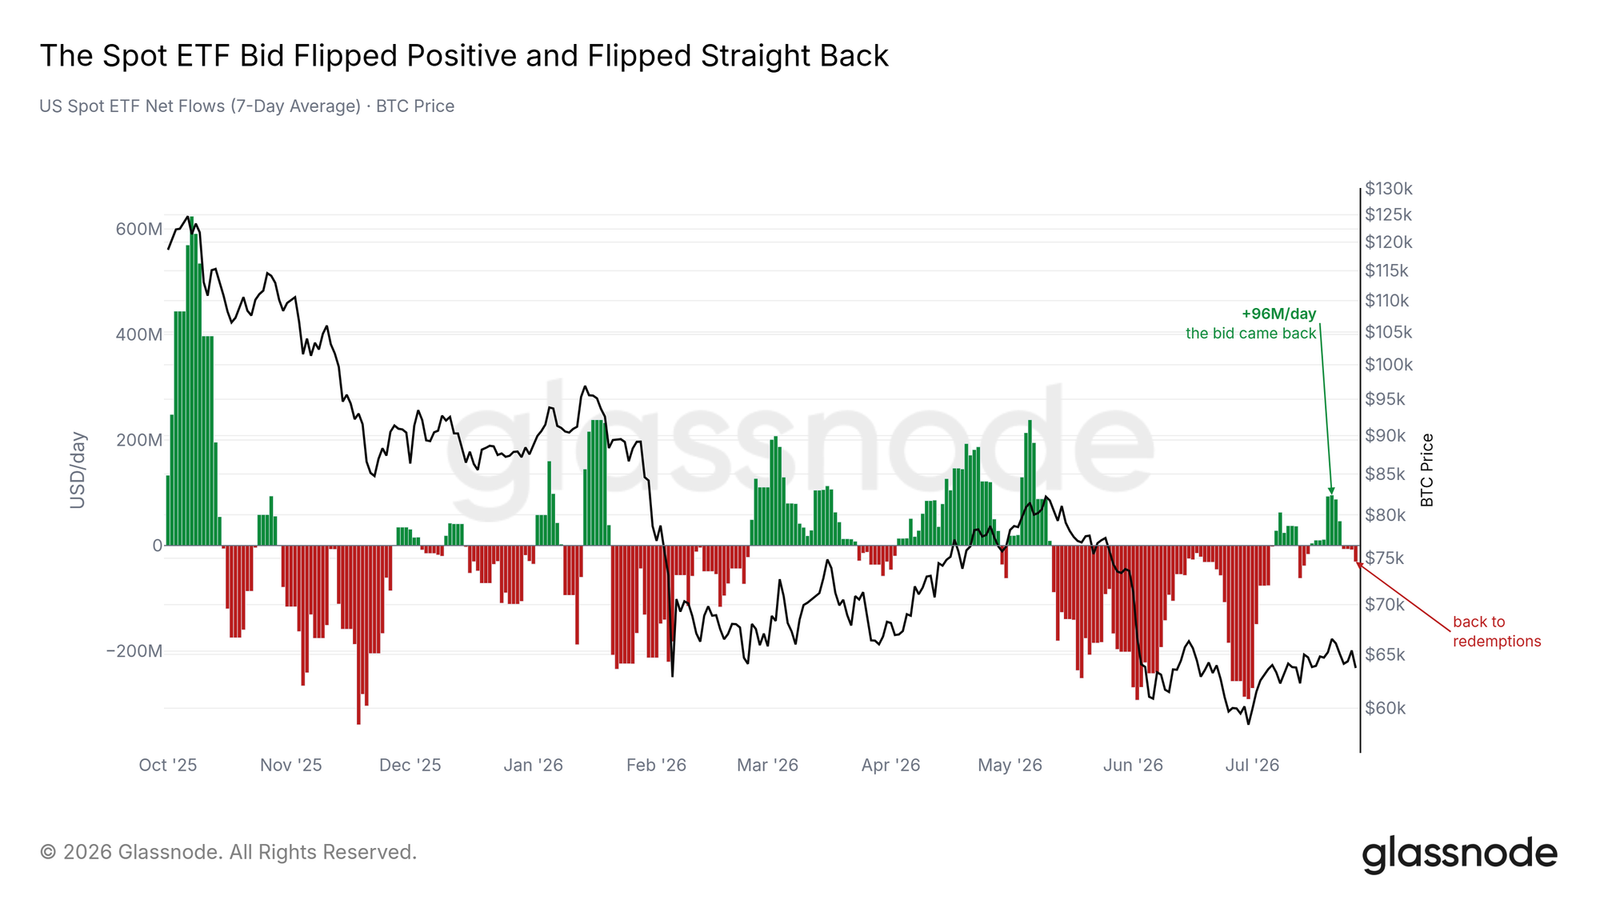
In off-chain data, U.S. spot ETF flows turned positive in mid-July, then quickly faded within a week. Net inflows have slipped back to slightly negative, although the current outflows are almost negligible compared with the redemption waves seen in June and early July.
Glassnode’s read is that the institutional channel is neither selling aggressively nor driving a sustained bid. After last week’s reversal, persistence matters more than size, and that persistence has not shown up.
Hedges were sold at the local high, and options budgets shifted back to puts
The cost of downside protection nearly collapsed to zero on July 21, the same day Bitcoin marked a local high after bouncing from the June low. Hedges were sold into the top, and deleveraging during the rebound left the market leaning straight into the decline that followed.
That positioning became more expensive over the next week. Skew rebounded from its low, and flows shifted with it. The put/call ratio based on traded volume touched a low for the year and then climbed sharply as price slipped. Perpetual funding rates stayed pinned below neutral for the entire month.
Open interest offered a more cautious message. The open-interest put/call ratio also appeared to bottom at the same moment, but it has barely moved away from that low. Glassnode said that looks more like repositioning than a full change in stance.
Options buyers had been paying for upside during the rally. Since the market rolled over from last week’s top, budgets have rotated back toward puts, although the last stage of that shift was influenced by one oversized put trade. The more meaningful change, the report said, is on the call side, where spending for upside exposure has slowed sharply compared with last year’s rhythm. That does not look like panic hedging.
Implied volatility agrees. The entire curve is compressed near the bottom of its range, and 6-month implied volatility is close to the lowest level seen. In Glassnode’s view, options traders rarely price the next six months with such calm expectations.
Spot volume has fallen to a 2019 low, while bids are waiting lower
Measured in BTC rather than dollars, so price declines do not flatter the data, spot trading volume has dropped to its lowest level since 2019. Excluding Binance, whose zero-fee promotion in 2022 and 2023 inflated tracked volume, the picture remains similar, although still above the deepest trough of the last bear market.
Glassnode said low volume is not a directional signal by itself. It says more about who is still participating. When cash is being paid to wait, a meaningful share of capital appears to be doing exactly that.
Order-book data shows that capital has not disappeared. It has stepped back. Since early June, buy orders have continued to build in the 2% to 20% range below spot and have been refreshed day after day. Above the market, sell-side depth in that same band has thinned sharply and is close to its lightest level of the past month.
That leaves a market where buyers are willing to step in, but not at current prices, while the supply that could cap upside has also faded. Thin books cut both ways. They are often how quiet markets suddenly accelerate.
Glassnode’s final read remains Risk Off
Glassnode said its Bitcoin vector reading remains Risk Off. The signal is mild rather than extreme and sits one tier above capitulation territory, which the model labels a tactical pause.
That points to a defensive market rather than a capitulating one. Macro conditions are rewarding capital for staying in cash, on-chain and off-chain surfaces have gone quiet, and the model that scores those conditions is not calling for anyone to front-run an entry. A single rebound is unlikely to change that. In Glassnode’s view, the real change would have to come from a change in regime.
What would change the picture
The report’s conclusion is that the current regime has not changed, and the cause sits upstream from crypto itself. As long as Treasury yields remain above basis trade returns and the dollar stays firm, marginal buyers are incentivized to remain in cash. Downstream, the market keeps reflecting that same message through multi-year low spot volumes, near-stalled exchange flows, and a thinner sell side.
Glassnode said improvement would begin with policy and show up in market data through a recovery back above the $69,000 short-term holder cost basis with volume returning, alongside a shift in ETF flows from idle to net buying. If Bitcoin loses the $62,000 to $68,000 cost-basis shelf while exchange inflows wake up, that view would be invalidated.