
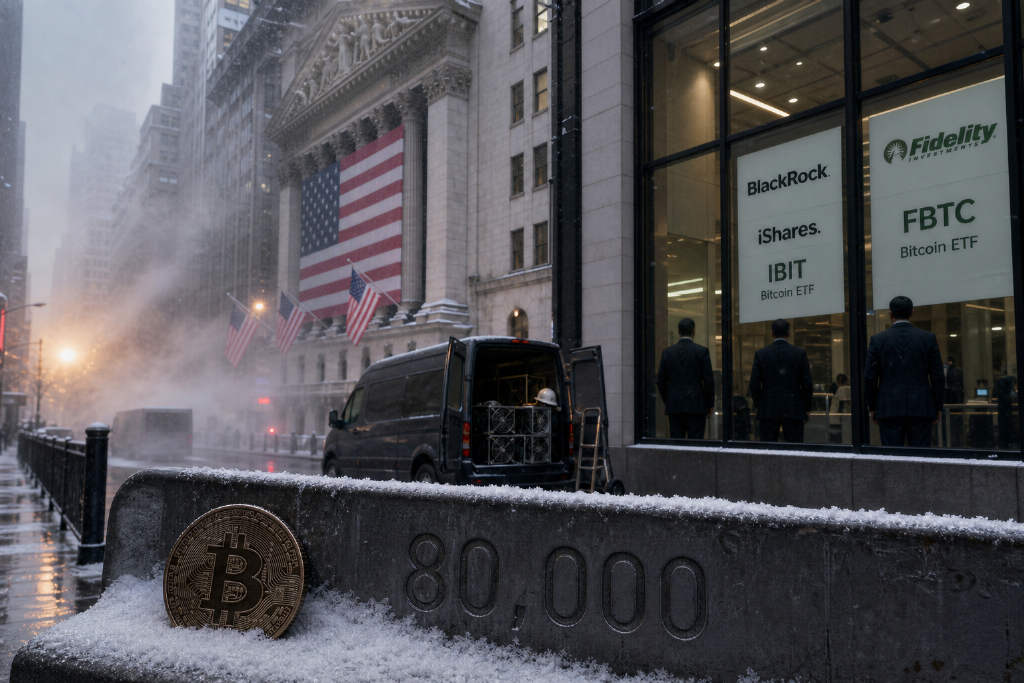
Eight sessions of spot Bitcoin ETF inflows have not been enough to push BTC firmly above $80,000
U.S. spot Bitcoin exchange-traded funds have recorded net inflows for eight consecutive trading sessions, according to Securities and Exchange Commission filings and public disclosures from issuers cited in the report. Products led by BlackRock’s IBIT and Fidelity’s FBTC continued to draw subscriptions, pointing to ongoing allocation demand from traditional wealth managers and hedge funds.
That buying has not produced a clean breakout in the spot market. Bitcoin has repeatedly tested the $80,000 psychological threshold and run into concentrated selling, failing to establish a decisive move above it. The report, citing Bloomberg’s market-liquidity tracking, frames the divergence between steady ETF inflows and muted price action as a sign of deeper positioning battles across spot and derivatives markets.
Strong fund flows, restrained price reaction
Over the past two weeks, U.S. spot Bitcoin ETFs have become one of the market’s main channels for fresh liquidity, the article says. Reuters’ compilation of fund subscription and redemption data showed the products stayed in net subscription territory for eight straight trading days, with daily net inflows reaching several hundred million dollars on multiple occasions.
Even so, Bitcoin’s rally lost momentum once price moved into the $79,500 to $80,000 range. Intraday volatility narrowed and upside progress slowed. The report argues that this disconnect suggests significant turnover in the market, with ETF-related spot demand being offset by spot selling of equal or greater size.
CoinDesk’s market-depth analysis, as cited in the piece, says ETF inflows have helped provide a solid floor on the downside. But the article adds that accumulated profit-taking and the weight of a major round-number level mean compliant-channel buying alone has not been enough to clear the heavy sell orders built up over months.
Basis trades may be diluting the directional impact of ETF demand
CME positioning is part of the explanation
The article argues that one starting point is the nature of the institutional money entering ETFs. Based on Chicago Mercantile Exchange open-interest data, institutional short futures positioning has shown a high correlation with net inflows into spot Bitcoin ETFs.
Many large multi-strategy hedge funds are not necessarily making a straightforward bullish bet on Bitcoin spot. Instead, they are deploying classic cash-and-carry basis trades. When CME Bitcoin futures trade at an annualized premium of 10% to 15% over spot, quant funds can buy spot ETF shares through regulated brokers and short an equivalent amount in the futures market, locking in what the article describes as a risk-free spread.
Net inflows do not always equal outright bullish pressure
Under that delta-neutral structure, ETF issuers still need to buy real coins in the spot market and move them into custody cold wallets. But the offsetting futures short can suppress bullish basis conditions in derivatives, with that pressure feeding back into spot order books through market-making and arbitrage flows.
The Block’s quantitative research, as cited in the report, says that when a significant share of ETF buying comes from basis-arbitrage capital, the actual net price impact of those inflows can be reduced sharply. In other words, the flows can deepen liquidity without producing the same force as unhedged directional demand.
Long-term holders and miners are adding supply near the resistance area
Older coins are moving as price nears the milestone level
The report also points to on-chain supply as a major source of resistance. According to coin lifecycle monitoring referenced from CoinMarketCap and CoinGecko, investors who have held Bitcoin for one to three years have started moving more coins from cold wallets to centralized exchanges as price approaches $80,000.
After months of consolidation, a large pool of capital built near the bottom of the previous cycle appears to be using the historically elevated zone to lock in book profits. The article says that process has created a sustained wave of spot supply over several days.
Miners face post-halving operating pressure
Miner balance-sheet adjustments are another factor. The article says the post-halving environment, together with rising network difficulty, has pushed up the effective shutdown cost per coin. DefiLlama’s industry tracking, according to the report, shows that some mid-sized and large mining firms sold Bitcoin in a systematic way while the market was testing the $80,000 resistance area, using proceeds to cover electricity bills and fund purchases of newer, more efficient mining hardware.
That leaves spot liquidity well supplied even while ETF channels continue to absorb circulating coins.
Options market structure is building a gamma wall around $80,000
Call open interest is concentrated at the strike
From the perspective of order-book structure and options pricing, the article says $80,000 is more than a psychological level. It is also a technical barrier shaped by derivatives positioning. On major crypto options venues, open interest in call options is concentrated most heavily at the $80,000 strike.
Market makers are said to hold a large net short gamma exposure around that level. As spot approaches $80,000 quickly, they often need to hedge by leaning against the move in spot or perpetual futures in order to keep portfolios delta-neutral. That dynamic can create a moving supply wall that is difficult to clear in a single attempt.
Leveraged longs and funding sensitivity add friction
The article also says retail and momentum traders have built up leveraged long exposure in anticipation of a breakout, while perpetual swap funding rates have risen at times. Higher funding costs make those positions more fragile. If large spot sales hit the tape, local long liquidations or stop-outs can follow, delaying a stable move above resistance.
Macro conditions are also shaping the pace of allocation
The report places Bitcoin within a broader macro framework. Drawing on Financial Times analysis, it says the U.S. dollar index, or DXY, and Treasury yields have recently rebounded with support from resilient economic data. That has curbed the appetite of cross-asset capital for high-risk positions to some extent.
While the Federal Reserve’s broader policy setting is still being debated within a looser-cycle framework, shifts in rate-cut expectations have led some large traditional asset managers to build digital-asset exposure in stages rather than chase price at resistance. That approach reduces the odds of aggressive buying hitting the market exactly at $80,000.
What the article says traders should watch next
The report lists several variables as key to determining whether Bitcoin can break and hold above $80,000:
- the steadiness of daily spot ETF net inflows, and whether the share of non-arbitrage institutional buying keeps rising;
- signals that profit-taking by long-term holders is fading, including changes in unrealized profit metrics and large transfer frequency on-chain;
- whether call open interest above $80,000 shifts to higher strikes after month-end and quarter-end expiry, easing gamma-related pressure;
- the liquidity backdrop in dollars and the effect of macro indicators, especially real Treasury yields, on overall risk-asset allocations.
James Mitchell says the market is going through a redistribution phase
James Mitchell describes the combination of eight straight ETF inflow sessions and repeated rejection at $80,000 as a textbook episode of liquidity restructuring and position transfer.
He says many retail traders fall into a simple linear view: if ETFs are buying in size, price should rise in a straight line. In his reading, that misses the way older holdings and market-maker hedging have to be absorbed at elevated levels. By comparing the growth slope in CME futures positioning with the pace of spot ETF subscriptions, he says it is clear that at least a meaningful share of recent institutional demand has come from delta-neutral capital seeking basis returns. That money improves market depth, but it does not actively consume the resting sell orders above the market in the near term.
Mitchell also argues that $80,000 is an overlap zone where coins from a previous cycle and profits from the current one are being realized. In his view, a period of heavy turnover there, combined with a gradual rise in the market’s cost basis to above $75,000, would be healthier than a thin breakout lacking support. For professional traders, he says the more important signals are when perpetual funding rates normalize and whether spot depth below $80,000 continues to improve.
Questions addressed in the article
Why have eight days of ETF inflows not produced a stable move above $80,000?
The article’s answer is that a large share of those inflows may belong to delta-neutral basis trades involving spot ETF purchases and futures shorts, which do not convert fully into one-way bullish momentum. At the same time, long-term holders and miners have been realizing profits near $80,000, while options market makers have been hedging around a crowded strike.
What is basis arbitrage, and why does it weaken the price impact of ETF buying?
As described in the piece, basis arbitrage occurs when futures trade above spot and hedge funds buy spot ETF exposure while simultaneously opening matching short futures positions to lock in the spread. ETF creations still require real Bitcoin purchases, but the derivatives hedge offsets directional exposure, leaving the trade broadly neutral rather than outright bullish.
What are long-term holders and miners doing near $80,000?
The article says holders with coins older than one year have stepped up transfers to exchanges as price approaches the level, using the rally to realize profits. Miners, meanwhile, have been selling spot holdings in a systematic way to cover post-halving electricity costs and fund hardware upgrades.
Why does $80,000 act as a wall in the options market?
Because it is the strike with the heaviest concentration of call open interest. The report says market makers carry large net short gamma exposure there and may need to sell or lean against upward moves in spot or futures as price approaches the level.
How do the dollar and rates affect the breakout attempt?
The article says the recent strength in DXY and real Treasury yields, supported by resilient economic data, has pulled some macro capital toward a more cautious posture. Large traditional asset managers therefore appear more inclined to buy on dips than to chase the market into a major resistance zone.
What indicators matter most from here?
The list in the article includes the quality and consistency of ETF inflows, signs that long-term-holder selling is fading, whether the options open-interest cluster migrates above $80,000, and whether derivatives funding conditions stay closer to neutral during any renewed breakout attempt.
The article ends with a disclaimer saying the information, data and analysis are for general reference only and do not constitute investment, financial, legal or tax advice, or a recommendation to trade any specific asset. It also says stocks, crypto assets and related derivatives are highly volatile and uncertain, and that investors should conduct their own research and evaluate their financial situation, objectives and risk tolerance before making decisions. MEXC Crypto Pulse says it does not accept legal liability for direct or indirect financial losses arising from reliance on the material.