

Bitcoin is showing conflicting technical signals after touching $80,000, leaving traders divided over where the market goes next. A Cointelegraph price analysis says weekly relative strength index, or RSI, readings are raising the possibility that Bitcoin’s current macro downtrend may be nearing an end.
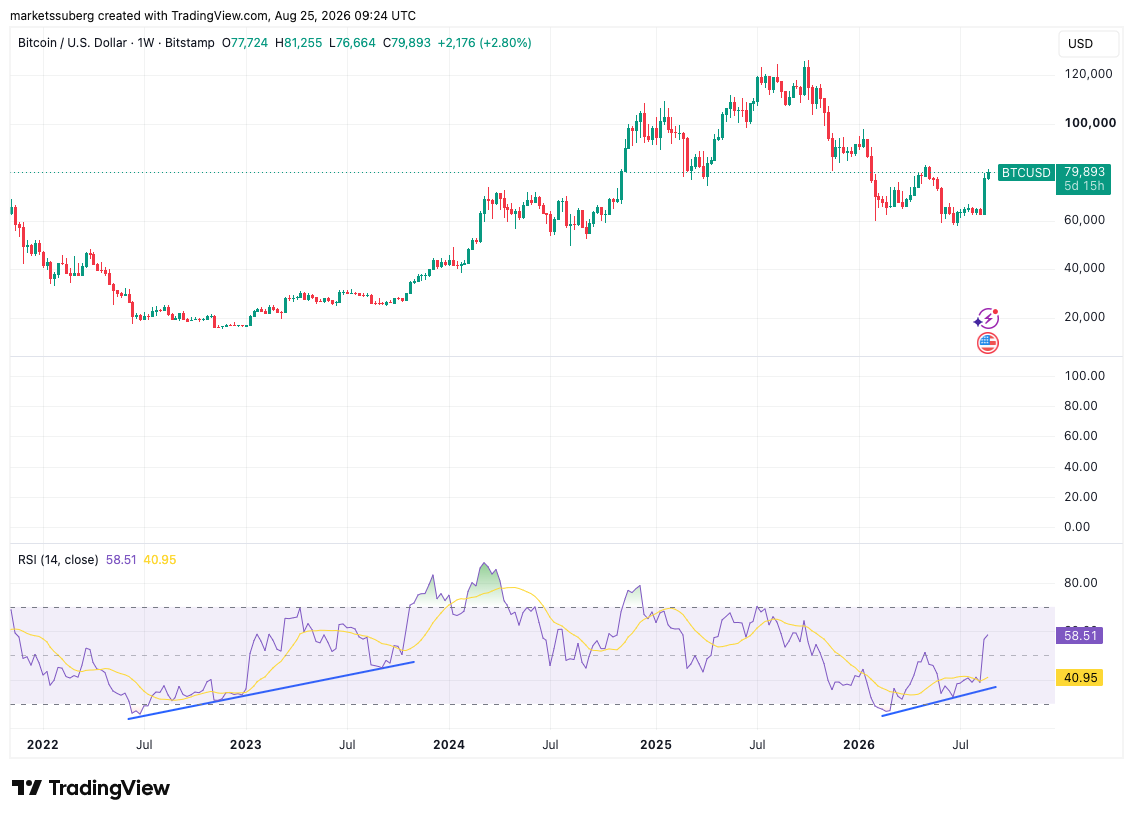
The debate has intensified after Bitcoin rebounded 25% last week. RSI readings on the daily, weekly and two-month charts are all feeding into the question of whether that recovery can hold.
RSI is a standard momentum indicator. It measures the strength of a trend by comparing an asset’s average gains and losses over a lookback period that is typically 14 days. In Bitcoin’s case, bullish divergences with price, where RSI makes higher highs while BTC/USD posts lower lows, have historically appeared around major turning points.
Weekly RSI mirrors the 2022 bear-market bottom setup
Cointelegraph notes that in mid-2022, roughly six months before Bitcoin’s last bear market ended, weekly RSI began to print a bullish divergence. RSI made higher lows while BTC/USD kept making lower lows. TradingView data now shows a similar pattern emerging in 2026.
Shorter-term RSI signals are less dependable as a guide to the broader trend, but the weekly setup has led some market participants to reassess whether the current bear market is still intact.
“Weekly is the timeframe that matters here, that’s where you read the secular trend and the cycle inflection points,” Jamie Coutts, chief crypto analyst at Real Vision, wrote in a post on X on Tuesday.
Coutts said weekly bullish divergences carry “real weight,” pointing to upside moves that followed earlier divergence events.
Bitcoin’s weekly RSI now stands at 58.3. According to the analysis, that is its highest reading since BTC/USD hit its latest all-time high of $126,200 in October 2025, and it has broken a pattern of lower highs.
Daily RSI enters overbought territory as traders split on meaning
On the daily chart, RSI has moved into overbought territory at 82.93. That is the highest reading since November 2024.
Traders are not reading that signal the same way. Some see the elevated daily RSI as a warning that a reversal could be close. Others argue that Bitcoin bull runs have often included several overbought phases, with RSI remaining above 70 for extended periods.
In his latest market analysis, PrimeXBT senior market analyst Jonatan Randin said the current setup also resembles late 2022. At that time, daily RSI jumped from 40 to 90 within a single weekly candle.
“An extreme move like this usually signals the start of something new,” he told his followers on X.
He added: “It doesn’t necessarily mean that the bear market is over but it is telling us something. I think what it’s trying to tell us is that we are about to enter a new phase of this cycle.”
Two-month stochastic RSI has now delivered the expected crossover
Cointelegraph said earlier that Bitcoin’s two-month stochastic RSI was being watched for a repeat of historical patterns that could offer a clearer signal on the end of the bear market.
Stochastic RSI puts more weight on recent price moves. A crossover between its two internal trend lines is commonly treated as a bullish trend-change cue, and that event has now taken place.
There is one notable difference from earlier cycle bottoms. The indicator only reached 4.81 this time, avoiding the near-zero macro lows that came before previous crossovers. That means the latest signal has appeared without fully repeating the deeper washout seen in past bear-market troughs.