
Overview
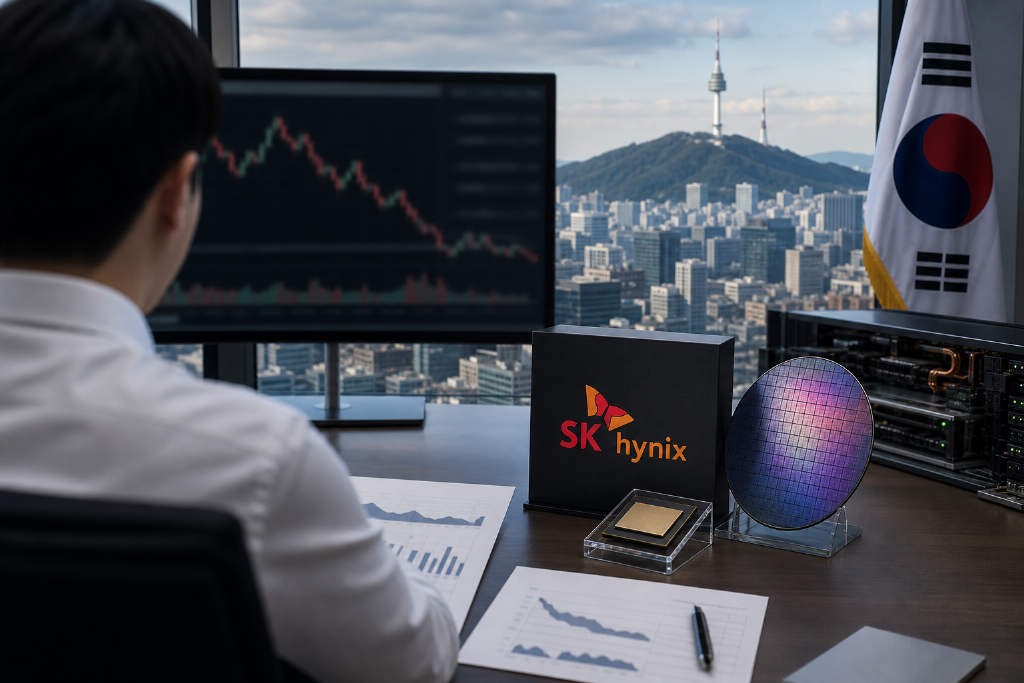
Two months ago, SK Hynix was the most valuable stock on the South Korean market. By Aug. 25, its shares had fallen roughly 45% from their record high. That day, the company’s production workers’ union rejected a previously negotiated wage agreement by a margin of 25 votes. The stock fell sharply intraday, then recovered much of the loss and closed down about 1.5% at KRW 1.646 million, while the Korea Composite Stock Price Index rose 0.2%.
Placed on a longer timeline, the picture looks very different. TradingView data shows 000660 hit an all-time high of KRW 2.987 million on June 25, with a 52-week low of KRW 253,000. In other words, the stock rose more than tenfold in a year and then gave back a large part of that move. The current price sits almost exactly around the midpoint of that advance, a level with clear technical weight.
For a high-beta name, the pullback itself is not the main signal. Where that pullback stops is the real signal. Ahead of Nvidia’s Aug. 26 earnings release, the more useful exercise is not to call direction, but to map the key levels and what each one implies.
Core setup: long lower shadow, 50% retracement, and buyback support
From a price-structure perspective, SK Hynix fell to an intraday low of KRW 1.557 million on Aug. 25 and closed at KRW 1.646 million, versus KRW 1.671 million at the prior close. The stock sold off hard early, then clawed back most of the decline, leaving a long lower shadow on the daily candle. On its own, that looks like absorption. It still needs confirmation in the following sessions.
Using the 52-week range from KRW 253,000 to KRW 2.987 million, the 50% retracement sits near KRW 1.62 million, the 38.2% retracement near KRW 1.943 million, and the 61.8% retracement near KRW 1.297 million. The stock is trading almost directly above the 50% level, making it the central technical reference point in the current correction.
On the sell-side, roughly 38 to 39 analysts covering the stock all carry buy-equivalent ratings, with no sell recommendations. The average 12-month target price is about KRW 3.16 million, while the highest estimate stands at KRW 5.3 million and the lowest at KRW 1.2 million. A spread of more than four times between the extremes points to unusually wide disagreement over the memory cycle.
At the company level, SK Hynix announced a KRW 40 trillion share buyback plan on Aug. 19. That is one of the most important fundamental variables in this drawdown.
From Korea’s largest stock to a 40%-plus retracement
The June peak
To understand the nature of this pullback, the scale of the earlier rally matters. According to KED Global, SK Hynix rose 5.6% on June 22 to close at KRW 2.919 million, after touching KRW 2.945 million intraday. Its market capitalization surpassed Samsung Electronics for the first time, making it South Korea’s most valuable listed company. It was the first such leadership change in more than 25 years. That session also marked the stock’s eighth straight daily gain.
Three days later, the stock printed its all-time high at KRW 2.987 million. TradingView’s market description said that by mid-2026, SK Hynix at one point accounted for more than half of the total market capitalization of the Korea Exchange. When a single company carries that much weight in a country’s main equity market, the index itself starts to behave like a proxy for the stock, and any pullback can be amplified by broader fund flows.
What kind of correction this is
From KRW 2.987 million down to KRW 1.646 million, the decline is about 45%. In an ordinary stock, that would often be framed as a bear-market move. In a stock that had risen more than tenfold over 52 weeks, it looks closer to a correction of a parabolic advance. TradingView lists the stock’s volatility at about 3.31% and its beta at about 1.77, placing it firmly in the high-beta category.
The decline should not be reduced to a single headline. AI-related valuations globally have already gone through several rounds of adjustment. Asian semiconductor names broadly saw positioning cuts ahead of Nvidia earnings. The wage negotiations are a newer variable layered on top. Treating the full 45% drop as a labor issue would miss the actual structure of the move.
What the rejected wage agreement means
A 25-vote margin
The vote was extremely close. According to South Korean media reports, 50.08%, or 7,535 votes, opposed the agreement, while 49.92%, or 7,510 votes, supported it. The gap was just 25 votes, with turnout at 93.81%. On the same day, the technical and office workers’ union approved the same agreement by roughly 60%. The two unions negotiate separately with management, and the outcomes apply independently.
The rejected agreement included a 6.3% wage increase and a structural change to profit-sharing bonuses: 60% would be paid in company stock and 40% in cash. It also raised the housing loan limit for married employees from KRW 100 million to KRW 200 million and included a price-protection formula for the stock-based portion, using the lowest closing price among the earnings guidance date, the cash payment date, and the stock payment date.
The real disagreement was not over the wage increase. It was over the payment mix. According to TradingKey’s analysis, the company had previously committed 10% of annual operating profit to employee bonuses, and earlier estimates suggested the average 2026 payout per employee could be sizable. Once the pool gets that large, tying 60% of it to the share price means workers take both income risk and market risk. After the stock had already fallen around 40% from its peak, resistance to that structure was understandable.
Production impact versus valuation impact
Based on the facts available, the rejection does not currently imply a production disruption. It means negotiations return to the table. Investing.com also stated in its report that the narrow margin does not itself suggest immediate damage to output.
It does, however, add two variables on the valuation side. The first is uncertainty on the cost line. A renegotiated package could include a higher cash ratio or a larger total payout, which would affect expense structure over the coming quarters. The second is subtler: the vote revealed that internal views on stock-based compensation are not uniform. When roughly half of the workforce does not want to accept stock for that part of compensation, outside investors are likely to note it, even if that does not amount to a judgment on the company’s operating fundamentals.
One distinction matters here. Employee risk preferences should not be treated as the same thing as a view on the company’s prospects. Employees are managing concentration risk in personal income, not making a portfolio allocation decision.
Key levels and volatility structure
Support levels below
The nearest support is KRW 1.557 million, the intraday low from Aug. 25. The stock found visible buying there and recovered to close at KRW 1.646 million. Whether that low holds in the next few sessions is the first test of whether the long lower shadow means anything.
The second layer is the 50% retracement of the 52-week range, near KRW 1.62 million. The current price is almost exactly above it, and together with KRW 1.557 million it forms a dense support band roughly 4% wide. Technically, once this kind of zone gives way, prices can accelerate lower because there is little intermediate trading structure to slow the move.
The third layer is the round-number mark at KRW 1.5 million. It does not have independent technical meaning on its own, but round numbers in high-priced stocks often line up with options strikes and structured product levels.
Deeper down, the 61.8% retracement near KRW 1.297 million sits close to the low end of some sell-side targets. That level is not a base-case destination, but it is still the reference point for an extreme correction scenario.
Resistance above
The first resistance is KRW 1.671 million, the Aug. 24 close and the starting point of the latest drop. Reclaiming that level would suggest the market has fully absorbed the shock from the wage vote.
The second is the recent intraday high area around KRW 1.687 million.
The third is the round-number barrier at KRW 2 million, about 21% above the current level.
The fourth is the 38.2% retracement near KRW 1.943 million. Together with KRW 2 million, it forms a thicker resistance band. This is the more meaningful medium-term upside test in the current decline. Only a move back above that zone would indicate that the downtrend structure has been broken.
As for the former peak area between KRW 2.919 million and KRW 2.987 million, the stock would need to rise more than 77% from the current price to get back there. Without a fresh industry-cycle catalyst, that range is not a realistic short-term reference.
Why the stock’s high-beta profile changes stop-loss logic
For a stock with about 3.31% volatility and a beta near 1.77, conventional percentage stop-loss rules can fail often. The move between KRW 1.557 million and KRW 1.687 million on Aug. 25 alone was more than 8% intraday. That means stop levels set 3% to 5% away can be triggered on an ordinary trading day, regardless of whether the broader thesis is right.
A more suitable approach for this type of name is to place risk limits beyond structural levels rather than beyond fixed percentages, while reducing position size accordingly. For investors tracking the stock across markets, products on platforms such as MEXC can offer a way to watch sentiment outside Korean trading hours, though basis risk versus actual Seoul prices remains relevant.
What fundamentals say about these technical levels
Earnings are still expanding
Technical levels tend to matter longer when fundamentals back them up. Financial data compiled by CNN shows SK Hynix’s latest quarterly revenue rose 40.82% year over year and 47.19% quarter over quarter. Net income increased 108.11% year over year and 126.97% quarter over quarter. Earnings per share rose 103.85% year over year. The pattern is notable because sequential growth outpaced annual growth, pointing to acceleration rather than slowdown.
On profitability, the company posted an operating margin close to 76% in the latest quarter, a rare level for a manufacturing business and one that reflects HBM pricing power under the current supply-demand balance. TradingView lists EBITDA at about KRW 143.58 trillion, with a margin near 62.89%.
That helps explain why buyers have still appeared after a 45% drawdown. On current earnings, valuation has moved away from the prior extreme and back into a range investors can debate.
The KRW 40 trillion buyback
On Aug. 19, SK Hynix announced a KRW 40 trillion buyback plan. Around the same time, BofA Securities issued a buy rating, while Morgan Stanley analysts maintained a bullish view based on a stronger shareholder-return framework and improved free-cash-flow prospects.
The technical importance of the buyback is simple: it may create a non-market source of demand. If the company is repurchasing shares across a specific price zone, a support level on the chart gains backing from actual capital rather than from psychology alone. What matters more for investors is the pace of execution, not just the authorized size, because buyback approvals and actual purchases often differ by a wide margin.
At the same time, the rejected wage package would have paid 60% of bonuses in company stock, which would mechanically offset part of the buyback effect. If renegotiation leads to a higher cash ratio, the company would face more cash expense but less dilution pressure. Those forces point in different directions for the stock.
External variables: Nvidia earnings, competition, and capacity expansion
The biggest variable ahead for SK Hynix is not on its own calendar. Nvidia reports earnings on Aug. 26, and Asian semiconductor names have been tense into that release. As a major supplier of HBM, SK Hynix’s revenue depends directly on AI accelerator shipment trends, so Nvidia’s next-quarter guidance acts as an indirect read on order visibility.
The second variable is competition. Samsung Electronics has already launched a new-generation HBM4 product and is trying to enter major customer supply chains. In the memory business, supply-side concentration has long been a key determinant of margin durability. Once a second supplier wins large-scale qualification, the price center can come under pressure. There is no sign yet that this shift has already happened, but it remains a risk that valuation models need to reserve for.
The third variable is capacity expansion. Media reports have said SK Hynix is considering building a memory plant in Miyagi Prefecture, Japan, with possible investment of tens of trillions of won. If confirmed, a project of that scale would alter both the capex curve and mid-term supply assumptions. As of now, that information comes from media reports and has not been formally confirmed by the company.
The company’s next earnings release is expected on Oct. 27. Before then, the lack of scheduled disclosure catalysts means the stock is likely to trade mainly on sector beta, labor-negotiation developments, and buyback execution over the next two months.
James Mitchell’s published framework
James Mitchell’s central point is that the most informative feature right now is not the union vote by itself, but the fact that the stock has stopped almost exactly near the 50% retracement of its 52-week range. From KRW 253,000 to KRW 2.987 million and back to KRW 1.646 million, the market erased half of a year’s advance in a little over 40 trading sessions. The 50% mark carries strong psychological weight because it matches the most intuitive framing possible: half the gain has been given back. Whether the stock can hold that area says more about whether the upcycle is over than any single news item does.
He also argued that the market’s easiest mistake is to read the union vote as evidence of fundamental deterioration. The disagreement was about how the bonus would be paid, not about the bonus amount and not about the company’s operating condition. A company able to set aside 10% of annual operating profit for bonuses is, by definition, still generating very high profitability. Workers refusing to tie 60% of that income to the share price reflects avoidance of personal income concentration risk, not the same logic used for portfolio positioning.
Another underappreciated detail, in his view, is the shape of the Aug. 25 candle. The stock fell to KRW 1.557 million intraday and closed at KRW 1.646 million, leaving a long lower shadow on a day dominated by negative headlines. When a market absorbs bad news yet recovers most of the decline by the close, it often means selling pressure was absorbed at a specific price zone. Public data does not show whether the buyer was the company, passive index money, or active funds, but the level deserves repeated testing in the weeks ahead.
From a risk-management standpoint, Mitchell places higher priority on three data points than on price alone. First, the actual progress of the KRW 40 trillion buyback, because the gap between authorized capacity and real purchases determines how much money sits behind chart support. Second, the structure of any revised wage proposal after talks resume, since a change in the cash-versus-stock split affects expenses and dilution in opposite ways. Third, the relative performance of SK Hynix versus Samsung Electronics after Nvidia earnings. If the broader semiconductor group strengthens while SK Hynix lags, that could indicate the market is beginning to move from a single-supplier HBM pricing framework toward a multi-supplier one. That would matter more than any standalone chart level.
He also uses the case to make a concentration point. When one stock accounts for more than half of a country’s main equity index, the risk profile of the index changes in a basic way. Passive money tracking that index is, in practice, holding a concentrated high-beta position in a single company. Similar concentration patterns can be found in AI-related assets, and the dependence of the crypto market on Bitcoin falls into the same broad category. His framework is based on public information and public data calculations and does not amount to a directional call.
Key takeaways from the FAQ portion
Why the stock has fallen
The recent decline has been driven by multiple factors rather than one event. Global AI-related valuation resets, broad pre-earnings position trimming in Asian semiconductor stocks ahead of Nvidia’s Aug. 26 report, and the Aug. 25 rejection of the wage agreement by the production workers’ union all fed into the move. The stock closed down about 1.5% at KRW 1.646 million that day and is roughly 45% below the June 25 record high of KRW 2.987 million.
Will the union vote affect production?
There is no sign at this stage of an immediate production impact. The result means labor and management return to negotiations. The rejected deal included a 6.3% wage increase and a 60% stock, 40% cash split for profit-sharing bonuses. The dispute centered on the form of payment rather than the level of pay. The technical and office workers’ union approved the same agreement by roughly 60%.
Where are the key support and resistance levels?
The nearest support is KRW 1.557 million, followed by the 50% retracement at KRW 1.62 million, together forming a support cluster about 4% wide. Below that sits the KRW 1.5 million round number and then the 61.8% retracement near KRW 1.297 million.
On the upside, the first resistance is KRW 1.671 million, the Aug. 24 close, followed by the recent intraday high area near KRW 1.687 million. The more important medium-term resistance band runs from KRW 1.943 million to KRW 2 million. The former is the 38.2% retracement and the latter is a round-number level. The old high zone between KRW 2.919 million and KRW 2.987 million remains more than 77% away from the current price.
How do analysts and fundamentals look?
Roughly 38 to 39 analysts covering the stock all have buy-equivalent ratings, with an average 12-month target of about KRW 3.16 million. The range, however, is very wide: KRW 1.2 million at the low end and KRW 5.3 million at the high end. On fundamentals, latest-quarter revenue rose 40.82% year over year and 47.19% quarter over quarter, net income rose 108.11% year over year and 126.97% quarter over quarter, and operating margin was close to 76%. The company also announced the KRW 40 trillion buyback on Aug. 19.
What risks matter most now?
Three areas stand out. First is competition, with Samsung Electronics pushing next-generation HBM4. Second is the structure of any renegotiated wage package, especially changes in the cash-versus-stock split. Third is trading risk tied to the stock’s own volatility profile. With volatility at about 3.31% and beta at about 1.77, intraday swings can exceed 8%, reducing the usefulness of standard percentage stop-loss rules.