



Key focus of the week: Bitcoin’s daily structure has turned bearish—can the short-term rebound convincingly break above the upper rail of the descending channel? Has HYPE’s seven-wave rally reached its terminus? The following analysis systematically dissects current market structure across multiple timeframes and outlines actionable medium- and short-term trading plans.
BTC Multi-Timeframe Channel Analysis
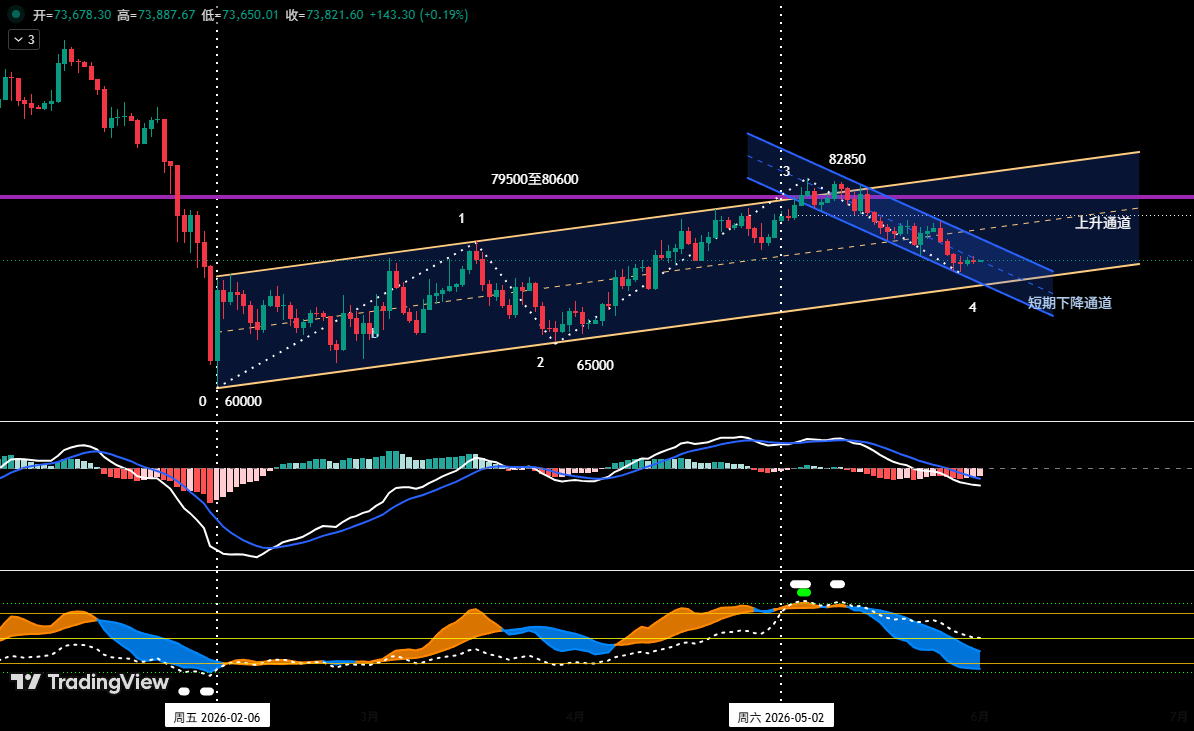
As shown in Figure 1, Bitcoin has been advancing within an ascending channel (yellow) since the 6 February low. The lower boundary connects the troughs of 6 February and 29 March, while the upper boundary is drawn parallel through the 17 March high. Concurrently, since the 6 May peak at $82,850, price has traced out a shorter-term descending channel (blue), with the upper rail linking the highs of 14 May and 26 May, and the lower rail linking the lows of 7 May and 23 May.
At present, price has already lost the midline of the ascending channel and is seeking stronger support at the lower rail. Within the descending channel, BTC found temporary support near the lower rail (around $72,500) and is now engaged in a weak corrective bounce toward the upper rail. Overall, the bounce is merely repairing oversold conditions and targets the upper rail of the descending channel. However, because the price has broken below the midline of the ascending channel, the broader technical structure has weakened. Once the bounce runs its course, price is likely to resume the prior downtrend and test the support of the ascending channel's lower rail.
BTC 4-Hour Structure and Short-Term Strategies
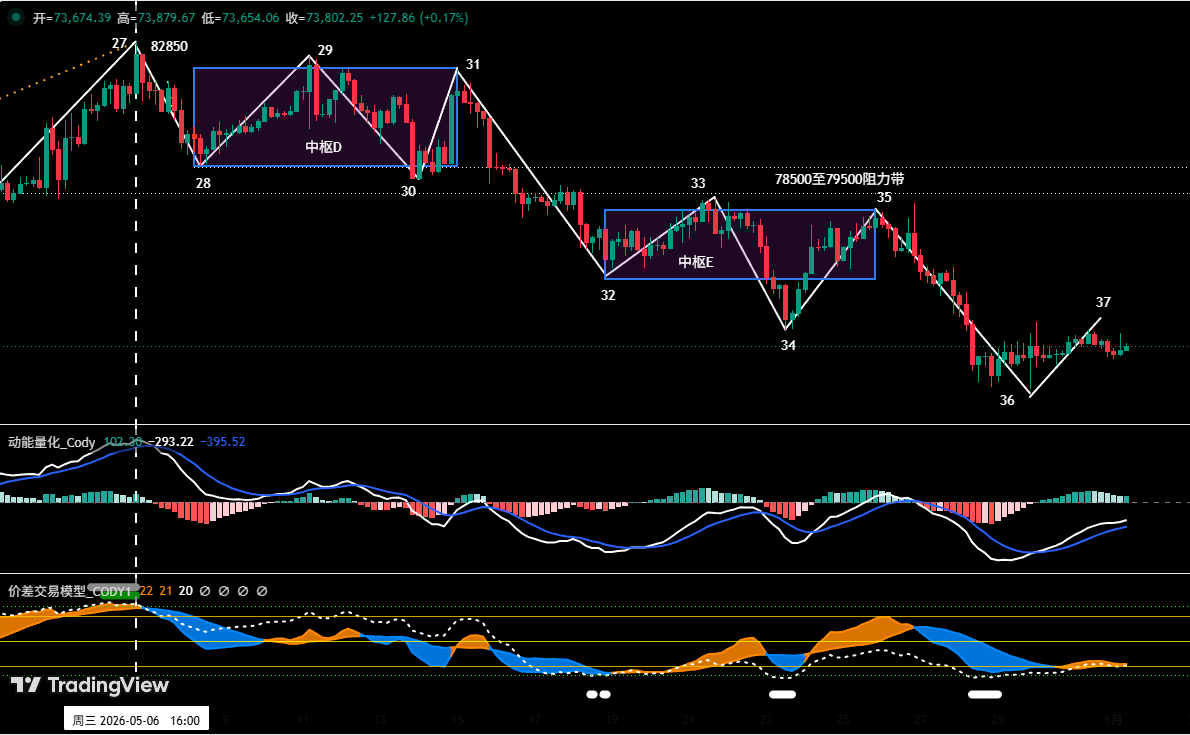
The 4-hour chart (Figure 2) reveals that the correction from the 6 May high of $82,850 has unfolded as a ten-segment structure (27-28 through 36-37). Two consolidation zones are nested within: segments 28-29, 29-30 and 30-31 overlap to form Zone D, while segments 32-33, 33-34 and 34-35 form Zone E. The market is currently traveling through segment 36-37, an upward retracement. If the bounce stalls and reverses upon reaching the $75,000–$76,000 area, the path of least resistance remains downward, with a test of support between $69,500 and $70,500.
Key resistance levels: first at $75,000–$76,000 (near the lower boundary of Zone E), second at $78,500–$79,500 (around the upper boundaries of both zones). Key support levels: first at $69,500–$70,500, second near $65,000.
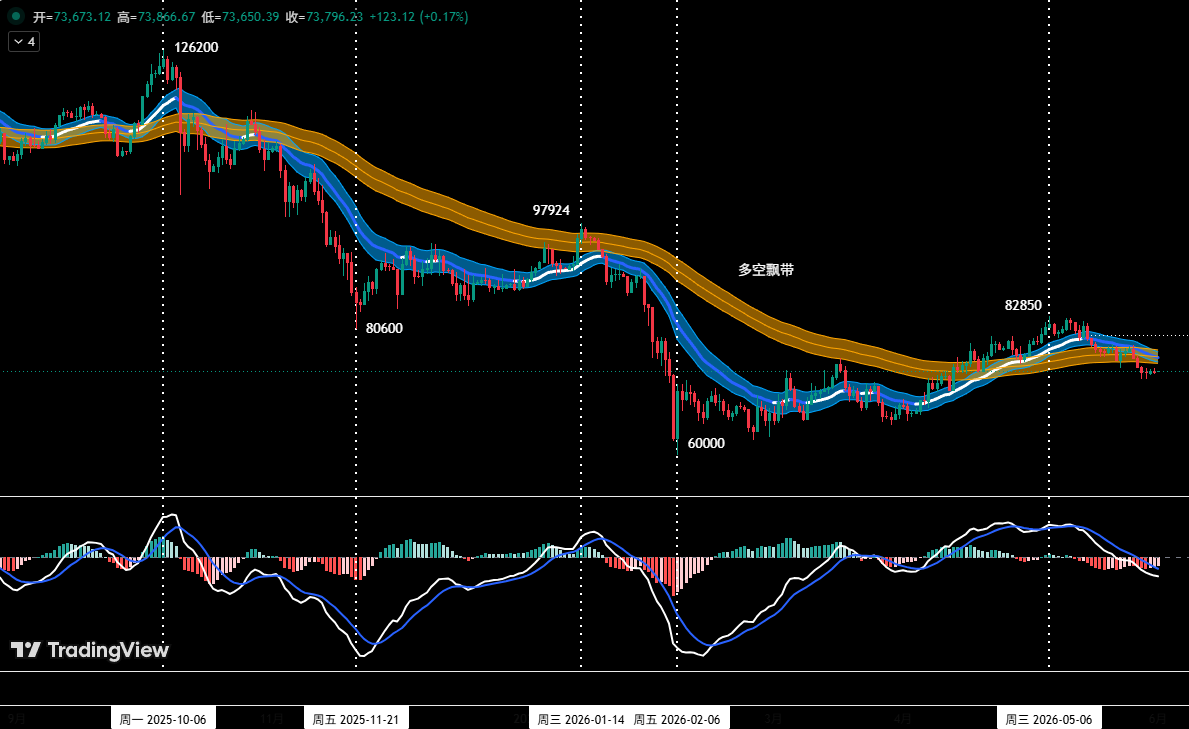
Short-term strategy: use up to 30% of capital, relying on support and resistance zones, and trade divergences on the 30-minute to 60-minute timeframes. Two specific action plans are prepared:
Plan A: If price rallies into the $75,000–$76,000 zone and encounters resistance, confirmed by top signals from the quantitative model, open a short position of up to 30%. Place the initial stop-loss above $77,000. Close the position gradually as price approaches key support levels alongside model-based exit signals.
Plan B: If price effectively breaks below the $69,500–$70,500 support zone with model confirmation, open a short position of up to 30%, with an initial stop above $72,000. Scale out of the trade as the decline reaches major support and the model provides coherent signals.
HYPE Seven-Wave Structure and Top Signals
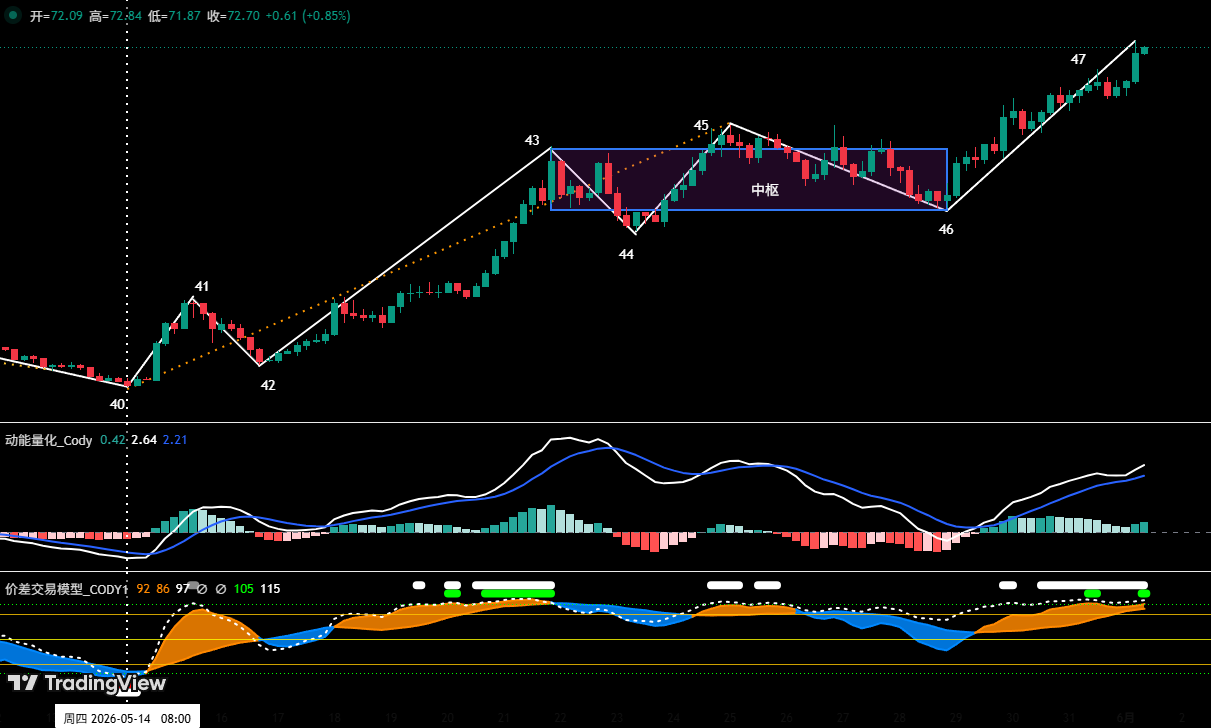
On the 4-hour chart, HYPE has built a distinct seven-wave advance (segments 40-41 through 46-47) since the 14 May low of $38.14, containing one ascending consolidation zone. Segments 43-44, 44-45 and 45-46 overlap to form that zone. At point 45, momentum divergence and the proprietary spread trading model’s top warning signaled a local peak; price subsequently corrected from $64.75 to $56.30, a maximum decline of 13.05%. Currently, the exit segment 46-47 exhibits waning momentum compared with the entry segment 42-43, creating a potential “momentum back-divergence.” Point 47, meanwhile, has triggered a strong top warning (red dot + white dot) from the spread trading model.
HYPE Strategy and Risk Management This Week
The key observation this week is whether the momentum back-divergence at point 47 is confirmed. If the divergence holds and price subsequently breaks below the $62.5–$64.57 support zone, point 47 can be regarded as the terminal point of the rally that began on 14 May. The short-term approach should be “buy on dips, avoid chasing rallies.” Watch how price reacts upon retesting the $62.5–$64.75 area: if it stabilizes and both models issue bottom signals, a light long position (no more than 30% of capital) may be considered, with strict stop-loss discipline. Conversely, if price cleanly breaks below this zone, the correction will likely escalate to a daily-degree retracement, with the initial downside target at the $54–$56.3 area.
Last Week’s Short Trade Review
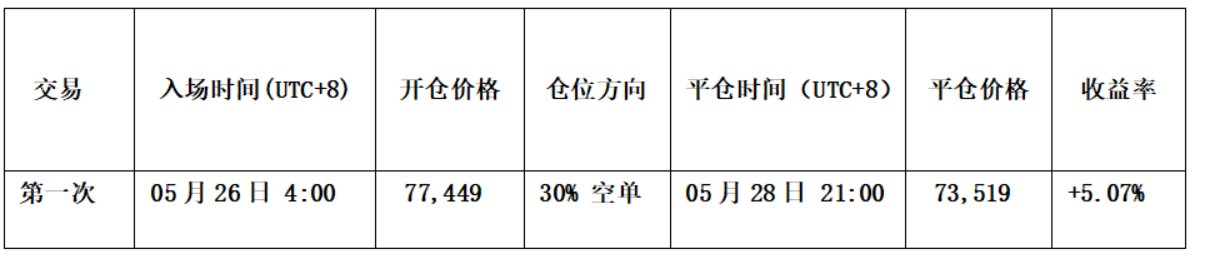
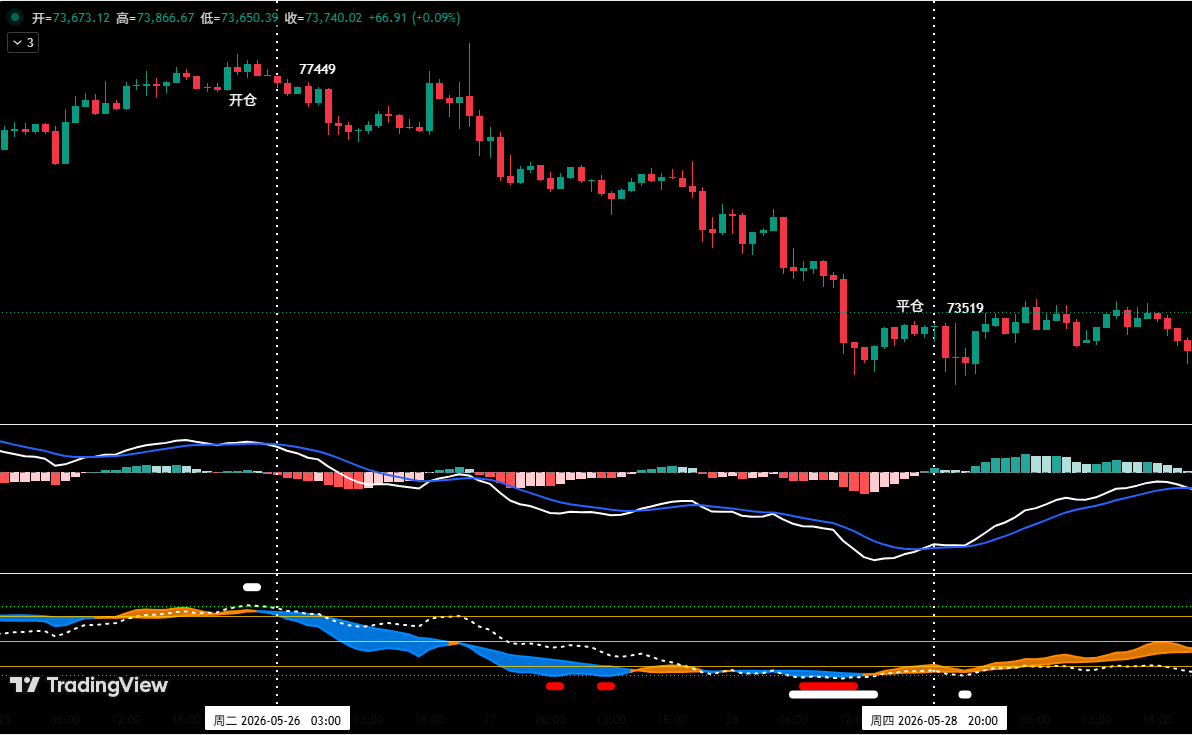
Following strict adherence to the spread trading and momentum quantification models, we executed one short trade last week (1x leverage) that yielded a profit of approximately 5.07%. Entry rationale: price rallied into the $78,000 vicinity and showed exhaustion, forming a bearish top-fractal candlestick pattern. The spread trading model emitted a top warning (white dot), and the momentum model confirmed a bearish divergence. A 30% short position was entered at $77,449. Exit rationale: as price declined toward $73,000, it displayed stabilization signals and a bottom-fractal pattern. The spread trading model triggered a strong bottom warning (red dot + white dot), which resonated with the momentum model’s bottom signal. The entire position was closed near $73,519.

Money Management and Disclaimers
Upon opening a position, immediately set the initial stop-loss. Once the trade reaches 1% profit, move the stop to breakeven. At 2% profit, trail the stop to lock in 1% gain. Thereafter, for every additional 1% of profit, raise the stop by 1% to dynamically protect accrued gains. Financial markets are fast-moving; all analysis and strategies must be adjusted in real time. The views, models and strategies discussed herein are derived solely from personal technical analysis and serve as a personal trading journal. They do not constitute investment advice. Markets involve risk; trade cautiously and do not base decisions solely on this content.