

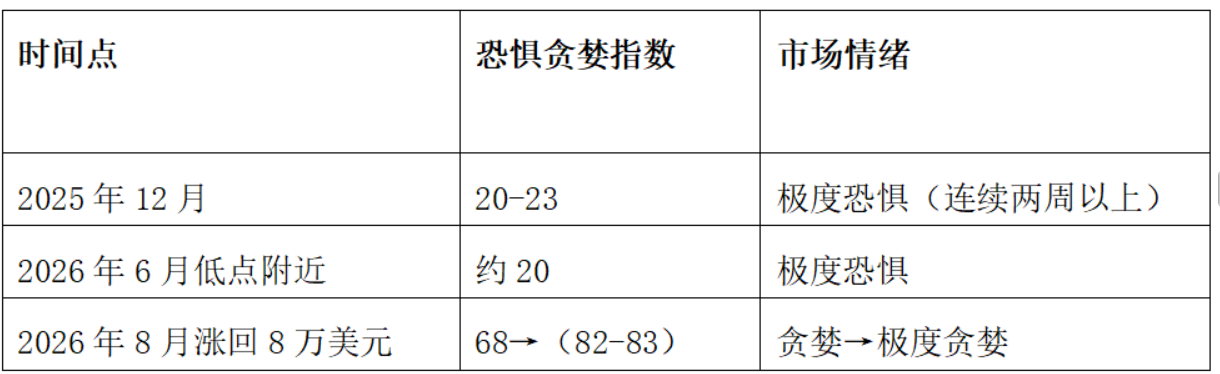
An Odaily guest analysis said Bitcoin sentiment has moved from “extreme fear” to “extreme greed” this week, but BTC still has not delivered a confirmed reclaim of its 52-week moving average near $81,700. Under the framework laid out in the report, the current move is still better classified as an oversold rebound than a confirmed bull market return.
Sentiment has reversed, but the trend test is still incomplete
The article says market mood turned sharply after nearly two months of recovery in BTC, with the past two weeks bringing a faster climb. That shift has changed how many market participants read the rally, with more views leaning toward a “bull market return.” The report, however, checks that idea against a technical framework instead of treating sentiment alone as confirmation.
Using a weekly chart and a review of nearly nine years of historical data, the analysis argues that the 52-week moving average has repeatedly served as a practical line for identifying major bull-bear cycle turns. It breaks that signal into two parts: position relative to the moving average and a confirmation period for a breakout or breakdown.
- Bull market environment: price remains above the 52-week moving average and the slope turns upward.
- Bear market environment: price remains below the 52-week moving average and the slope continues downward.
- Transition or choppy phase: price moves back and forth around the average while the slope flattens.
For a valid bear-to-bull turn, the report says weekly closes must hold above the line for 2-3 consecutive weeks. A single weekly spike above the average followed by a retreat is treated as a false breakout. For a bull-to-bear turn, two straight weekly closes below the average would be needed, while a one-week wick lower would not count.
BTC is near $81,700, but both confirmation conditions remain unmet
Based on that model, the piece says BTC has approached the 52-week moving average at about $81,700, yet has not achieved an effective breakout. At the same time, the moving average is still trending lower. The two conditions the article uses for a bull-market call — two consecutive weekly closes above the average and an upward turn in the slope — are both still absent.
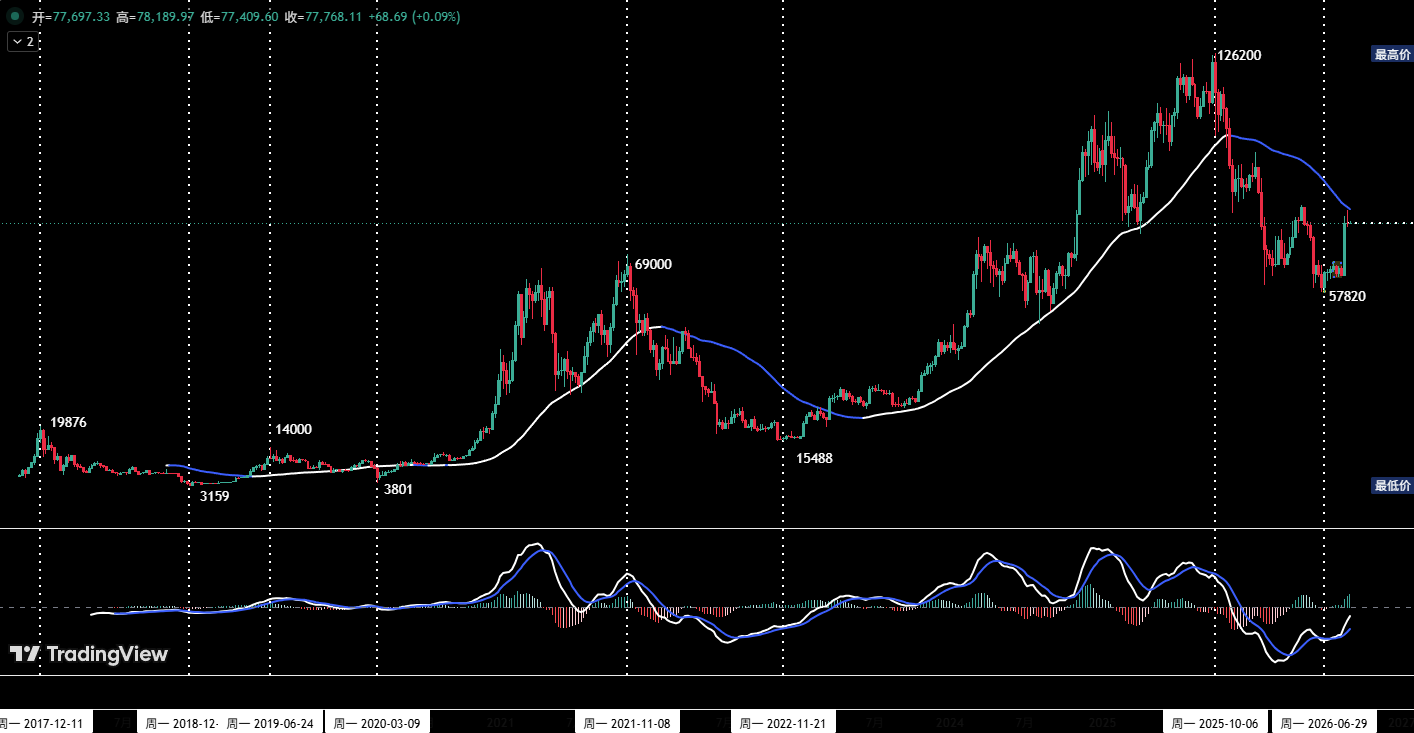
That is why the report describes the current market as being in a transition and confirmation phase rather than in a confirmed bull cycle.
Daily structure points to the end of point 5 and a possible center B build
On the daily chart, the analysis revisits BTC’s rebound from the July 1 low of $57,820. Earlier commentary had used wave theory to map that advance. This time, the author adds Chan theory to restate and cross-check the same move.
According to the article, BTC has formed a five-leg rebound structure from (0-1) through (4-5) since the July 1 low. Within that sequence, the (1-2), (2-3), and (3-4) legs overlap and form the first upward consolidation center, labeled center A. Price is now in the segment leaving center A, marked as (4-5).
The report compares the momentum of the entry leg into center A, or (0-1), with the departure leg, or (4-5), and says the latter is clearly stronger. Because it does not see momentum divergence there, the analysis infers that once the (4-5) move ends, BTC is likely to enter a broad 2-3 week consolidation and build a second upward center, or center B.
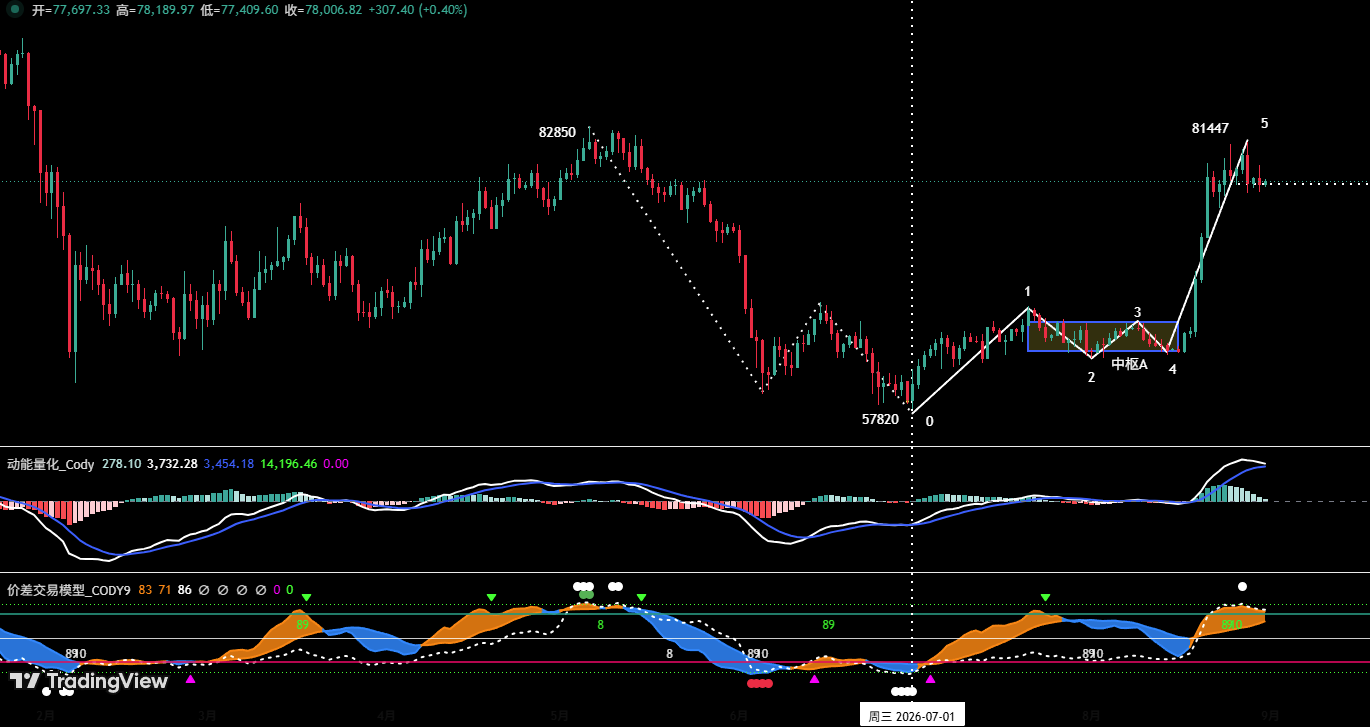
After that structure is completed, the next segment leaving center B could temporarily lift BTC above the 52-week moving average and send price toward the key resistance level at $82,850, setting a fresh rebound high. The article says that stage would require renewed follow-up assessment.
Key BTC levels for the week
The report says the main focus this week is the final location of “point 5” on the daily chart and the possible construction of a second upward center.
Resistance
- First resistance zone: $81,700-$82,850
- Second resistance zone: around $84,500
- Third resistance zone: around $90,000
Support
- First support zone: $73,500-$75,000
- Second support zone: $67,300-$69,100
BTC strategy in the article: flat on the medium-term view, 30% size for short-term spread trades
The trading section says the plan excludes the impact of sudden news events.
For medium-term positioning, the article refers to a position-monitoring model and says BTC has already broken above the “bull-bear channel,” bringing a short-term change in market structure. Even so, the current medium-term position is still zero, and the stance remains flat for now.
For short-term trading, the report suggests using 30% position size with predefined stop-loss levels, looking for spread opportunities between support and resistance zones on 30-minute or 60-minute trading windows.
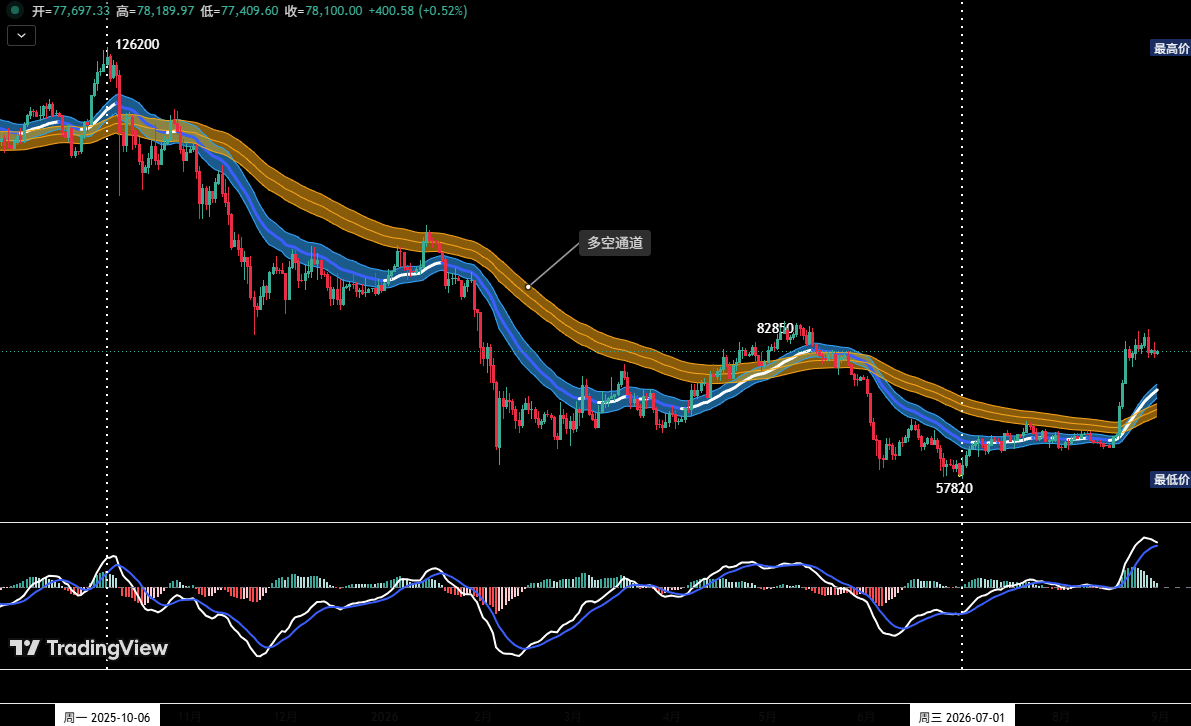
The setup described is specific: if price pulls back to either of the two major support zones, shows a clear stabilization pattern, and the quantitative model also flashes a bottom signal, traders could open a long position of roughly 30%. An initial stop should be placed immediately, and positions may then be reduced gradually near major resistance if model signals align.
HYPE is also seen building center B
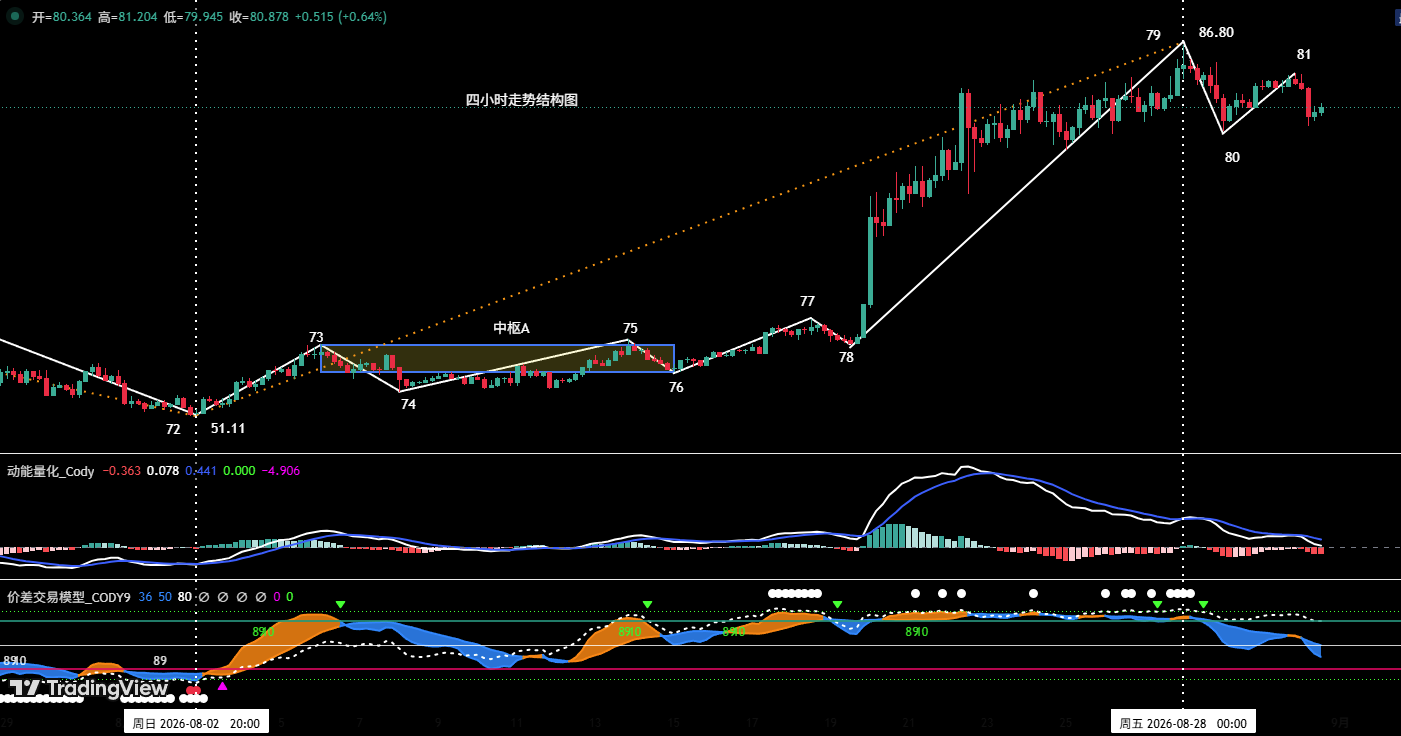
The article applies the same structural analysis to HYPE. On the 4-hour chart, it says the advance from the Aug. 2 low of $51.11 can be broken down into a nine-leg structure running from (72-73) to (80-81).
Within that move, the (73-74), (74-75), and (75-76) legs overlap and form the first upward center, or center A. The report then compares the entry leg (72-73) with the departure leg (78-79) and says the departure leg is clearly stronger, with no sign of momentum divergence between the two.
From that, the article concludes that after the end of the (78-79) segment, the current (79-80) and (80-81) moves are likely building the second upward center, center B. Once that structure is complete, HYPE would move into a new departure segment from center B.
HYPE levels and short-term plan
The piece says the key for HYPE this week is the point at which center B finishes forming.
- First resistance: around $87-$90
- First support: around $77
- Second support: around $73
For traders already holding longs opened in the $50-$52 area under the earlier plan, the article suggests raising the initial stop to around $70 to protect existing gains while staying in the trade. For those without a position, it says a pullback into the $73-$77 support area, followed by stabilization and a clear buy signal, could justify a light long position with a stop-loss in place.
Risk-control rules in the report
The article closes with a four-step risk framework: set an initial stop as soon as a position is opened; move the stop to breakeven once profit reaches 1%; move the stop to the 1% profit level once gains reach 2%; then lift the stop by another 1% for each additional 1% move in profit.
The author also says that all market analysis, models, and strategies in the piece are part of a personal trading log and do not constitute investment advice or an operational basis for decision-making.