

MarsBit has published a market analysis by Benson Sun, a former FTX community partner, arguing that Bitcoin may be entering not just another bull market, but a larger one. The article starts with the week of Aug. 22, when BTC rose 24%, and says the debate that followed split between calls for a new bull run and doubts that the move could last.
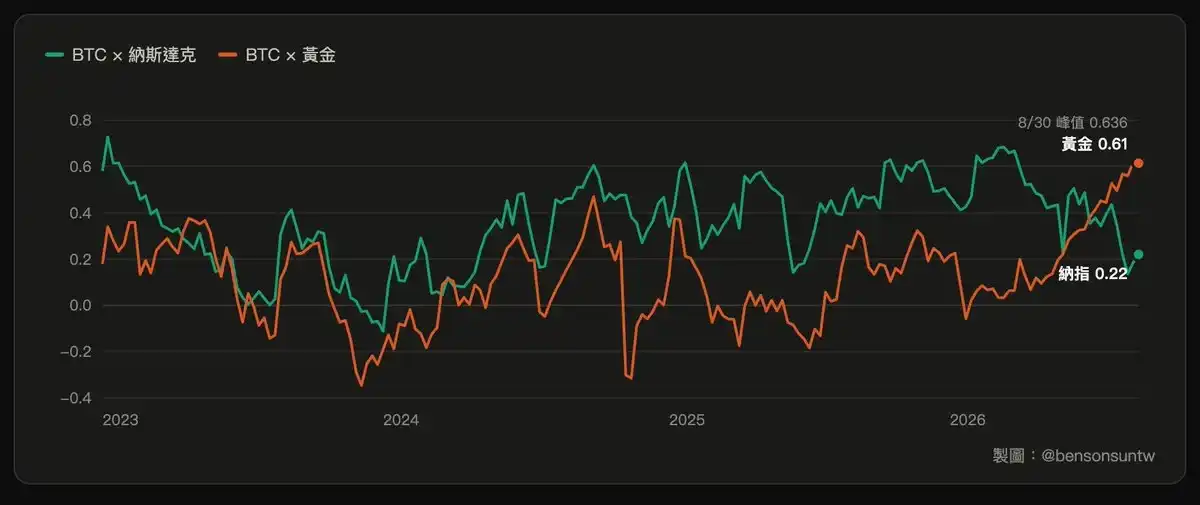
Bitcoin moved with gold while the Nasdaq fell
Sun’s main observation is that Bitcoin’s latest surge did not resemble the pattern traders have grown used to over the past several years. During the same week that BTC jumped, gold gained 5.6% and the Nasdaq slipped 2.1%.
The article says Bitcoin has often traded like a high-beta technology stock: when risk appetite lifted U.S. equities, BTC tended to rise with them; when liquidity tightened, Bitcoin usually fell harder. This time, Sun writes, the structure changed. After Aug. 17, BTC and gold both strengthened while the Nasdaq stayed largely flat.
He points to a steady rise in the 60-day correlation between Bitcoin and gold since May. That measure reached 0.636, close to the historical high of 0.64 recorded in November 2020, versus a long-term median of just 0.12. Over the same stretch, Bitcoin’s correlation with the Nasdaq fell to 0.13 before rebounding to 0.22.
Sun says readings above 0.5 on the BTC-gold correlation line are rare. Since Bitcoin began trading, only 2.2% of trading days have met that condition. Before the current episode, he says, there had been only two prior periods: August 2020 and October 2022.
Two earlier cases are used as historical reference points
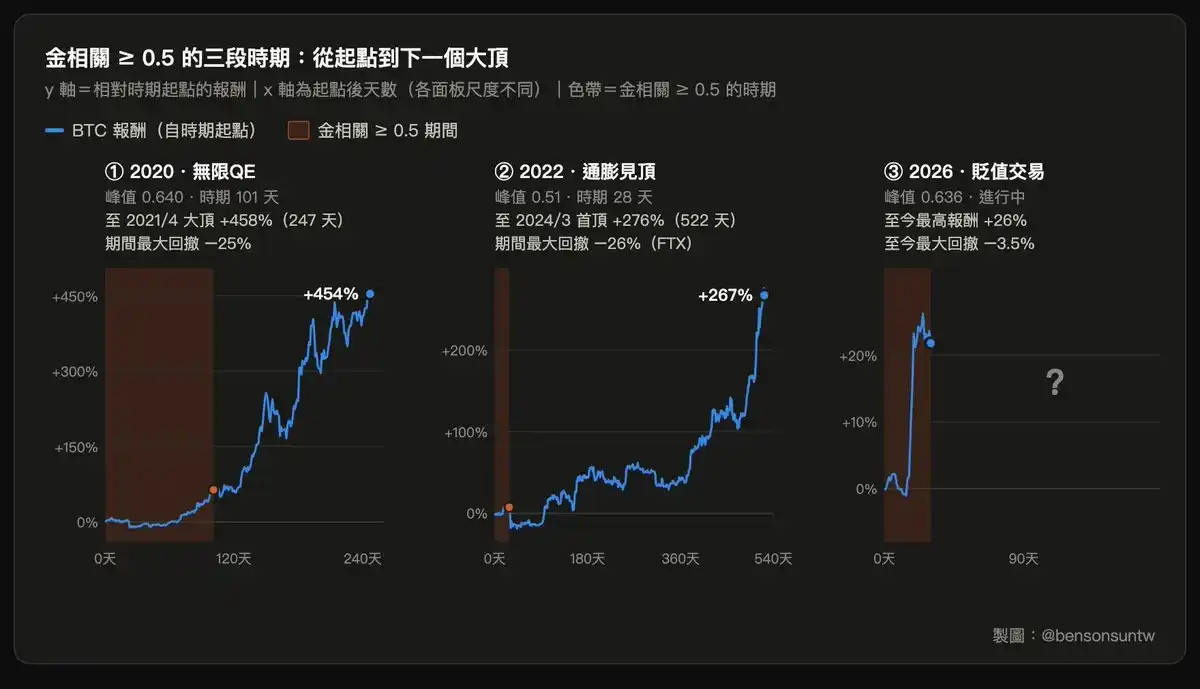
The article looks back at August 2020 as the eve of the last major leg higher in Bitcoin’s bull cycle. At the time, BTC was still moving sideways around $10,000 to $12,000. A few months later it broke above prior highs and eventually reached $64,000, which Sun describes as a maximum gain of 458% from that zone.
The October 2022 case, he says, was more turbulent. Bitcoin was forming a base near $20,000, then the collapse of FTX in November sent the price down to $15,700. Even so, Sun argues that October 2022 still sat inside a broader long-term bottoming area. From that signal level to the later 73K high, he calculates a maximum gain of 276%.
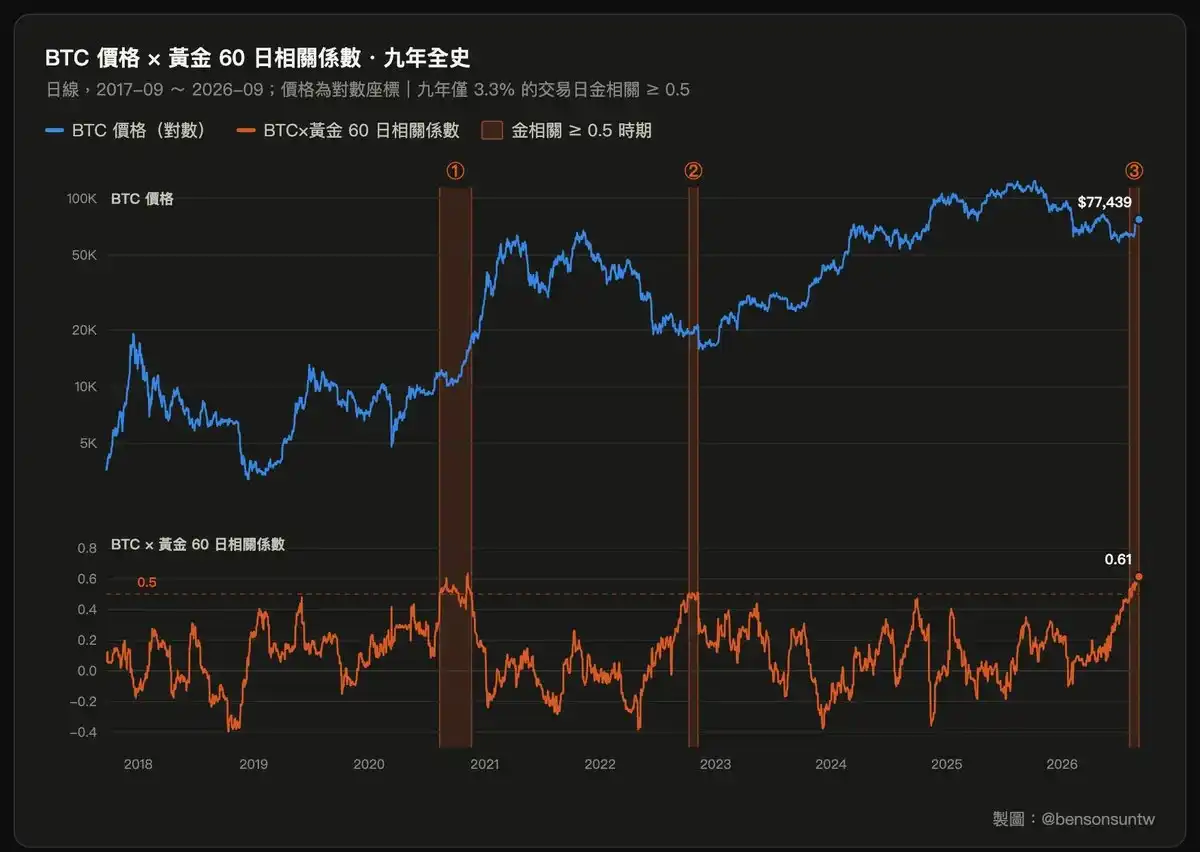
He says the market is now in the third historical stretch of elevated Bitcoin-gold correlation, and if history rhymes, the current phase could mark the start of a new advance.
What stands out to him is the difference from the previous two cases. In 2020, the median correlation between BTC and the Nasdaq was still 0.44, a period he describes as shaped by broad QE and rising liquidity across assets. In 2022, Bitcoin’s correlation with the Nasdaq was even higher than its correlation with gold, reaching 0.62. This time, he writes, Bitcoin’s correlation with gold has broken above 0.6 while its correlation with the Nasdaq has dropped below 0.25, a combination he says has not appeared before.
Sun interprets this as a clue about which valuation framework is dominating the market. Of the three periods with elevated gold correlation, he says the current one is the purest version of Bitcoin being priced as an anti-debasement hard asset.
Sun’s hypothesis: bottoming phases shift pricing power toward “digital gold” buyers
The article adds another pattern. After Bitcoin has fallen more than 25% from its previous high, Sun says its 60-day correlation with gold has, on four occasions, moved quickly from low levels to above 0.4. He lists those signals as December 2018, October 2022, September 2024 and June 2026. The first three, he says, were all later seen near important bottoming zones. If the pattern repeats, he writes, $57K to $58K may prove to be this cycle’s bottom area.
He notes that Bitcoin is often called digital gold, but the longer-run data in his article tell a different story in normal market conditions. Bitcoin’s long-term median correlation with the Nasdaq is given as 0.45, versus only 0.12 with gold. In plain terms, BTC usually looks less like gold and more like a volatile beta tech asset.
Sun offers a hypothesis to explain why this changes near cycle lows. In his view, two distinct pools of capital trade Bitcoin. One treats BTC as a high-risk growth asset and dominates during speculative phases, which keeps the coin closely tied to the Nasdaq. The other treats it as a long-duration hedge against fiat debasement and buys into the digital-gold thesis more directly.
As prices fall, he argues, the shorter-term trading capital exits first. Once Bitcoin drops into a bottoming range and supply gradually moves into the hands of longer-term holders, pricing power starts to shift. As more buyers value BTC through a hard-asset lens, the market begins to show stronger synchronization with gold.
Karma Index is presented as a second signal for early-cycle conditions
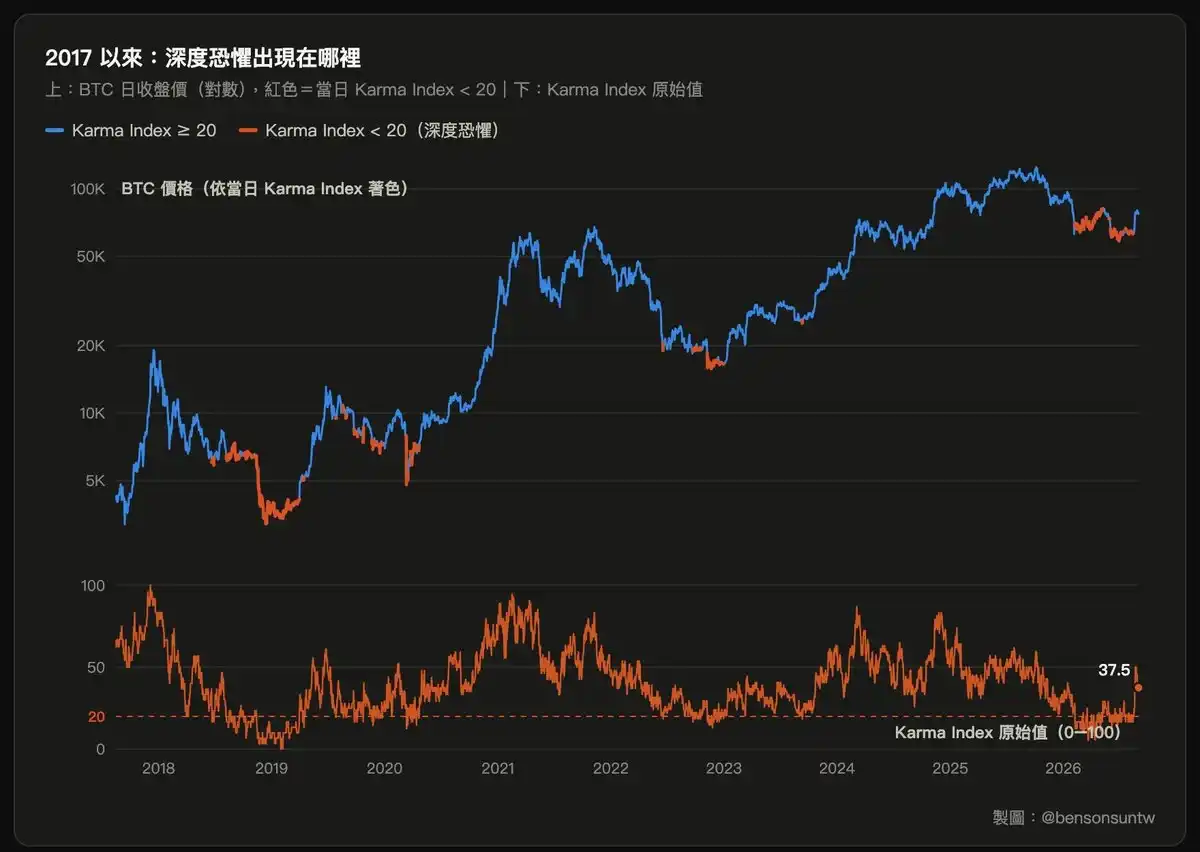
Beyond cross-asset correlation, Sun leans on the Karma Index from CoinKarma to judge sentiment and cycle position. The article describes it as a 0-to-100 market thermometer built from nine factors, including liquidity, funding rates, on-chain cost, app rankings and search interest. Readings above 80 indicate overheating, while readings below 20 indicate extreme fear.
According to the article, the index stayed low for a long period before the latest move and repeatedly fell below 20, a setup Sun says resembled the sentiment profile seen near earlier major bottoms.
He then looks at all cases since 2017 where Bitcoin gained more than 20% in a single week. The current move makes the 28th instance, with 27 earlier cases in the sample. In those prior 27 episodes, buying immediately after the surge produced a median six-month return of only 3.6%, while randomly buying on any trading day over the same broad period would have produced a median six-month return of 13.9%. On that basis, he says chasing a weekly gain above 20% has not offered a historical edge on its own.
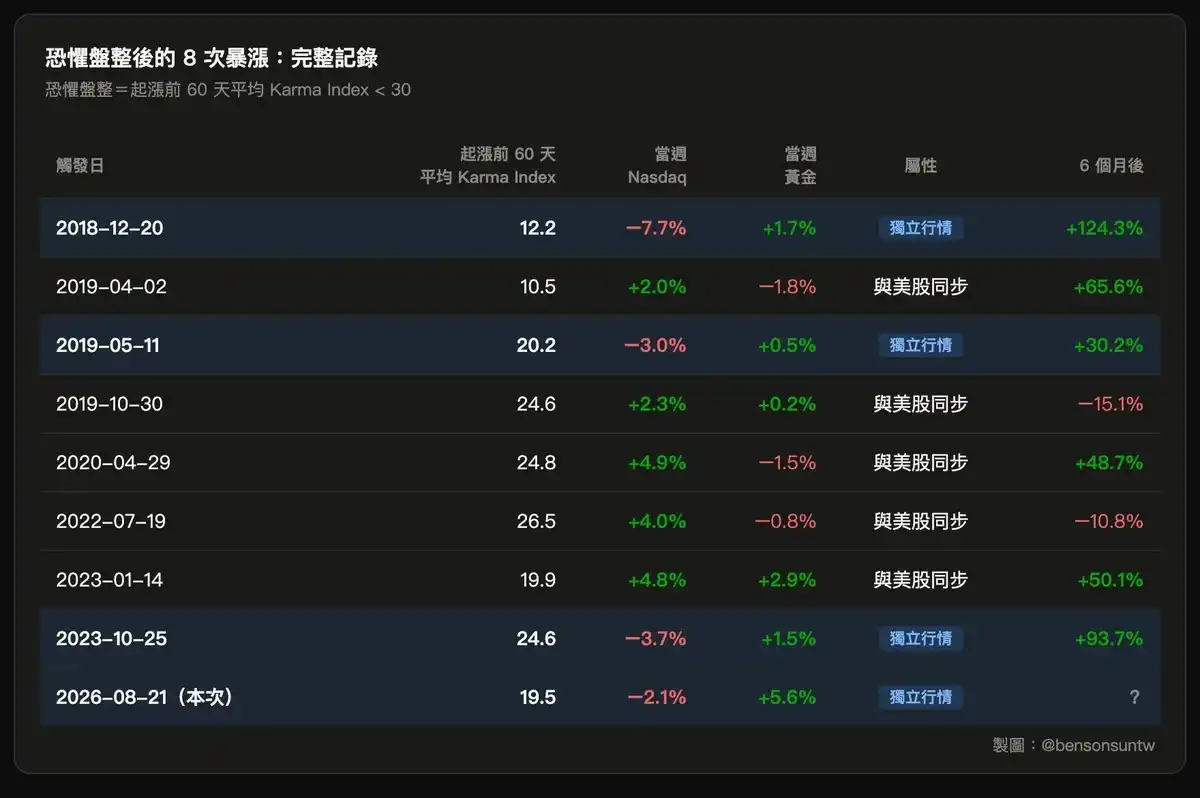
But the picture changes when the Karma Index is added. Restricting the sample to cases where the average Karma Index in the 60 days before the move was below 30 leaves eight examples. Sun says those eight produced six wins and two losses, lifting the win rate to 75%, while the median six-month return jumped from 3.6% to 49.4%.
He narrows the sample once more by looking at the Nasdaq. Of those eight low-sentiment cases, only three happened while the Nasdaq was not rising and Bitcoin still posted a weekly gain above 20% on its own. The article lists them as December 2018, which was followed by a 124.3% gain six months later; May 2019, followed by a 30.2% gain; and October 2023, followed by a 93.7% gain.
Sun says those three examples mapped to a bear-market floor, the start of a major leg higher and the launch point of the ETF bull market. All three still showed positive returns six months later.
For the current setup, he says the average Karma Index over the prior 60 days was just 19.5, the third-lowest reading among nine low-sentiment samples including this one. At the same time, the Nasdaq fell 2.1% during the week Bitcoin surged. In his reading, that makes the current move the fourth historical case in which BTC rallied sharply after a prolonged washout in sentiment while decoupling from the Nasdaq.
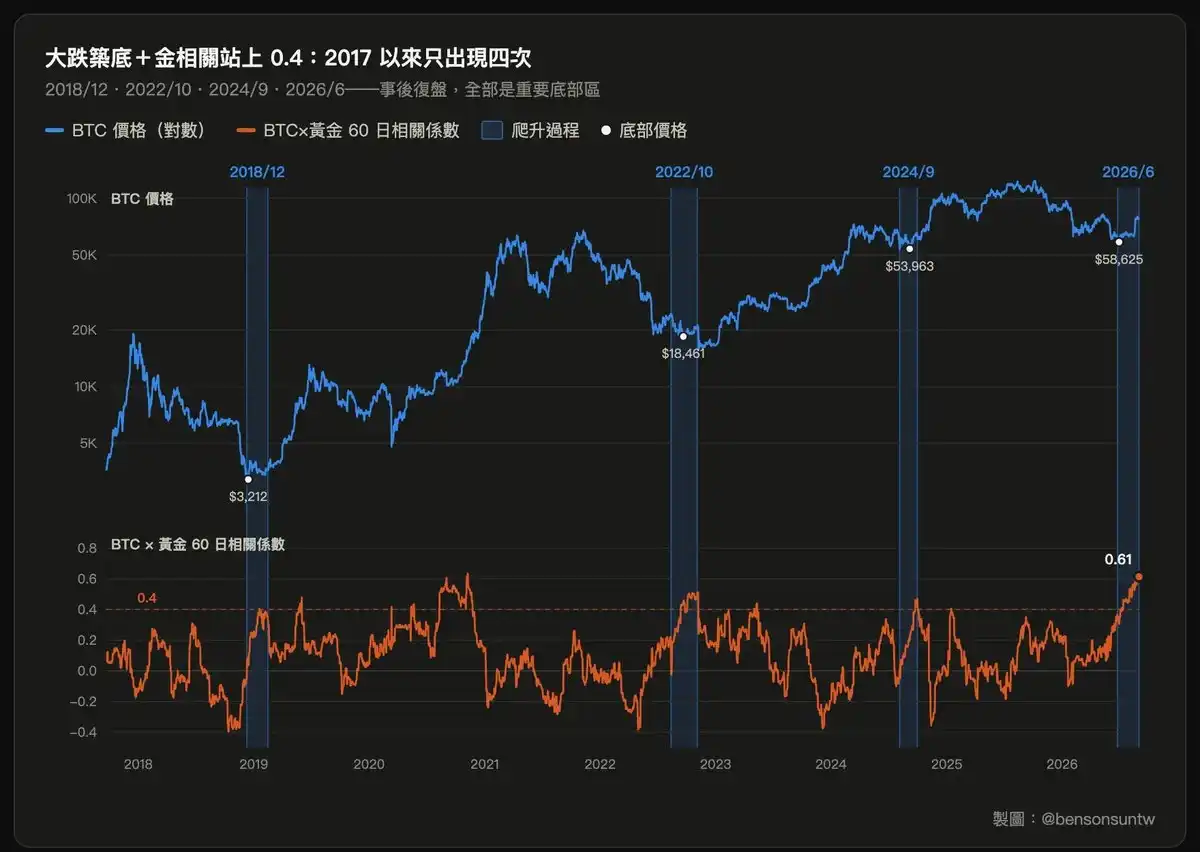
The article condenses the bullish case into two points
Sun sums up the framework in two parts. First, Bitcoin’s linkage with gold has climbed to a level he describes as historically rare. In earlier periods, when that signal appeared after deep drawdowns, it tended to coincide with or sit close to important bottoming zones.
Second, the Karma Index suggests the washout has already been substantial. In his historical samples, when the market spent a long time in a depressed emotional state before a sharp advance, the follow-through tended to be much better than in simple breakout-chasing scenarios.
One signal, in his telling, captures how Bitcoin is being priced across assets. The other measures cycle sentiment. Together, he says, they support the idea that the market is in an early bull phase rather than near the end of one.
The article also addresses why many investors still feel uncomfortable buying into strength. Sun argues that the long bear phase has anchored expectations. During the preceding stretch, U.S. stocks and gold had risen repeatedly while BTC kept falling, which conditioned market participants to treat every rebound as an exit opportunity.
Still, he says Bitcoin’s relative strength has changed over the past two weeks. In his view, BTC is no longer just outperforming U.S. equities; it is also pulling ahead of gold.
He uses late 2018 as an example of how difficult bottom-fishing can be during a bear market. Many traders kept buying the decline from $6,000 only to see Bitcoin continue lower to $3,000, and some sold as soon as they got close to breakeven. Looking back, Sun says the more comfortable entry in that cycle was the move from the low $3,000s to $4,000. The cost was higher, but the probability improved because the main upward leg was only beginning.
He says the present setup looks similar. In his view, every historical case that combined high gold correlation, a BTC move independent of U.S. equities and a deeply washed-out Karma Index appeared at the start of a major bullish phase.
Macro backdrop in the article centers on debt, liquidity and purchasing power
Sun then turns to what kind of bull market this could be. In past cycles, he writes, Bitcoin’s upside was powered mainly by the halving narrative and spillover from U.S. dollar liquidity. The digital-gold story was always present, but usually remained more of a theme than the core driver.
This time, he argues, the setup may be different. The article notes that the 30-year U.S. Treasury yield recently climbed as high as 5.34%, its highest level since 2007. Higher yields, in this framing, mean investors are demanding greater compensation to lend to the United States for longer periods.
Sun also points to the scale of U.S. debt, which he places at close to $40 trillion. If rates stay elevated, refinancing maturing debt becomes more expensive, interest costs add to the deficit, and the government has to issue more debt.
He says the issue itself is not new, but the market’s sensitivity to it has increased. On Aug. 19, the U.S. Treasury announced that it would at least double the cap on liquidity-support repo operations for long-dated Treasuries. After the announcement, long-end yields fell and both gold and BTC rallied. The article says the market quickly read the move as a sign that the Treasury was willing to inject liquidity to keep the long-bond market functioning normally.
That pattern reversed on Sept. 4. Sun writes that U.S. nonfarm payrolls rose by 162,000, far above the market expectation of 56,000, and the probability of a rate hike was pushed as high as 65% at one point. Treasury yields rose quickly, the dollar strengthened, and U.S. equities, gold and Bitcoin all sold off.
His point is that a payrolls print of this kind might not have moved the entire market so sharply a few months earlier. Now, he says, traders are watching the Federal Reserve, long-dated Treasury yields and liquidity much more closely, and the market has become far more sensitive to those variables.
Spot ETFs are described as the compliant access channel that was missing before
The article reduces the market’s response to the U.S. debt problem to two broad paths. One is to grow out of it through AI-driven gains in productivity, profits and economic output, allowing growth to outpace debt expansion and lower the debt-to-GDP ratio. The other is to erode debt in real terms through monetary expansion and inflation. In Sun’s framing, the first path lines up with AI-related equities, while the second aligns with gold and Bitcoin.
He says the market has spent the past several years putting large amounts of capital behind the first path, the productivity revolution tied to AI. If investors begin to shift more attention back toward debt, liquidity and the purchasing power of fiat currencies, then anti-debasement trades could move back to the center of asset allocation.
Sun says the implications reach well beyond crypto. Anyone holding cash, government bonds, pensions or fiat-denominated assets faces the same question: how much purchasing power will that money retain in ten years? If the market starts to doubt whether sovereign debt can keep expanding without persistent currency dilution, capital will naturally seek out scarce assets that cannot be freely issued. Gold is the traditional answer, and in his view Bitcoin is becoming another one.
The article closes by highlighting spot ETFs as a meaningful structural change. In prior cycles, even institutions that accepted the digital-gold narrative still had to deal with exchanges, private keys, custody, compliance and accounting. Sun argues that the approval of spot ETFs in the previous cycle has now opened a practical route for larger pools of capital.
He says asset managers, family offices, pension funds and even ordinary brokerage accounts can now gain BTC exposure through familiar financial instruments. The story itself is not new; what changed, in his view, is the existence of a compliant channel capable of absorbing large allocations.
That is why he sees the current BTC-gold synchronization as more important than in the previous two episodes. Gold correlation has climbed to a historically unusual level, while correlation with the Nasdaq remains low. Judged by the logic of the rally, he says this may be the closest Bitcoin has ever come to trading like gold.
Sun ends with a larger claim. If the anti-fiat-debasement trade moves from being a recurring narrative to becoming the market’s next main line, then the capital pool available to Bitcoin changes completely. If BTC starts to absorb global asset-allocation demand tied to concerns over monetary credibility, sovereign debt and the decline in purchasing power, the flow set could become the largest in Bitcoin’s history. If that macro theme fully unfolds, he writes, what the market is seeing now may be only the beginning of a much larger bull run.