



This week’s analysis centers on two assets: Bitcoin’s daily structure has turned weaker, and the short-term rebound faces the key question of whether it can breach the upper rail of the descending channel. Meanwhile, HYPE’s seven-segment rally from the May 14 low may be nearing its end. The following sections parse the multi-timeframe structures, outline current market patterns, and propose both swing and short-term trading strategies for the week.
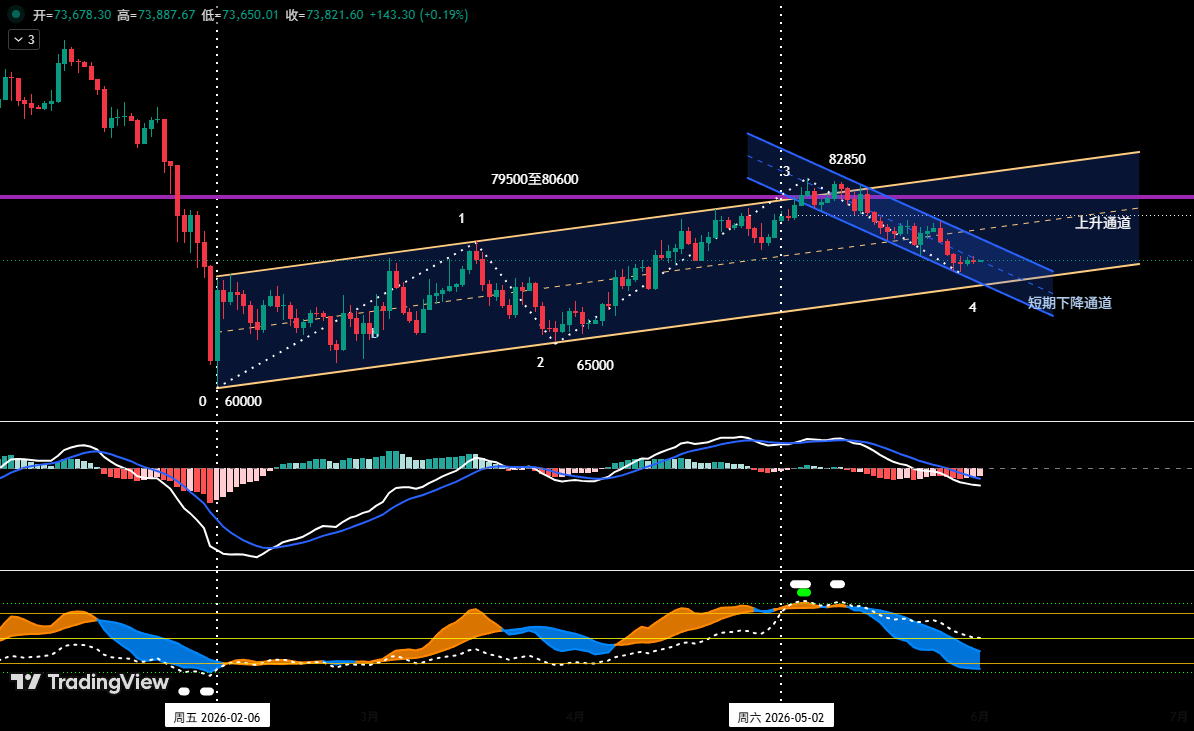
On the daily chart, Bitcoin has been oscillating higher within a rising channel (yellow) since the February 6, 2026 low. That channel’s lower trendline connects the lows of February 6 and March 29, while the upper parallel runs through the March 17 high. After printing a high of $82,850 on May 6, price entered a near-term descending channel (blue), whose upper boundary links the bounce highs of May 14 and May 26, and the lower boundary connects the swing lows of May 7 and May 23. Currently, BTC has lost the mid-line of the rising channel and is seeking stronger support at the lower rail. Within the blue descending channel, price found temporary footing near $72,500, the channel’s lower rail, and is now staging a weak rebound toward the upper rail. Overall, this bounce looks like a relief rally after oversold conditions; because the rising channel’s midline is broken, the broader technical structure has weakened. Once the bounce exhausts, the price is likely to resume the downtrend and test the rising channel’s lower boundary.
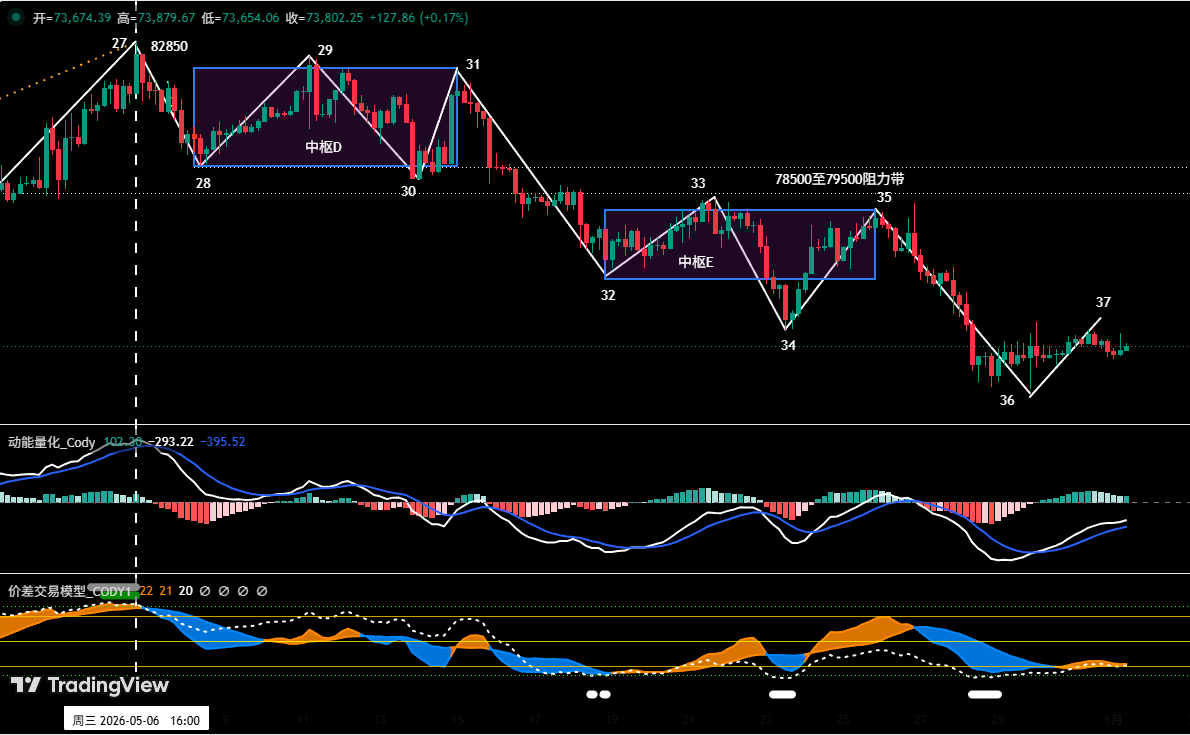
On the 4-hour timeframe, the decline from the May 6 high of $82,850 can be divided into a 10-segment corrective structure (segments “27-28” through “36-37”), incorporating two descending pivots: Pivot D formed by the overlapping of 28-29, 29-30, and 30-31; Pivot E formed by 32-33, 33-34, and 34-35. The current segment 36-37 is a bounce. If the rebound stalls in the $75,000–$76,000 zone and fails to break through, the market is likely to extend its choppy decline and test the $69,500–$70,500 support region.
Key resistance zones are: first at $75,000–$76,000 (near the lower boundary of Pivot E), and second at $78,500–$79,500 (area around the upper and lower boundaries of both pivots). On the downside, important supports sit at $69,500–$70,500 (prior significant support) and around $65,000 (prior notable low).
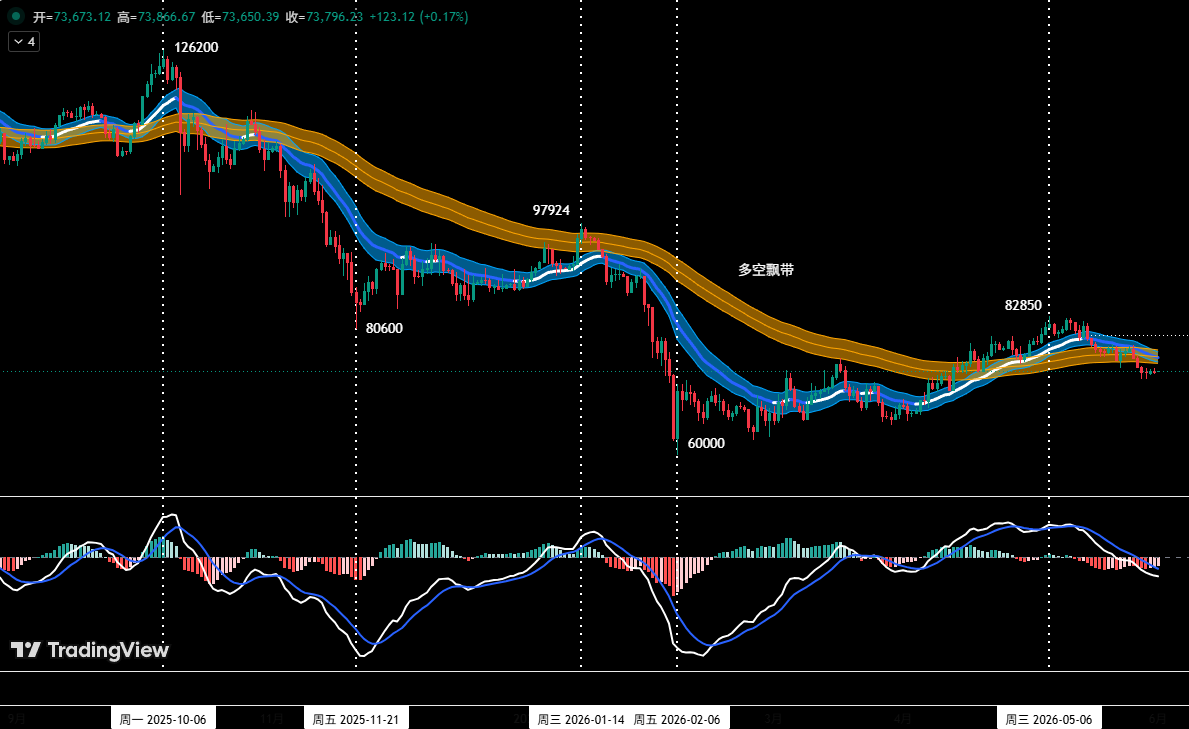
For short-term operations, we use 30% of the position and rely on support/resistance levels to scalp spreads. Two concrete plans are prepared. Plan A: if the price rallies to $75,000–$76,000 and encounters resistance, combined with a top signal from the quant model, we open a short position of no more than 30%, with an initial stop above $77,000, and exit gradually near support when the model gives a bottom signal. Plan B: if the price effectively breaks below the $69,500–$70,500 support zone and the model triggers a top signal, we likewise initiate a short of up to 30%, with a stop placed above $72,000, targeting the next support for liquidation.
HYPE’s Seven-Segment Rally and Top Warning
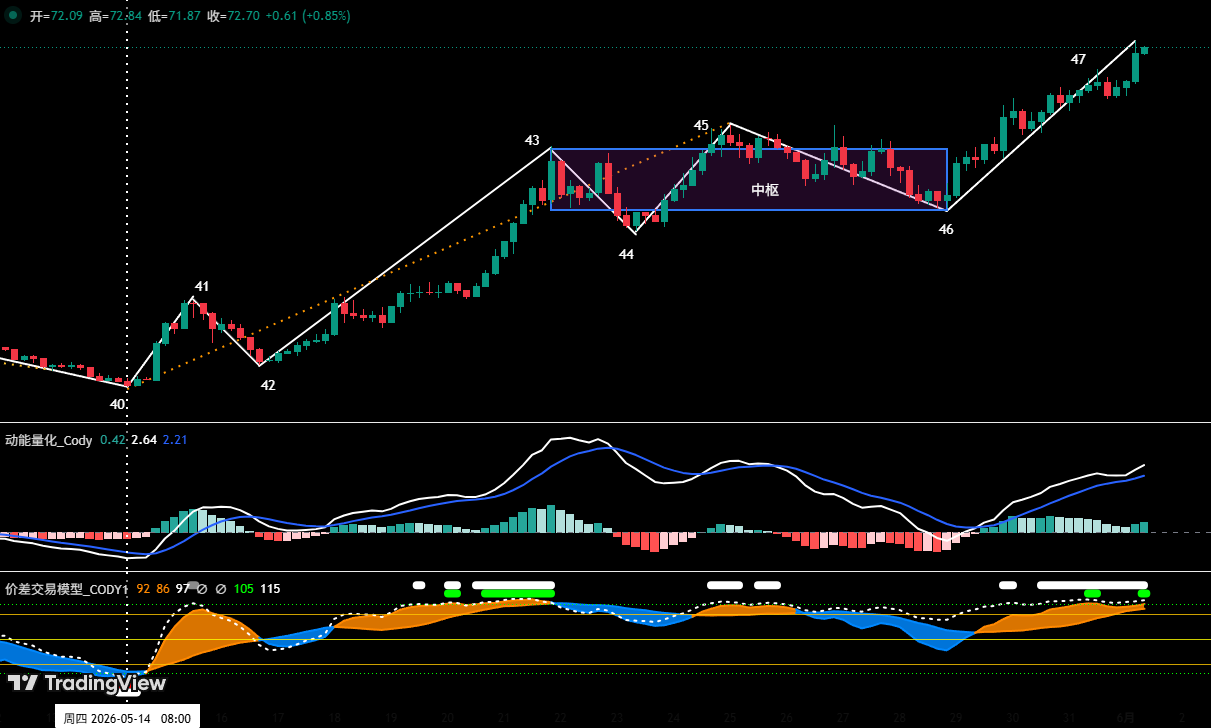
On the 4-hour chart, HYPE’s advance from the May 14 low of $38.14 has built a clear seven-segment structure (40-41 to 46-47) containing a rising pivot. The overlapping of 43-44, 44-45, and 45-46 forms that pivot. Last week’s review had already warned that endpoint 45 showed a momentum top divergence and resonated with the spread trading model’s top alert, marking a high-probability short-term peak. Market action validated this: price dropped from $64.75 (endpoint 45) to $56.30 (endpoint 46), a maximum decline of 13.05%.
Now, comparing the pivot exit segment 46-47 with the entry segment 42-43, upward momentum is visibly exhausted, suggesting a high chance of momentum divergence. Our proprietary spread trading model has flashed a strong top warning at endpoint 47 (red dot + white dot). The core observation this week is whether endpoint 47 indeed marks the definitive peak and whether momentum divergence is confirmed. If these signals align, and the price subsequently breaks below the $62.5–$64.57 support zone, we can conclude that endpoint 47 is the terminal point of the rally from the May 14 low.
HYPE short-term tactics should be grounded in “buying on dips and avoiding chasing rallies.” The critical test is how the price reacts to the $62.5–$64.75 area. If it shows signs of stabilization there and both models generate bottom signals, a light long position (under 30%) can be entered with strict stop-loss discipline. Should the price decisively break below this zone, the correction will upgrade to a larger degree (e.g., daily), extending its time and space, with an initial downside target of $54–$56.3.
Last Week’s Trade Review and Risk Management
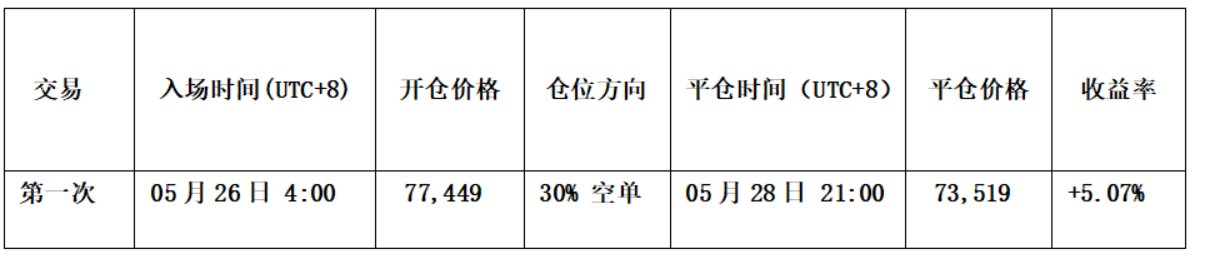
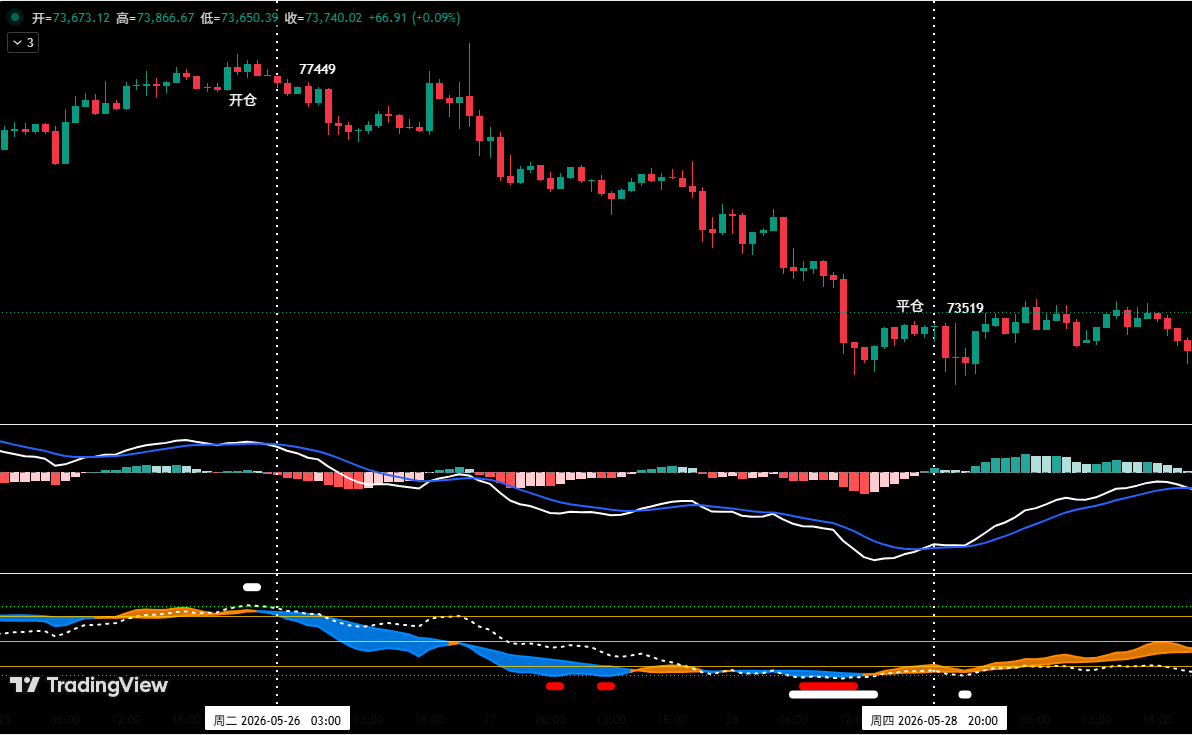
Acting strictly according to the preset plans, we executed one short trade last week, capturing a profit of about 5.07%. Entry rationale: the price bounced near $78,000 and formed a bearish top pattern; our spread trading model triggered a top alert (white dot) and the momentum quant model flashed a top divergence signal. Consequently, we opened a 30% short at $77,449. Exit: when price dropped to around $73,000, a bottom reversal pattern emerged; the spread trading model fired a strong bottom signal (red dot + white dot) that resonated with the momentum model’s bottom signal. The entire position was closed near $73,519. The trade adhered to entry and exit rules.
Risk control rules: Place an initial stop immediately upon opening. When profit reaches 1%, move the stop to the entry price to protect capital. At 2% profit, shift the stop to lock in 1% gain. Thereafter, for every additional 1% profit, the stop is moved up by 1%, dynamically securing profits.

Financial markets are fast-moving; all analysis and strategies require dynamic adjustment. The views, models, and trading plans presented here are based on personal technical analysis and serve only as a trading journal. They do not constitute investment advice or a call to action. Trading involves risk; exercise caution.