
The original article, written by Blockbooster researcher @BlazingKevin_, starts from a structural gap in crypto finance: trillions of dollars in leveraged positions, collateralized lending markets and yield products are operating without a unified benchmark interest-rate curve. Perpetual swaps publish funding rates, lending protocols quote borrowing and deposit APRs, sUSDe offers a staking yield, and tokenized Treasury products distribute coupon-like returns. Yet none of these figures has become a common pricing anchor equivalent to SOFR in traditional finance.
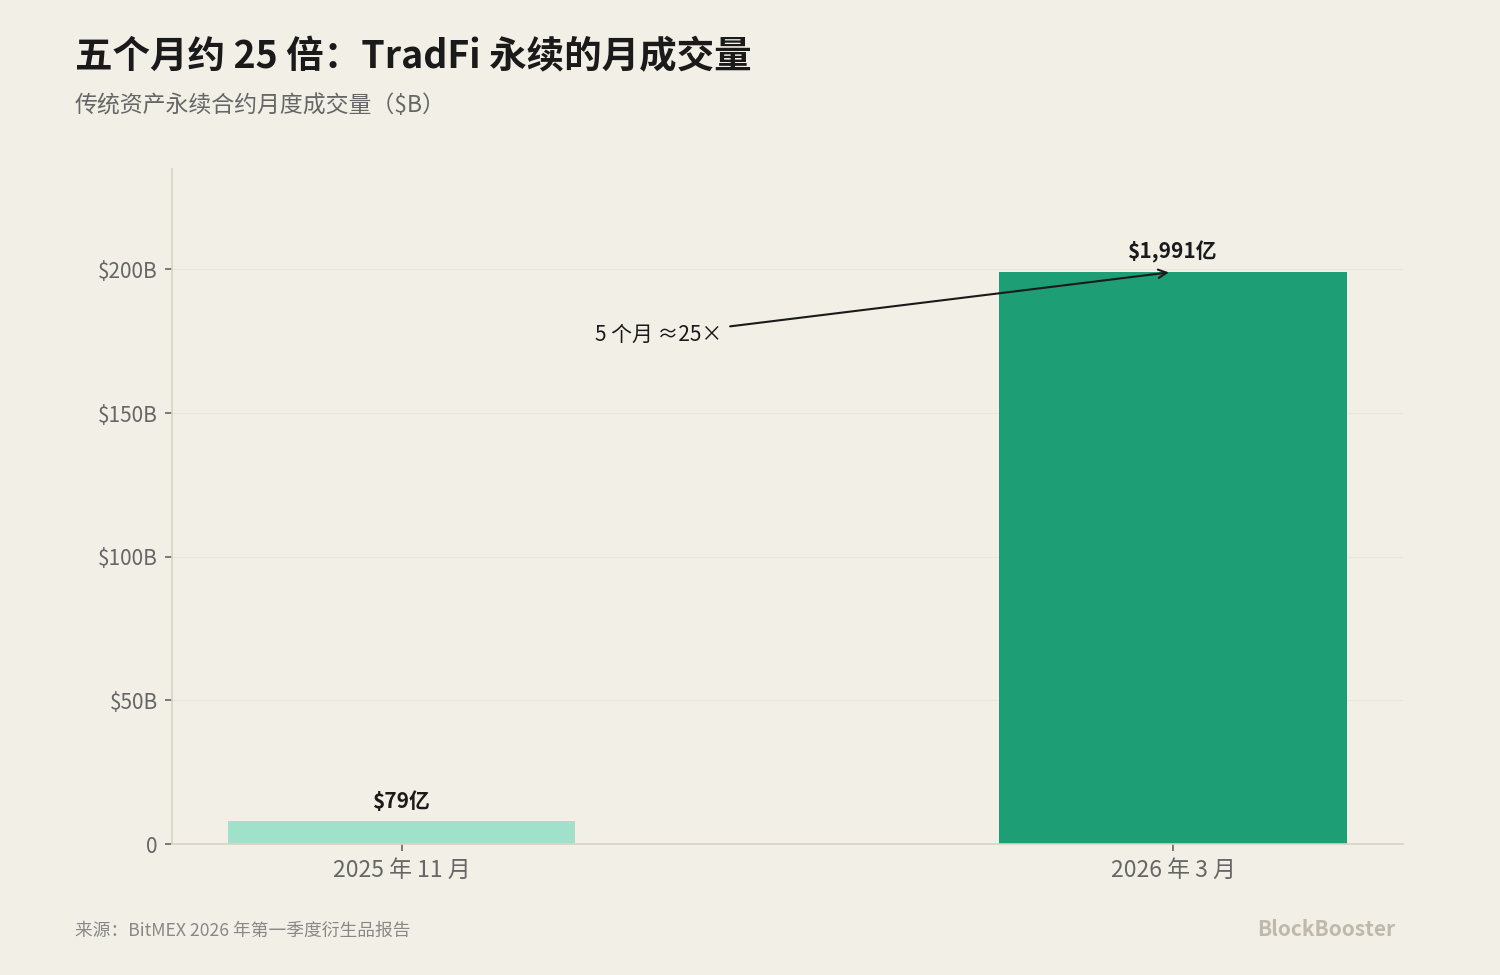
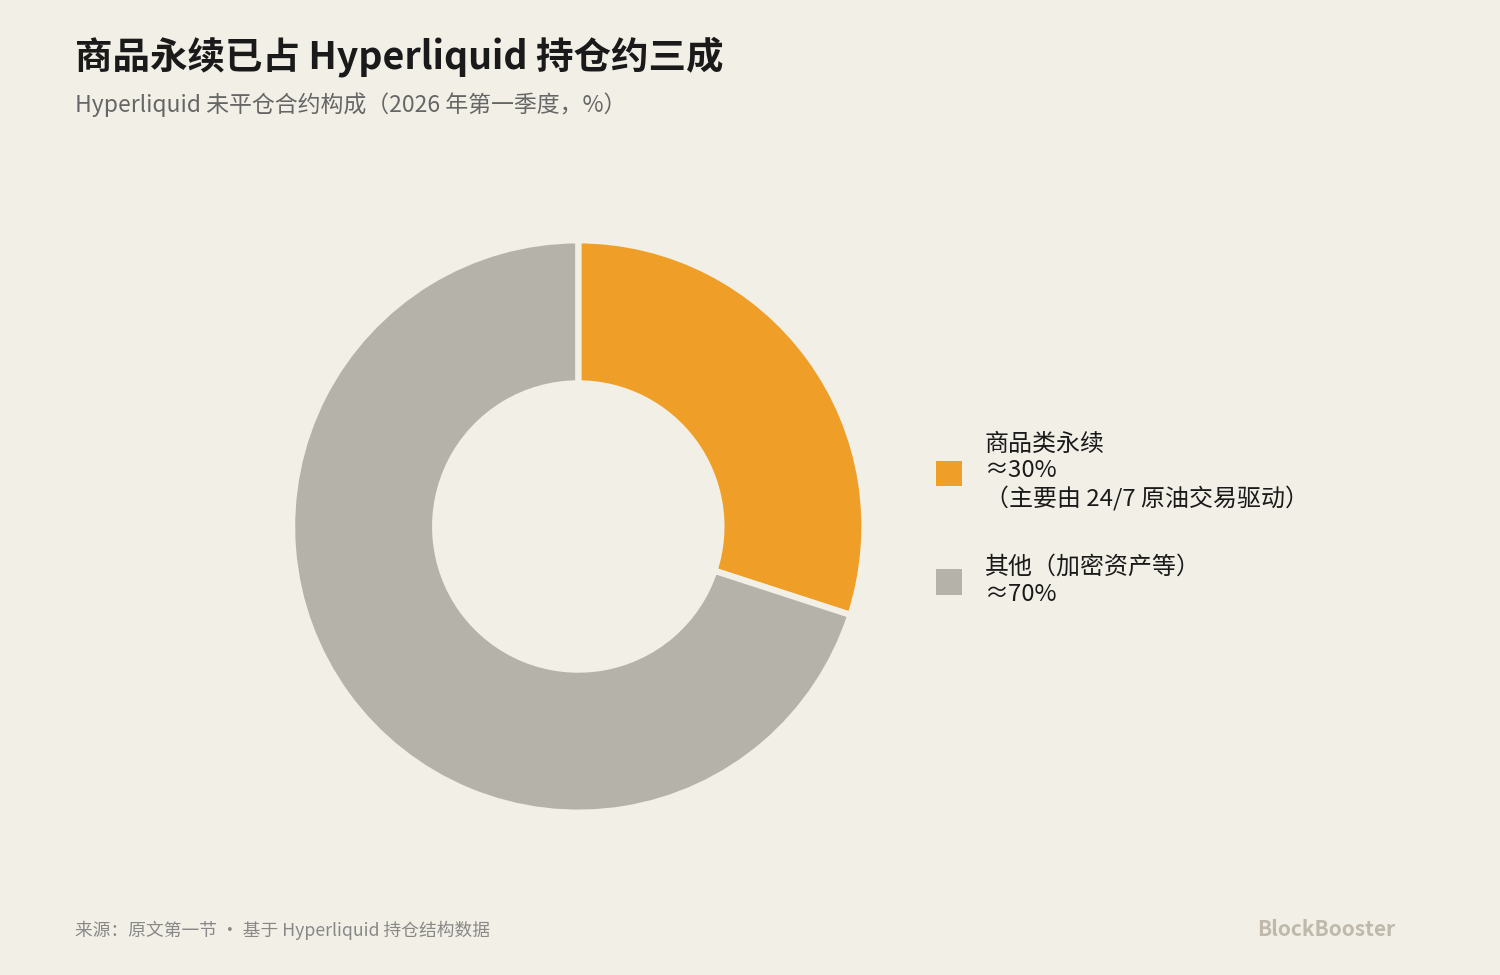
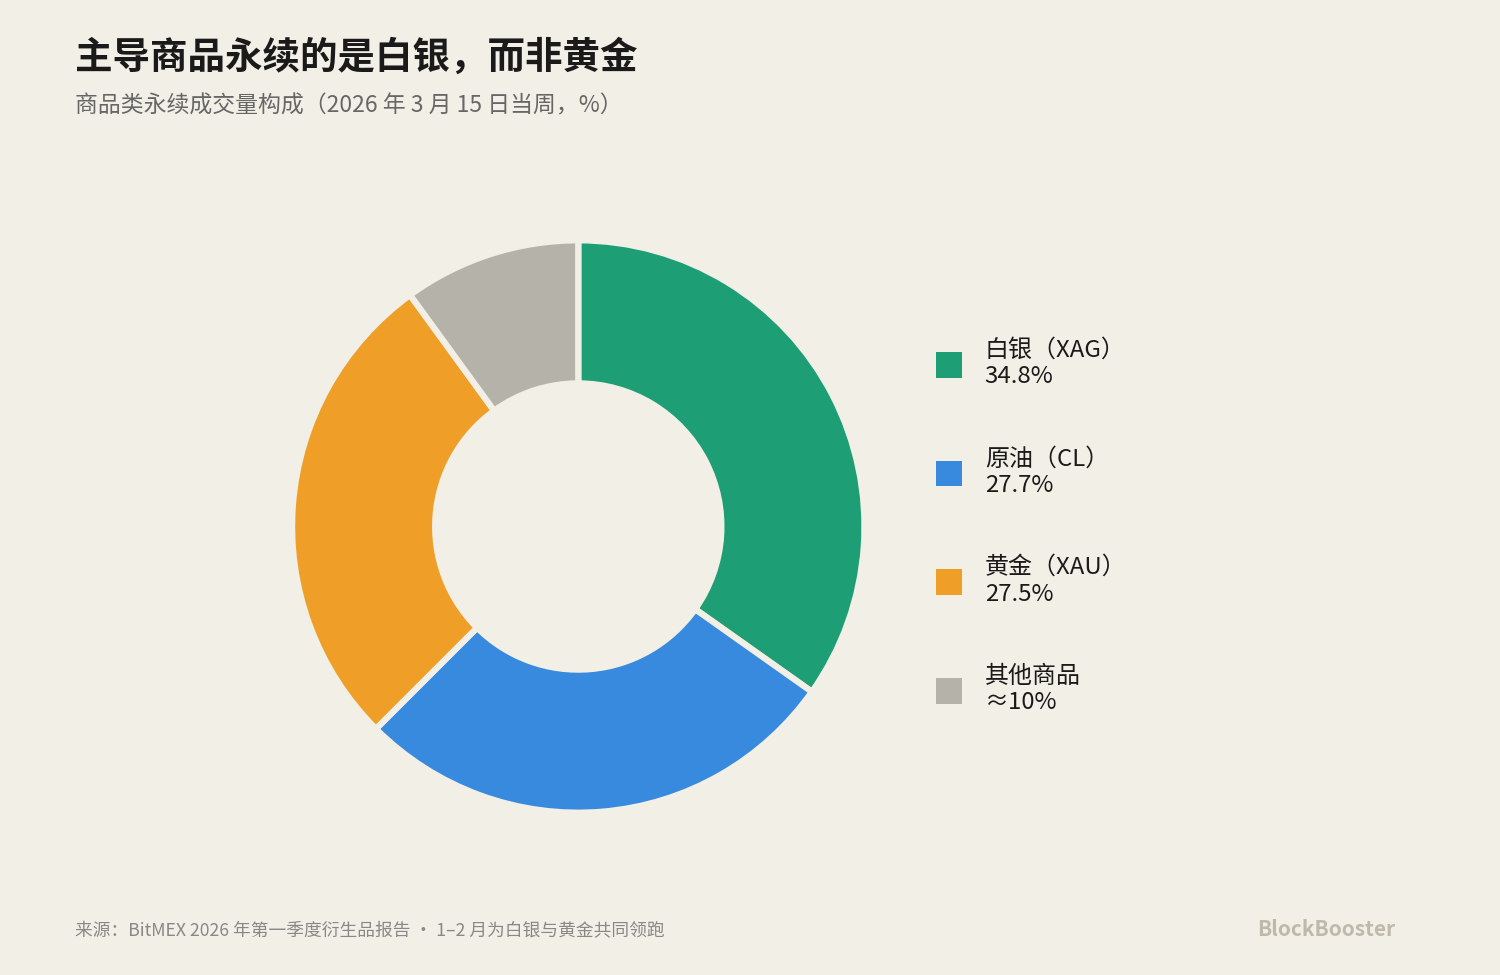
The issue has become more visible as derivatives tied to traditional assets expand inside crypto venues. According to BitMEX’s derivatives report for the first quarter of 2026, the emerging “traditional-asset perpetuals” segment saw weekly trading volume rise from about $525.8 million at the end of 2025 to $30.7 billion in mid-March 2026, a quarterly increase of about 5,756%. Monthly volume rose from $7.9 billion in November 2025 to $199.1 billion in March 2026, roughly a 25-fold increase over five months. DefiLlama’s 30-day snapshot showed Hyperliquid processing about $172.63 billion in perpetual volume, with open interest of about $9.13 billion. In the first quarter of 2026, commodity perpetuals represented about 30% of Hyperliquid’s open interest, mainly driven by demand for 24/7 crude oil trading.
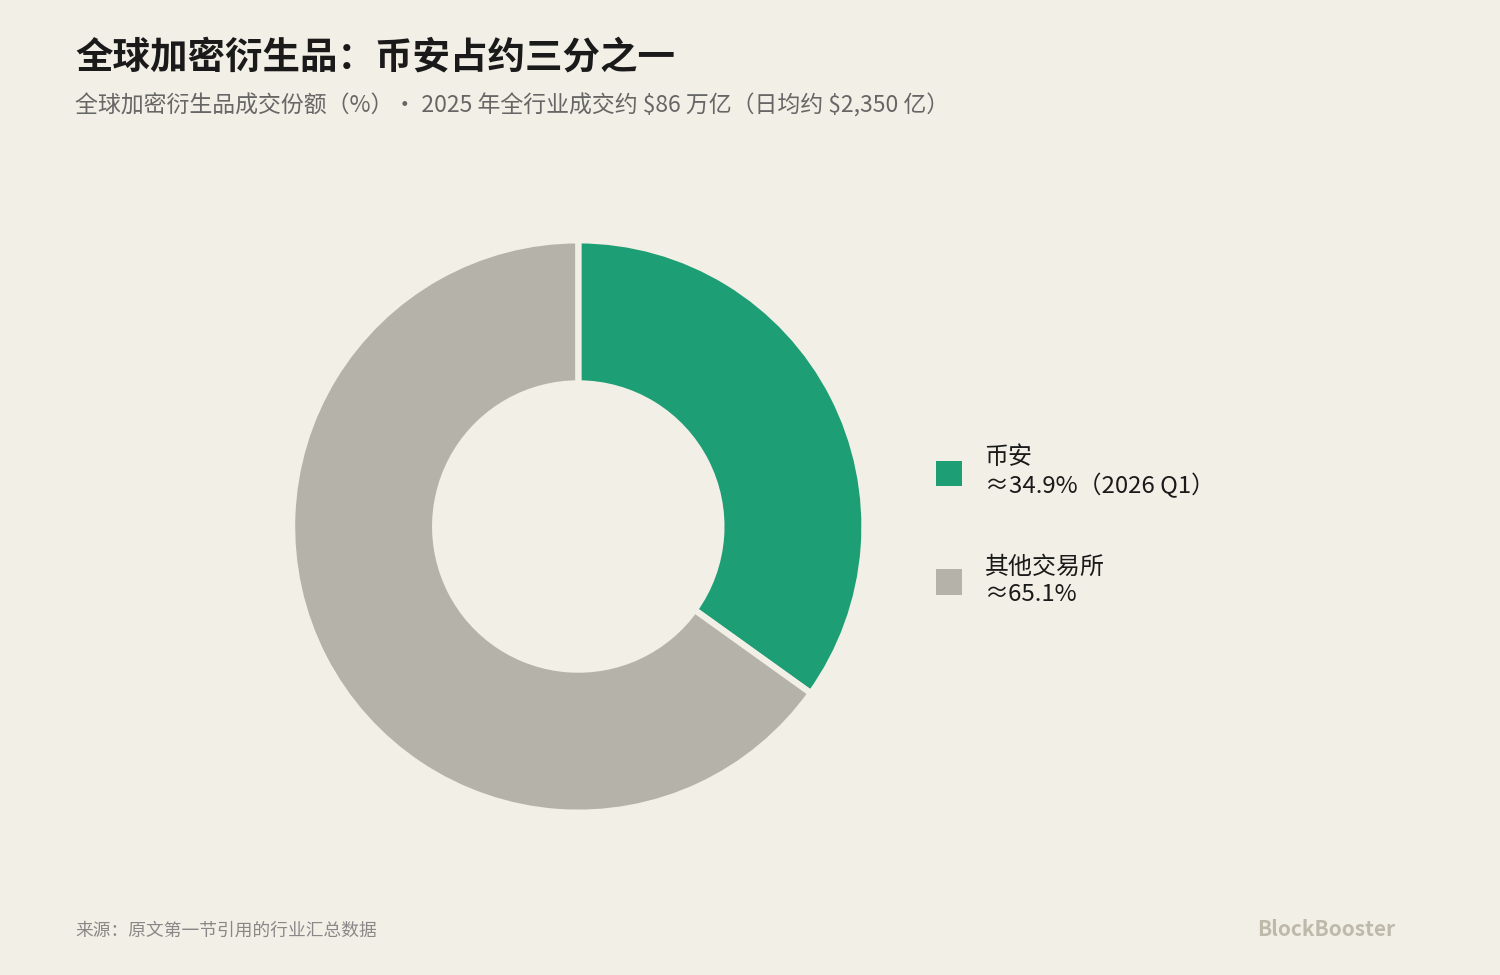
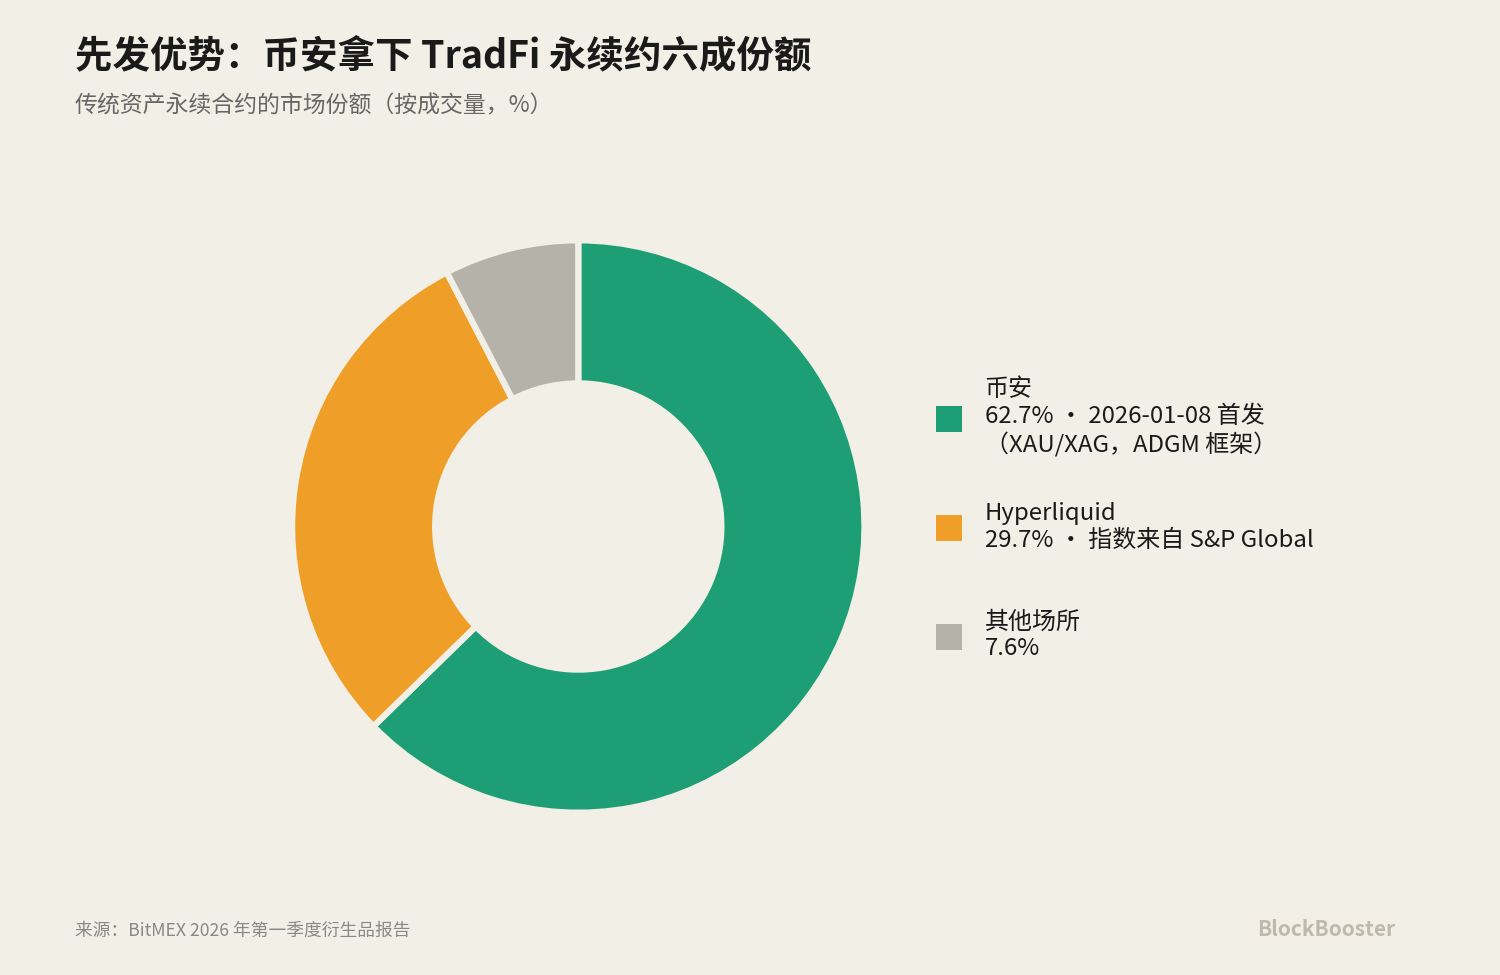
Binance launched TradFi perpetual contracts on January 8, 2026, initially listing gold (XAUUSDT) and silver (XAGUSDT). It captured about 62.7% of the TradFi perpetuals market, followed by Hyperliquid with 29.7%. Hyperliquid’s index data for these traditional-asset perpetuals comes through a partnership with S&P Global, and that arrangement, which links crypto perpetuals directly to traditional indices, is under regulatory review by the U.S. CFTC. At the same time, Ethena’s USDe market capitalization was around the $4.5 billion to $5.9 billion range in early June 2026.
The article separates three types of “rates” that are often grouped together. The first distinction is between a benchmark financing rate, a product yield and a derivatives-implied rate. sUSDe’s APY is a product yield paid to holders. Perpetual funding is a derivatives-implied rate paid between longs and shorts to keep perpetual prices anchored to spot. A benchmark financing rate, by contrast, should be a public reference that many other products can cite for pricing. Product yields and derivatives-implied rates are downstream outputs built on top of different risk premia and product structures.
The second distinction is between overnight rates and term rates. Perpetual funding is settled every one or eight hours, so it is effectively an overnight-style rate: it reflects the cost of capital only until the next settlement point and contains no term structure. It cannot tell the market how the price of borrowing for 30 days differs from borrowing for 90 days. SOFR itself is also an overnight rate, and the market needed futures data to construct Term SOFR. Without term structure, a rate cannot support medium- or long-term fixed-income pricing.
The third distinction is between real lending rates and algorithmic or implied rates. A real bilateral lending market, such as Bitfinex’s margin funding order book, matches actual lenders and borrowers. A utilization-based market, such as Aave, calculates rates through a formula written into the protocol: the higher the pool utilization, the higher the rate. These two mechanisms generate prices in fundamentally different ways. The former reflects executed transactions among market participants, while the latter reflects a curve designed by protocol rules.
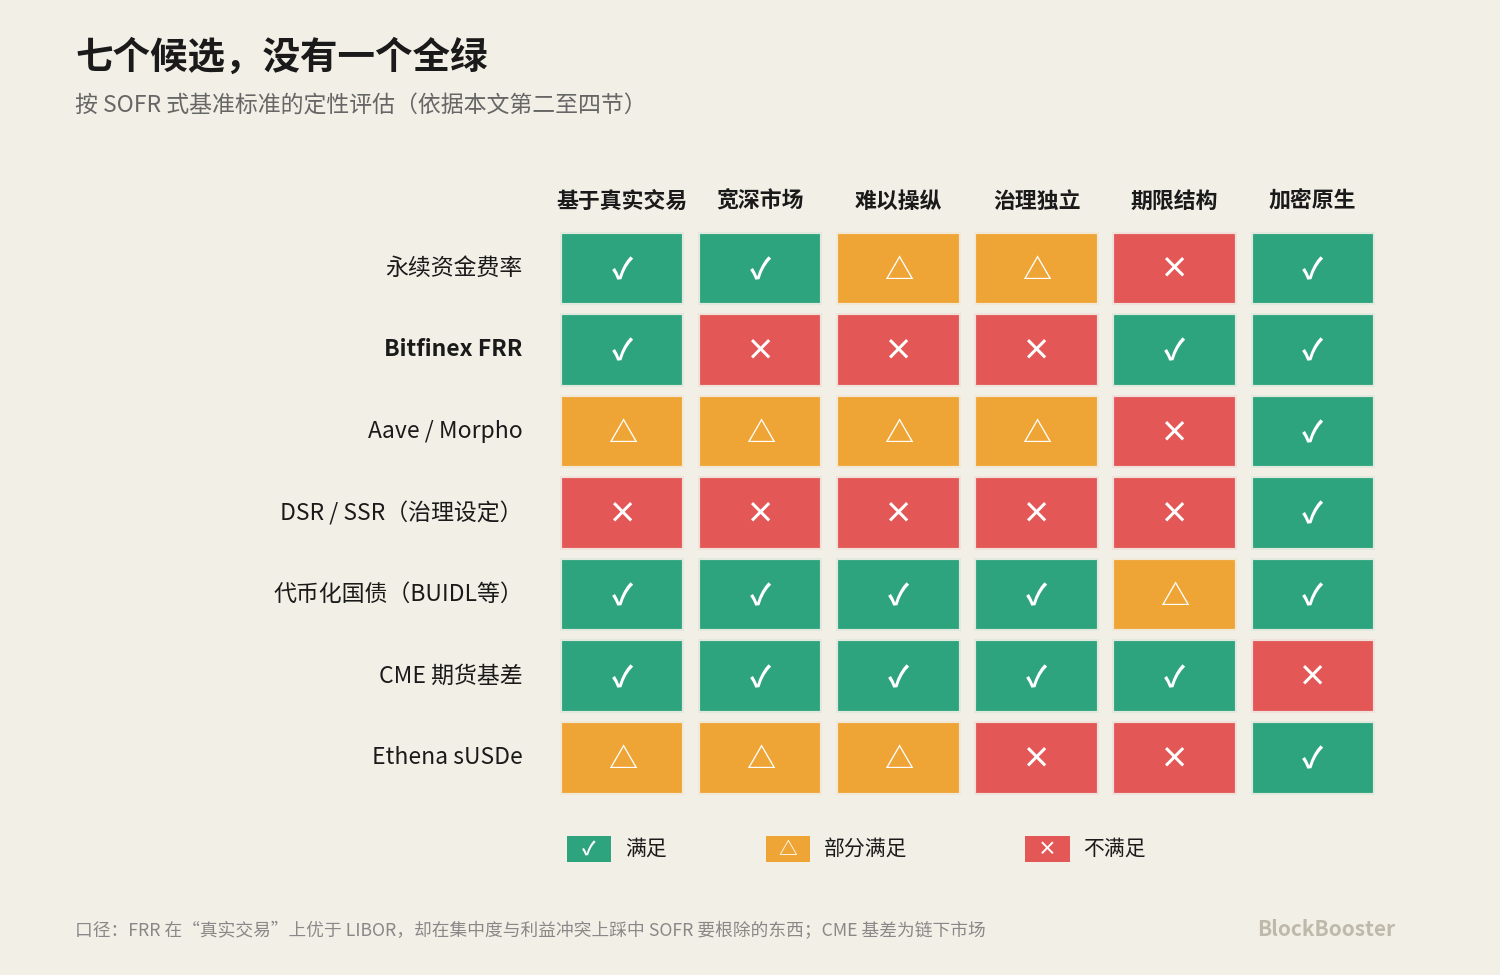
From these distinctions, the article defines the requirements for a qualified benchmark: it should be based on real transactions; the underlying market should be broad and deep enough to resist manipulation by a single participant; governance should be independent, with no conflict of interest between the administrator and the priced market; and the benchmark should preferably have a term structure capable of supporting longer-dated pricing. SOFR is based on real overnight repo transactions collateralized by U.S. Treasuries, and its average daily volume often exceeds $1 trillion. That real repo volume is different from the futures notional volume used to support Term SOFR.
The comparison with SOFR is not accidental. The Bank for International Settlements has described on-chain collateralized lending markets as crypto-native money markets, with operating mechanics similar to traditional tri-party repo: overcollateralization, mark-to-market liquidation and overnight rolling. If on-chain lending is structurally a form of repo-like secured financing, then a SOFR-style benchmark based on real repo transactions is a useful reference point for evaluating crypto’s own benchmark design.
The article then revisits the LIBOR-to-SOFR transition. LIBOR was once a cornerstone of global finance. At its peak, roughly $300 trillion of financial contracts, including interest-rate swaps, mortgages, student loans and corporate bonds, depended on LIBOR across five currency areas. Its fatal flaw was that it was not based on real transactions. A small number of panel banks submitted daily estimates of their own borrowing costs. After the 2008 financial crisis, regulatory investigations found that traders at several major global banks had systematically manipulated LIBOR submissions to benefit their derivatives positions. The scandal led directly to LIBOR’s abolition.
SOFR was designed almost as the reverse of LIBOR. It does not rely on self-reported estimates. It is based on real overnight repo transactions collateralized by U.S. Treasuries. It uses the volume-weighted median of transactions across tri-party repo, GCF repo and bilateral repo cleared through FICC’s DVP service, making the sample wider and deeper. It is administered by the Federal Reserve Bank of New York and follows the IOSCO Principles for Financial Benchmarks, reducing conflicts between the administrator and the market being priced. Its weakness is that it is an overnight rate. The market also needs expectations for future three-month funding costs to price longer-term loans. CME therefore launched CME Term SOFR, a forward-looking rate set covering one-month, three-month, six-month and twelve-month tenors. It uses SOFR futures trading data to infer the market’s expected path of future SOFR. The SOFR futures used to construct Term SOFR had representative notional volume of about $2.3 trillion per day in the fourth quarter of 2023.
The article then reviews the main crypto candidates that are often treated as rates or yields, using one axis throughout: who has the authority to determine the rate? Is it market-weighted execution, algorithmic utilization, or governance setting? Perpetual funding is the implicit price of leverage, driven by the basis between spot and perpetual markets. It is essentially overnight and has no term structure. When the spot market for a TradFi asset is closed, such as equities or precious metals over weekends, exchanges cannot obtain a real spot price to calculate funding. Binance freezes the index price at the last spot price and switches to an EWMA mark price with a ±3% cap. Hyperliquid also switches to EWMA over weekends and sets volatility caps by asset. During closed-market periods, the anchor for perpetual prices is a predicted value rather than an executable spot price. When the market reopens and the real price gaps beyond the cap, limit-up or limit-down behavior appears.
Bitfinex’s margin funding market is a different case. It operates a peer-to-peer funding market in which lenders provide capital to margin traders and earn interest. The key design is that funding terms range from 2 to 120 days, with common terms including 2 days, 7 days and 30 days, and both the rate and the term must match at execution. This means the Bitfinex funding order book naturally forms a real lending curve from the short end to the long end. Thirty-day money and 120-day money have different prices, determined by actual supply and demand. FRR, or Flash Return Rate, is the reference rate for this market: it is the size-weighted average rate of all active fixed-rate funding and is updated hourly. In substance, it is a Bitfinex-style benchmark reference rate reflecting current average borrowing costs. Lenders can lend directly at FRR so that their rate follows the market automatically.
Bitfinex charges about 15% on lending income, or 18% for hidden orders, and the minimum order size is $150. FRR is quoted as a daily rate and annualized from that daily rate. Bitfinex USD FRR is about 0.0136% per day, or about 5.1% annualized, placing it broadly in the same range as tokenized Treasuries, Aave and SSR. The crucial issue is volatility. Historical USD lending rates have moved sharply within a range of about 3% to 20% APR and are strongly linked to leverage demand. This daily-rate curve across maturities from 2 to 120 days is one of the few crypto-native dollar funding curves with a real term structure.
Bitfinex and Tether share the same parent company, iFinex, and have overlapping management. That gives Bitfinex some of the deepest USDT liquidity in crypto, which is one reason its funding market has depth. At the same time, it concentrates counterparty risk and stablecoin-issuer risk inside one combined structure. Borrowing through Bitfinex, matching on Bitfinex, denominating in Tether and relying on the same parent group in extreme conditions creates a highly self-contained system. While Bitfinex’s funding market is one of the oldest and deepest native dollar term-funding markets in crypto, its absolute size, including outstanding order-book inventory and daily matched volume, is still much smaller than the trillion-dollar flow seen in perpetual markets.
Compared with LIBOR and SOFR, FRR is cleaner than LIBOR on the question of real transactions: it is calculated from actual executed fixed-rate funding weighted by size, so it reflects real market behavior. But it comes from a single exchange’s order book, is operated by iFinex, which also controls the largest stablecoin issuer Tether, and the operator is also the last lender around this market’s existing positions. In concentration and conflict-of-interest terms, FRR touches the very issues SOFR was designed to remove.
Aave represents algorithmic utilization-based pricing. Its rates are not determined by bilateral matching, but by a preset formula tied to pool utilization. Higher utilization produces higher rates, and the rate changes in real time with borrowing demand. Aave mainnet USDC deposit rates fluctuate around 3.5% to 6% depending on utilization. On Morpho, curator-managed USDC vaults are around 5% to 7% after curator fees. Sky’s DSR and SSR fall into a separate category: governance-set policy-like rates. DAI’s Dai Savings Rate and USDS’s Sky Savings Rate are widely cited and functionally resemble a central-bank policy rate. They are not market-matched and not triggered by algorithmic utilization, but set by Sky governance votes. SSR was reduced by governance from 4.75% at the end of April 2026 to about 3.6% to 3.75% by early June. USDS circulation was about $11 billion.
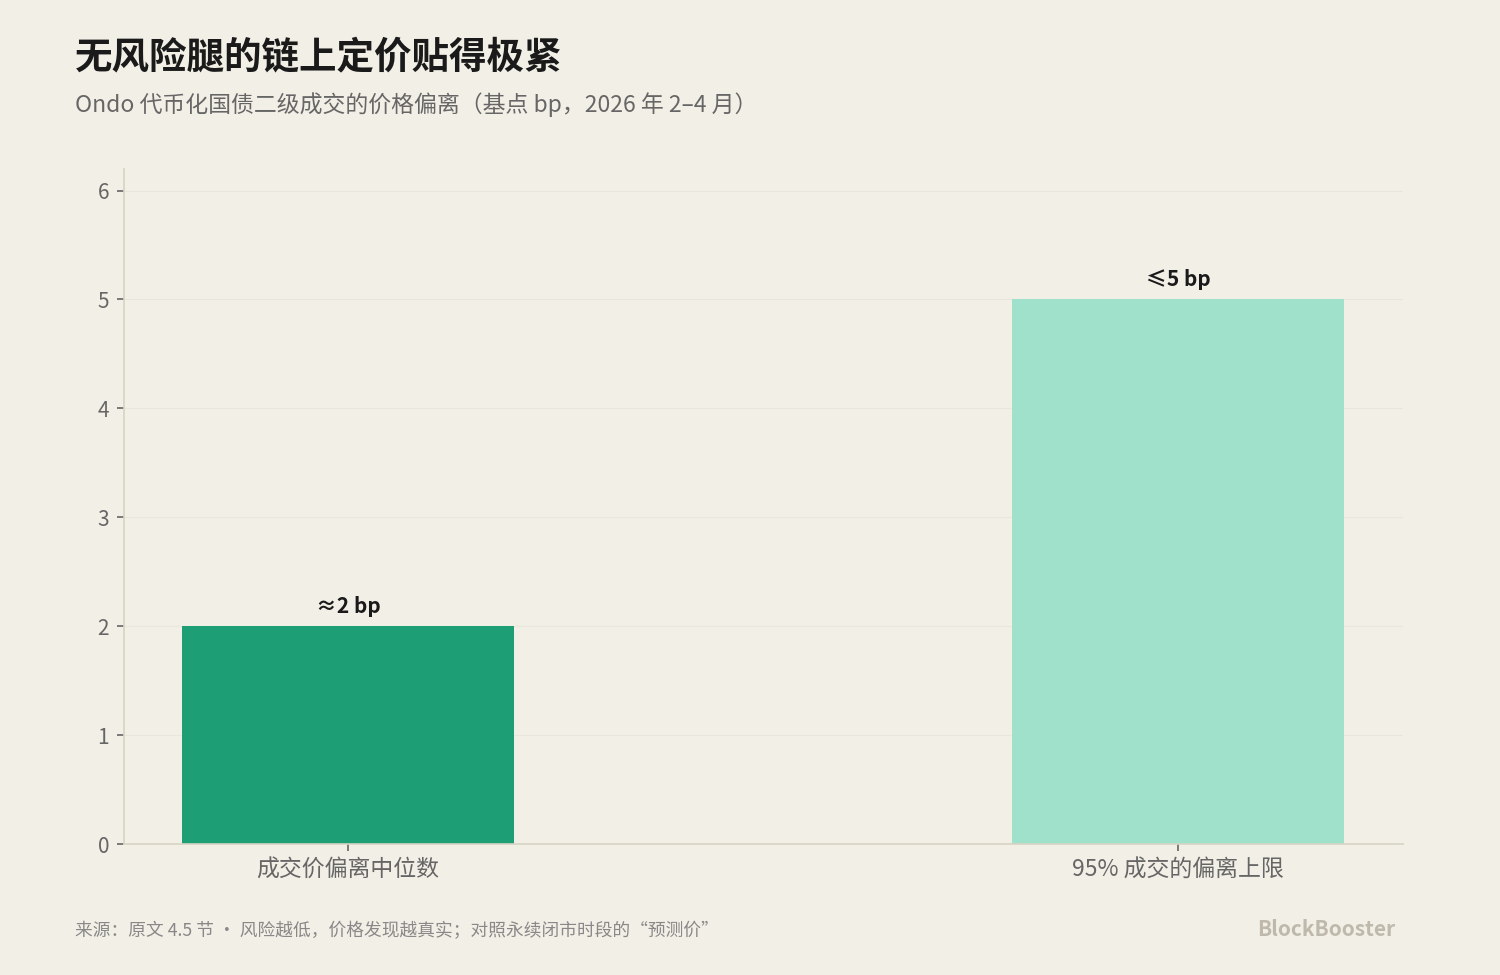
Tokenized Treasuries provide the roughly 4% to 5% “risk-free leg” and are qualified candidates for a crypto risk-free benchmark. Products such as BlackRock’s BUIDL and Franklin Templeton’s BENJI bring Treasury coupon income on-chain. In April 2026, major tokenized Treasury tokens including BUIDL, USDY, USDM and USYC paid about 4.1% to 4.7% APY, closely tracking the three-month U.S. Treasury yield. Their secondary-market pricing is very tight. Ondo’s tokenized Treasury product, for example, traded from February to April 2026 with prices deviating from the median by only about 2 basis points, and 95% of trades falling within 5 basis points. This shows that when the underlying asset is sufficiently standardized and close to risk-free, on-chain price discovery can be very precise. By contrast, the price of higher-risk products such as perpetuals during closed-market periods contains a prediction component.
sUSDe is treated as a securitized product built from perpetual funding plus collateral yield. Its APY depends heavily on funding-rate levels in perpetual markets. For that reason, the article views it as a repackaging of implied rates rather than a benchmark itself. When all seven candidates are placed side by side, they measure different things: leverage sentiment, real lending, algorithmic utilization, governance policy, risk-free coupons and institutional arbitrage. They also contain different risks, including liquidation, counterparty, smart-contract, governance and credit risks. No single candidate currently satisfies all three conditions of broad scope, term structure and governance independence.
The article provides a numerical snapshot as of early June 2026. Tokenized Treasuries such as BUIDL were around 4.1% to 4.7%, serving as the baseline risk-free leg. SOFR, as an overnight TradFi reference anchor, was around 3.61%. Sky SSR was around 3.6% to 3.75%, with a spread of roughly -1% to -0.4% versus Treasuries, attributed to governance setting and protocol credit premium. Aave USDC deposits were around 3.5% to 6%, or about -0.6% to +1.9% versus Treasuries, reflecting smart-contract and utilization premia. Ethena sUSDe had historically ranged from 4% to 17%, with high variability driven by funding rates and collateral yield. Perpetual funding was near neutral at a current low level, with spreads close to zero or even negative. CME basis varies with maturity and sentiment and is normally positive, representing a cleaner institutional financing premium. Bitfinex FRR was about 5.1% annualized, or about 0.0136% per day in early June, with a historical range of 3% to 20%.
The spread logic is written as a set of attributions. Perpetual funding minus Treasury yield is roughly the leverage or short-volatility premium. Bitfinex FRR minus Treasury yield is roughly venue risk premium plus Tether counterparty premium. Aave lending rates minus Treasury yield are roughly smart-contract risk premium. DSR or SSR minus Treasury yield is roughly governance-setting and protocol-credit premium. CME basis minus Treasury yield is roughly the cleaner institutional financing premium. FRR currently looks ordinary because its annualized level of about 5% sits close to tokenized Treasuries at around 4.5%, Aave around 4% to 5.5%, and SSR around 3.6%. The concern is not that FRR is always high, but that in calm periods it compresses near the risk-free rate, while during high-leverage, high-demand or stressed periods it can rise sharply. Using such a rate as the market’s pricing anchor would mean the anchor itself moves violently when stability is most needed.
In traditional finance, if two instruments reflect the same risk but offer different rates, arbitrageurs tend to enter and compress the spread. In crypto, spreads often reflect structural risks that are difficult to arbitrage away. A BIS working paper notes that crypto carry can become very large, sometimes exceeding 40% per year, and can fluctuate sharply over time. Under stress, it can reverse violently: during the FTX collapse, CME carry briefly fell below -50%. Crypto shows negative convenience yield, meaning investors prefer holding futures rather than spot. That is the opposite of commodity markets and resembles certain government-bond market dynamics, where balance-sheet constraints make derivatives more attractive than holding spot. In other words, crypto carry remains large and persistent because regulated capital struggles to hold spot, participates through futures instead, and arbitrage capital is scarce due to margin and liquidation risks.
The article closes by outlining two directions. One is to use tokenized Treasuries as the base risk-free leg, then construct a term curve from CME basis, Bitfinex’s term structure and on-chain interest-rate swaps. The other is to build a governance-neutral aggregated index using multiple sources, reducing concentration by design rather than depending on any single market. The first approach treats the most risk-free available on-chain asset as the anchor and stitches the term structure from existing sources that already have maturities. The second approach emphasizes neutrality and diversification of inputs. In both cases, a crypto benchmark rate would need to separate itself from the current mix of product yields, implied funding rates and venue-specific financing costs.