
The original article was written by @BlazingKevin_, a researcher at Blockbooster. Its central question is direct: the crypto market now supports trillions of dollars in leveraged positions, collateralized lending and yield products, yet those activities still do not rest on a unified benchmark interest-rate curve. Perpetual swaps quote funding rates, lending protocols quote borrowing and deposit APRs, sUSDe quotes staking yield, and tokenized Treasury products quote coupon-like returns. But these figures remain fragmented across exchanges and protocols. In the author’s framing, crypto still does not have its own SOFR — a broadly trusted public reference rate that can serve as a pricing anchor for many other products.
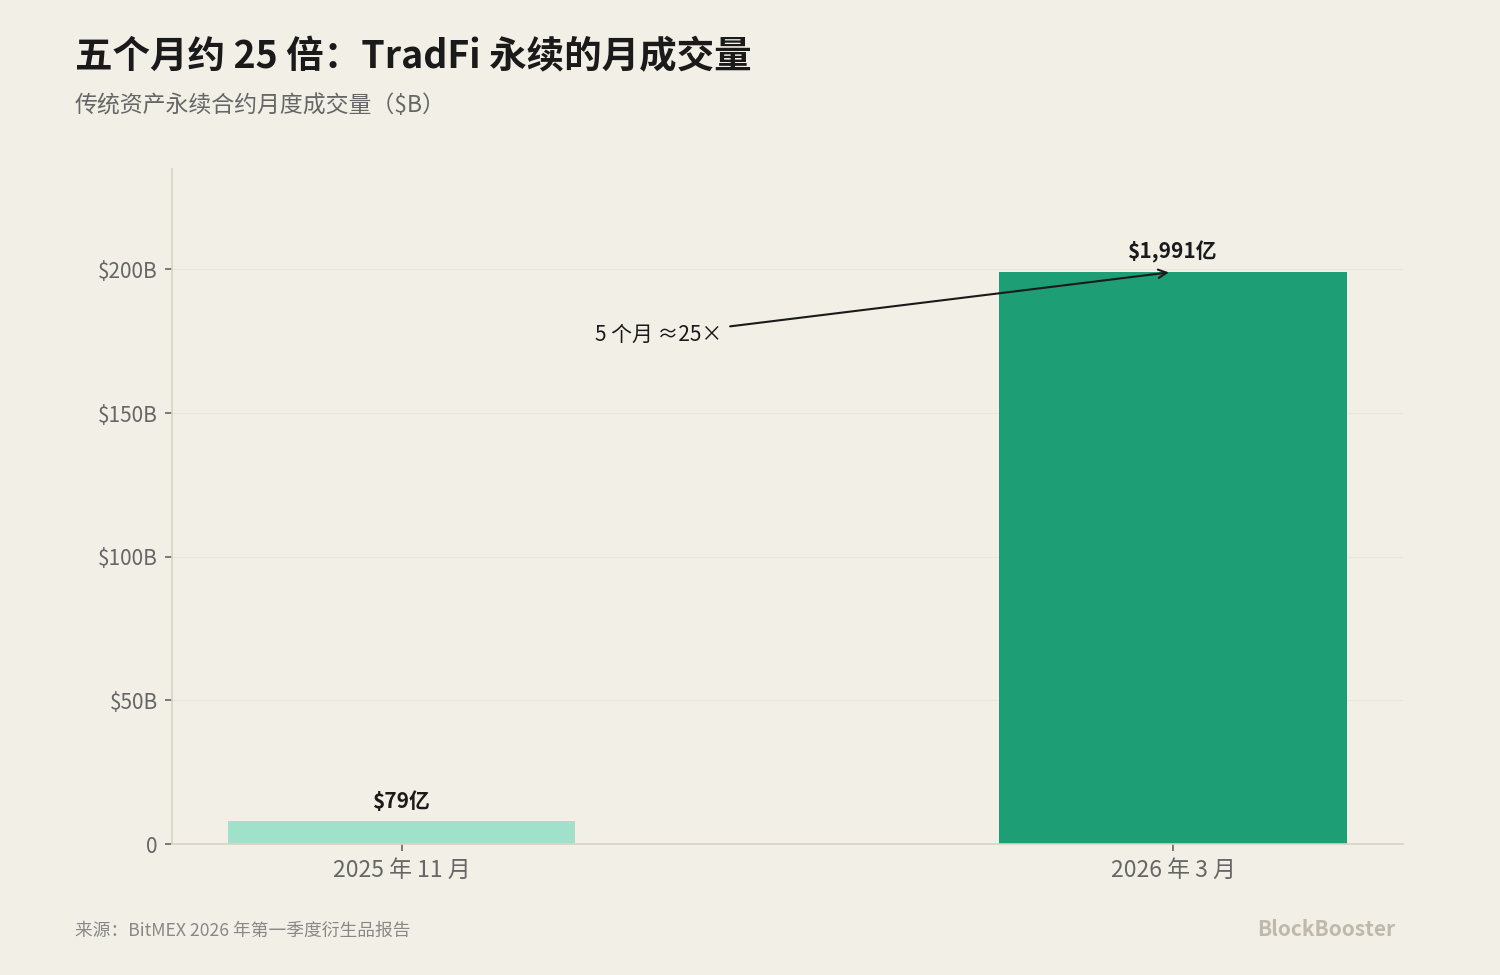
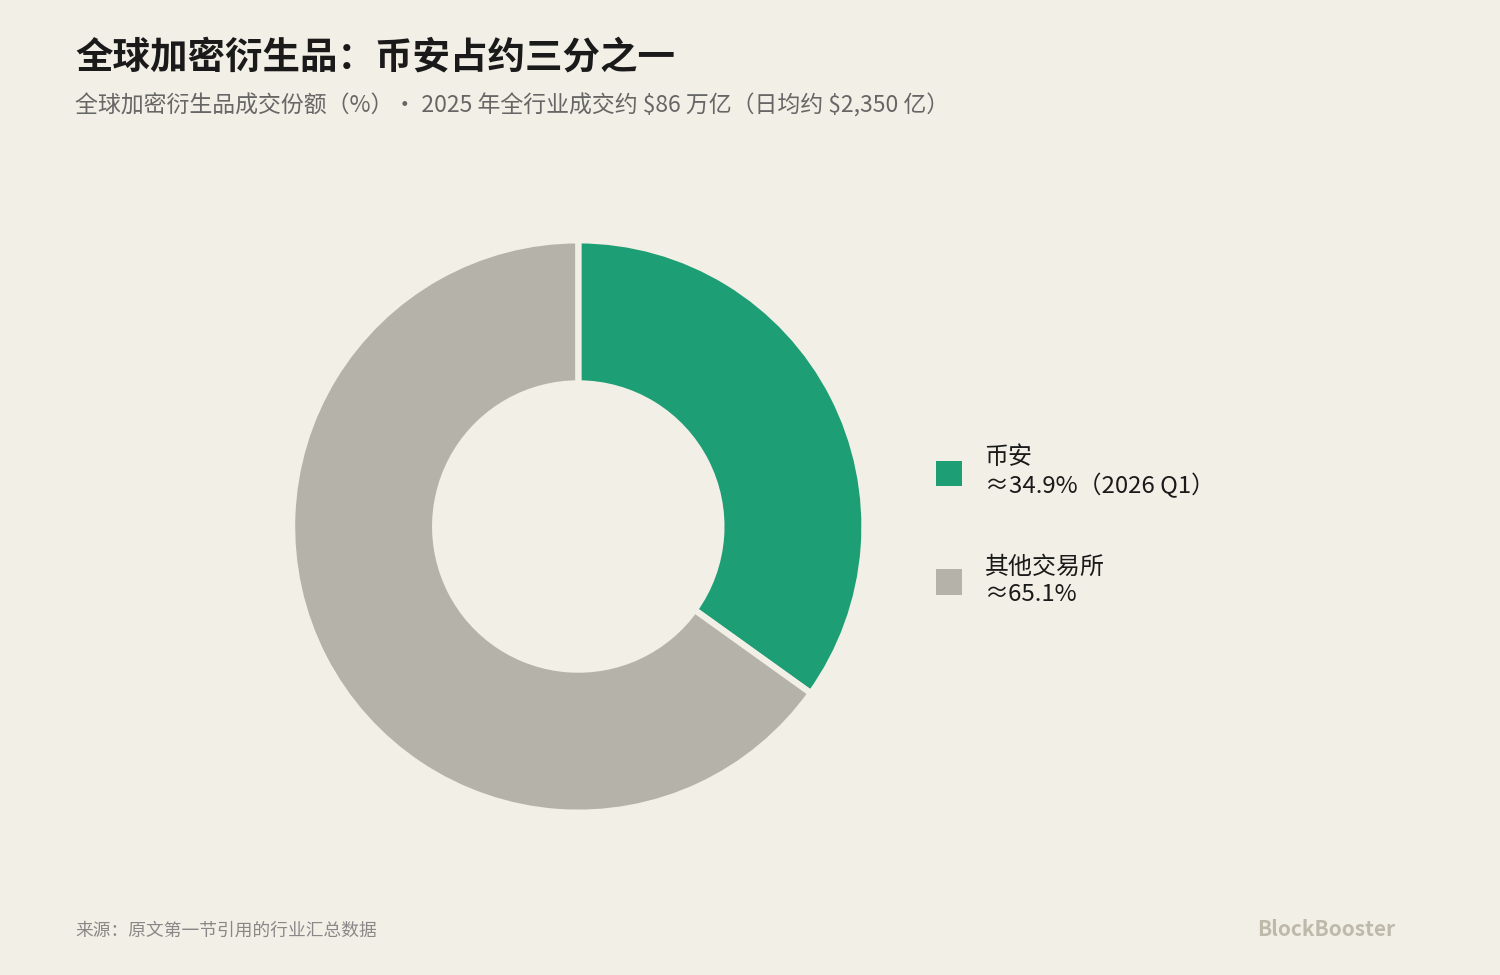
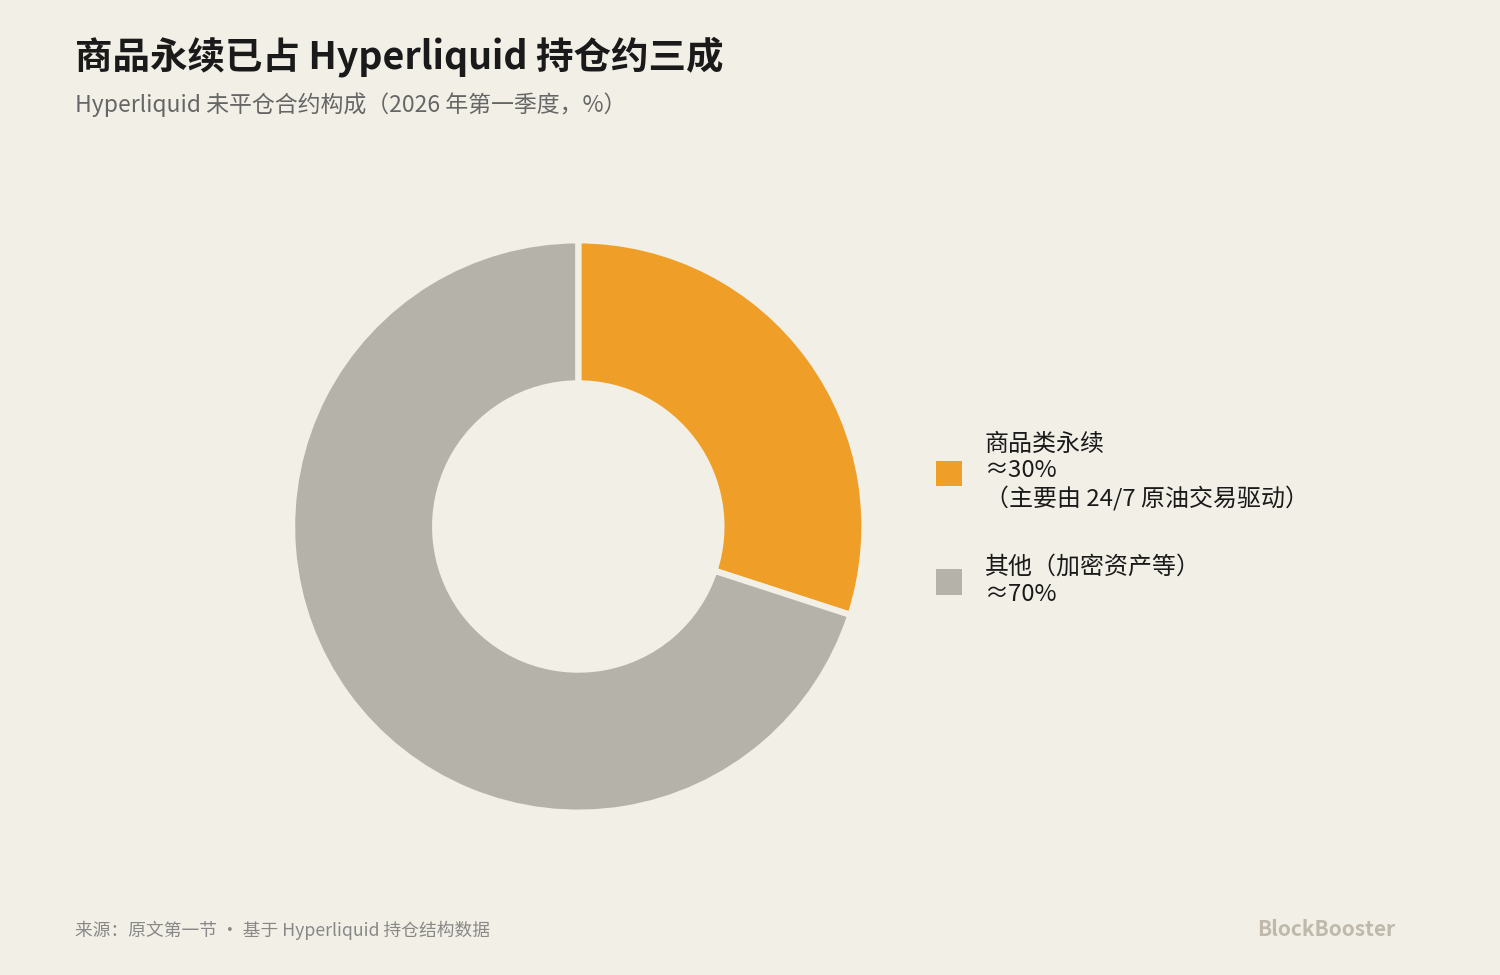
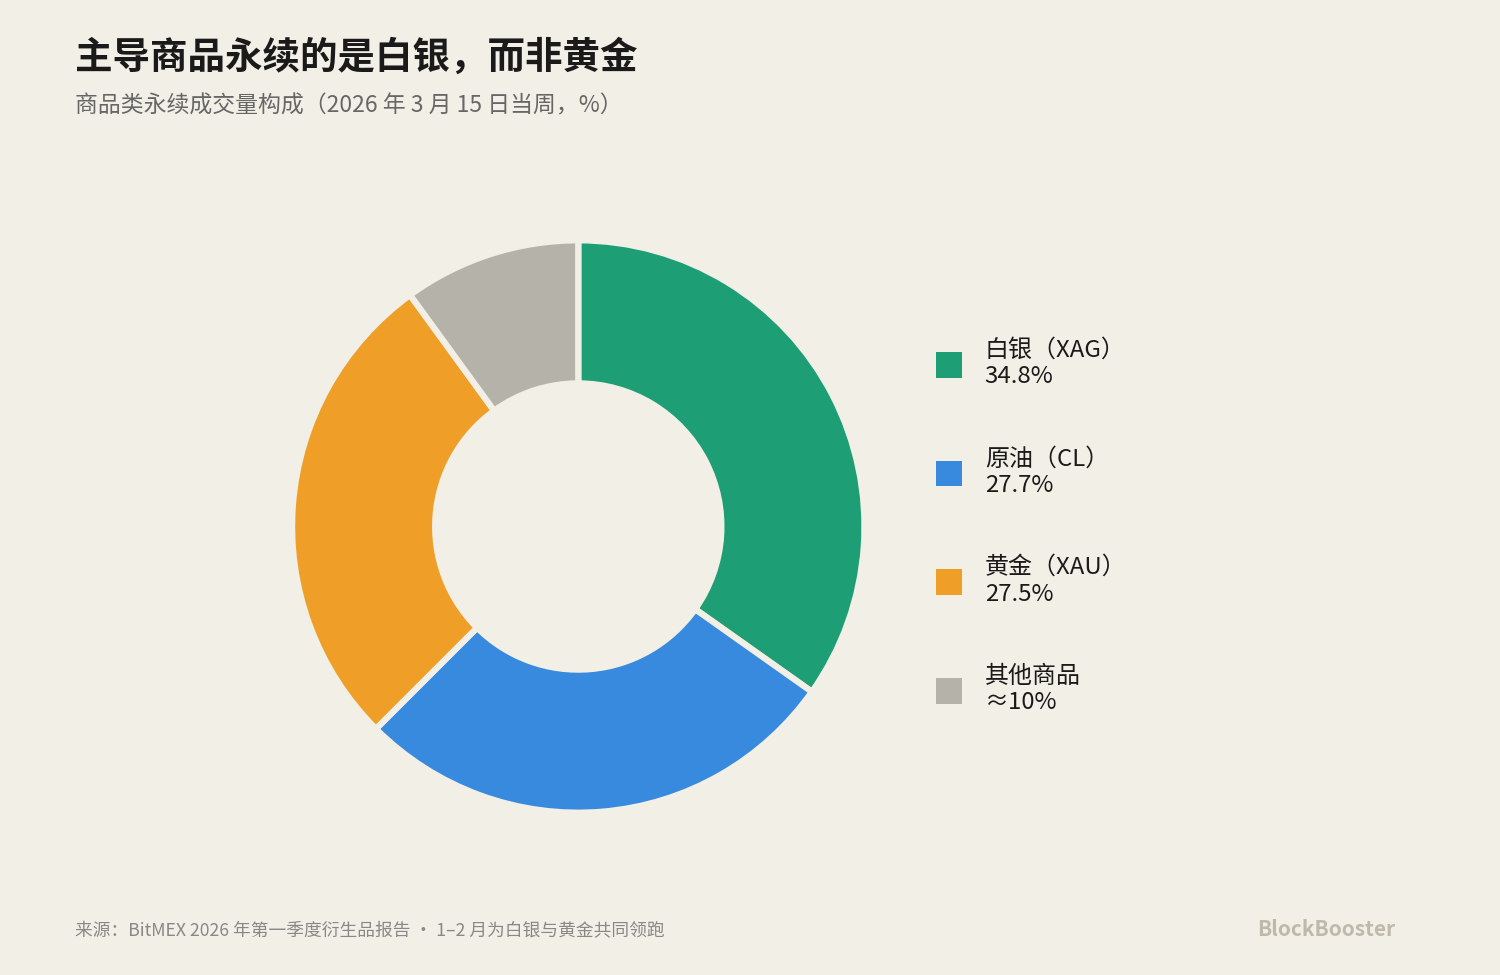
The gap has become more visible as derivatives have expanded into traditional-asset perpetuals. According to BitMEX’s derivatives report for the first quarter of 2026, weekly volume in this emerging sector alone rose from about $525.8 million at the end of 2025 to $30.7 billion in mid-March 2026, an increase of roughly 5,756% for the quarter. Monthly volume grew from $7.9 billion in November 2025 to $199.1 billion in March 2026, around 25 times higher over five months. DefiLlama’s 30-day snapshot showed Hyperliquid processing about $172.63 billion in perpetual volume, with open interest of about $9.13 billion. In the first quarter of 2026, commodity perpetuals accounted for about 30% of Hyperliquid’s open interest, driven mainly by demand for 24/7 crude oil trading.
Many crypto products quote rates, but they are not the same thing
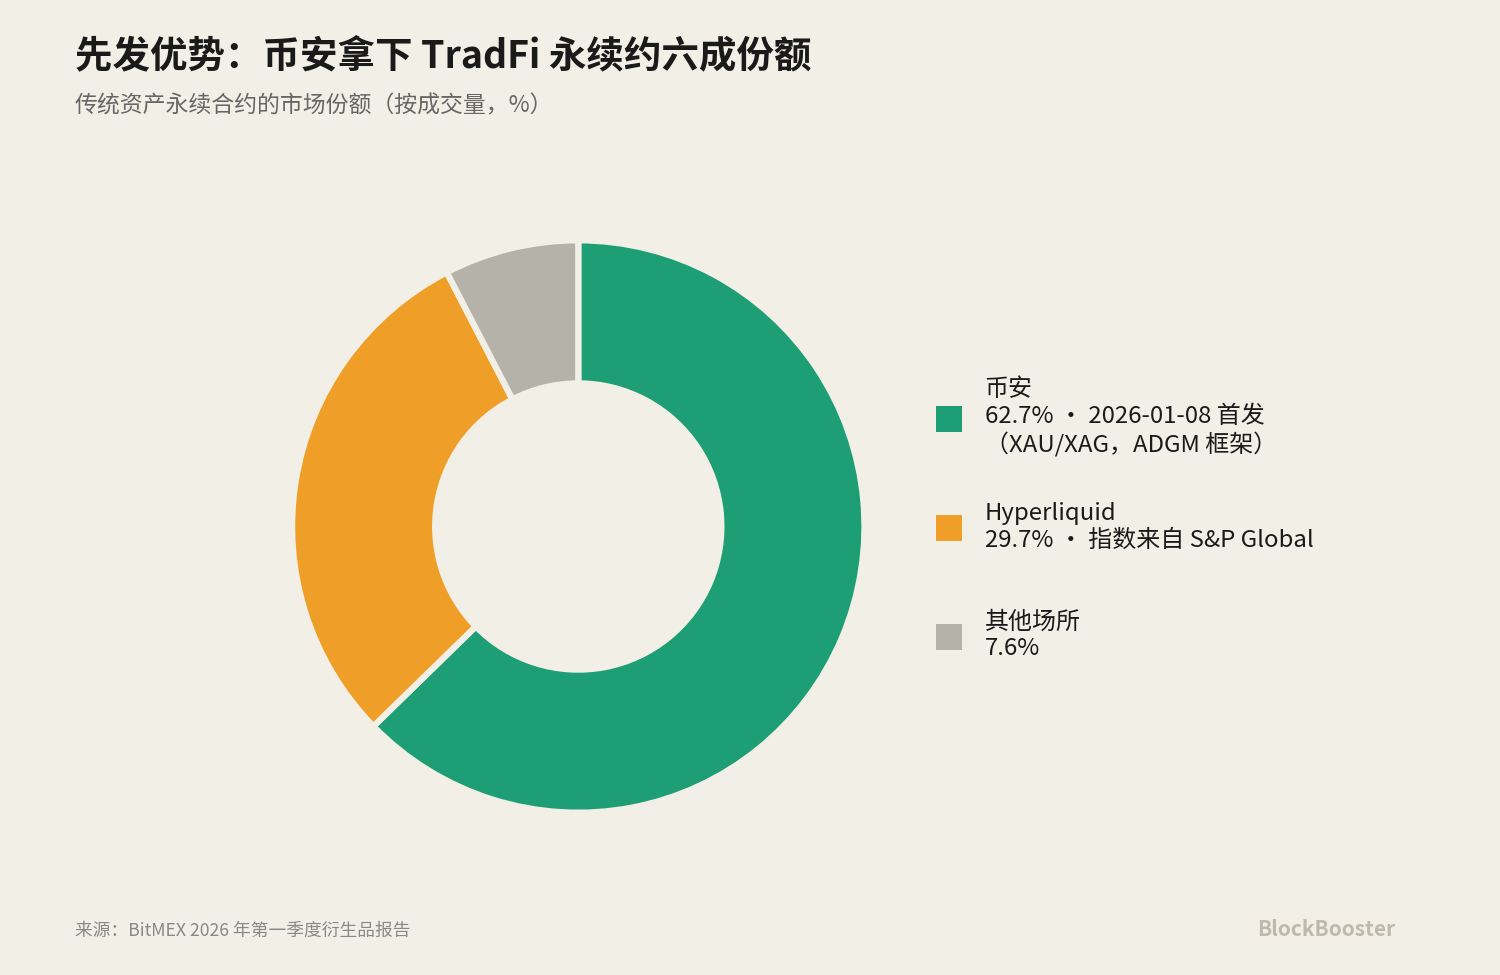
On the traditional-asset perpetual side, Binance launched TradFi perpetual contracts on January 8, 2026, starting with gold, XAUUSDT, and silver, XAGUSDT. With that early move, Binance took about 62.7% of the TradFi perpetual market, while Hyperliquid followed with 29.7%. Hyperliquid’s index data for these traditional-asset perpetuals comes from a partnership with S&P Global. The article notes that this arrangement, which links crypto perpetuals directly to traditional indices, is drawing regulatory scrutiny from the U.S. CFTC. At the same time, Ethena’s USDe market capitalization stood in a range of about $4.5 billion to $5.9 billion in early June 2026.
The article begins by separating three categories that are often described with the same word: rate. The first distinction is between a benchmark funding rate, a product yield and a derivatives-implied rate. The APY on sUSDe is a product yield paid to holders. A perpetual funding rate is a derivatives-implied rate paid between longs and shorts to keep the perpetual price anchored to spot. A benchmark funding rate, by contrast, should be a public reference that many other products can cite and use for pricing. Product yields and implied derivatives rates are downstream of a benchmark, not the benchmark itself.
The second distinction is between overnight rates and term rates. Perpetual funding is settled every one hour or eight hours, so it is essentially an overnight-style rate: it reflects the cost of funding from now to the next settlement point, not a full term structure. It cannot explain the difference between borrowing for 30 days and borrowing for 90 days. The article compares this with SOFR itself, which is also an overnight rate and needs a futures market to construct Term SOFR. A rate with no term structure cannot support a medium- or long-term fixed-income market. The third distinction is between real lending rates and algorithmic or implied rates. A bilateral lending market such as Bitfinex’s margin-funding book matches real lenders and borrowers, while a protocol such as Aave calculates rates automatically from pool utilization through a formula. These are fundamentally different mechanisms for generating prices.
From those distinctions, the author extracts the standards for a qualified benchmark. It should be based on real transactions. The underlying market should be broad and deep enough that one participant cannot easily manipulate it. Governance should be independent, with no conflict of interest between the benchmark administrator and the market being priced. Ideally, it should also have a term structure so that medium- and long-term pricing can be supported. SOFR’s underlying market is real overnight Treasury repo transactions, with average daily volume that often exceeds $1 trillion. The article stresses that this is the real transaction volume of overnight repo and is not the same as the notional volume of futures used to support Term SOFR.
LIBOR’s failure explains why SOFR is the reference model
The Bank for International Settlements has compared on-chain collateralized lending markets to crypto-native money markets. Their mechanics resemble traditional tri-party repo: overcollateralization, mark-to-market liquidation and overnight rolling. Since on-chain lending is structurally a form of repo-like secured financing, the author argues that SOFR — a benchmark built on real repo transactions — is an appropriate structural reference for evaluating a crypto benchmark.
LIBOR, the London Interbank Offered Rate, was once a foundation of global finance. At its peak, around $300 trillion of financial contracts depended on LIBOR across five currency zones, including interest-rate swaps, mortgages, student loans and corporate bonds. But LIBOR had a fatal design flaw: it was not based on real transactions. Instead, a small group of panel banks submitted daily estimates of their own borrowing costs. After the 2008 financial crisis, regulatory investigations found that traders at several large global banks had systematically manipulated LIBOR submissions to benefit their derivatives positions. The manipulation scandal led directly to LIBOR’s abolition.
SOFR, the Secured Overnight Financing Rate, was designed almost as a reverse engineering of LIBOR’s weaknesses. It does not use self-reported estimates. It is based on actual overnight repo transactions secured by U.S. Treasuries. It takes a volume-weighted median across three repo markets: tri-party repo, GCF repo and bilateral repo cleared through FICC’s DVP service. The scope is wide, the market is deep, and a single participant has less room to control the result. SOFR is administered by the Federal Reserve Bank of New York and follows the IOSCO Principles for Financial Benchmarks, with no conflict of interest between the administrator and the market being priced.
SOFR still has one inherent limitation: it is an overnight rate and has no term structure by itself. Markets need more than today’s overnight cost; they also need the expected funding cost over the next three months and other tenors to price medium- and long-term loans. CME therefore introduced CME Term SOFR, a forward-looking set of rates covering one-month, three-month, six-month and 12-month tenors. It uses SOFR futures trading data to infer the market’s expected path for future SOFR and thereby constructs a forward term curve. The representative notional volume of SOFR futures used to construct Term SOFR was about $2.3 trillion per day in the fourth quarter of 2023.
Seven candidate rates show who actually sets the price
The article then dissects the main candidates that are commonly treated as crypto rates or yields. One axis runs through the entire discussion: who has the right to decide the rate? It can be market-weighted, algorithmically determined by utilization, or set through governance. Perpetual funding rates are the implied price of leverage, driven by the basis between spot and perpetual markets. They are essentially overnight rates and have no term structure. When the spot market for a TradFi underlying is closed, such as weekend trading in stocks or precious metals, exchanges cannot obtain a real spot price to calculate funding. Binance freezes the index price at the last spot price and switches to an EWMA mark price capped at ±3%. Hyperliquid also switches to EWMA during weekends and sets volatility caps by asset. During closed-market periods, the anchor for a perpetual price is therefore a forecast value rather than a real traded price. When the real market reopens and gaps beyond the cap, limit-up or limit-down situations can appear.
Bitfinex’s margin-funding market offers a different example. Bitfinex operates a peer-to-peer funding market in which lenders provide funds to margin traders and earn interest. The key design detail is that funding terms range from two to 120 days, with common tenors such as two days, seven days and 30 days. Both rate and tenor must match when an order is executed. This means Bitfinex’s funding book naturally forms a real lending curve from the short end to the longer end: 30-day money and 120-day money can carry different prices, and those prices come from matched supply and demand. It is one of the few crypto-native dollar funding markets that naturally contains a term structure.
FRR, or Flash Return Rate, is the reference rate within that market. It is calculated as the size-weighted average rate of all active fixed-rate funding and is updated once per hour. In substance, it is the Bitfinex version of a reference benchmark: an index that reflects the current average market borrowing cost. Lenders can choose to lend directly at FRR, allowing their rate to follow the market automatically. Bitfinex charges about 15% on lending income, or 18% for hidden orders, and the minimum order size is $150. FRR is quoted as a daily rate and annualized from that daily rate. The Bitfinex USD FRR was about 0.0136% per day, or around 5.1% annualized, broadly in the same range as tokenized Treasuries, Aave and SSR.
The critical issue for FRR is volatility. Historical USD lending rates have moved roughly between 3% and 20% APR and are strongly linked to leverage demand. This daily-rate curve across two- to 120-day tenors is a rare crypto-native dollar funding curve with real term structure, but its market structure is concentrated. Bitfinex and Tether share the same parent company, iFinex, and their management overlaps. That gives Bitfinex deep USDT liquidity, which is one reason its funding market is so deep. At the same time, it concentrates counterparty risk and stablecoin-issuer risk inside the same corporate complex. Borrowing through Bitfinex, using Bitfinex matching, denominating activity in Tether and relying on the same parent company in extreme cases produces a highly self-contained structure.
Compared with LIBOR and SOFR, FRR is cleaner than LIBOR on the dimension of real transactions. It is based on actual completed fixed-rate funding weighted by size, so it reflects genuine market behavior rather than estimates. But it comes from the order book of a single exchange, is operated by iFinex, the same parent company that controls the largest stablecoin, Tether, and that operator is also described in the article as the lender of last resort for positions in this market. On concentration and conflict of interest, FRR touches the very problems that SOFR was designed to remove.
Aave represents algorithmic utilization pricing. Its rates are not determined by bilateral matching; they are automatically generated by a preset formula based on the utilization of a liquidity pool. The higher the utilization, the higher the rate, and the number moves in real time with borrowing demand. The USDC deposit rate on Aave mainnet fluctuates around 3.5% to 6% depending on utilization. On Morpho, curator-managed USDC vaults produce around 5% to 7% after curator fees. Sky’s DAI DSR and USDS SSR are different again: they are policy-like rates set directly by governance. Functionally, DSR and SSR resemble policy rates set by a central bank. They are not created through market matching and are not triggered by pool utilization. They are determined by Sky governance votes.
These three mechanisms — DSR and SSR through governance setting, FRR through market weighting, and Aave through algorithmic utilization — form a clear contrast. Each has its own credibility issues and manipulation risks. The article states that a mature market’s benchmark should come from the mechanism that is hardest to manipulate: market-weighted real transactions in a sufficiently broad and deep market. Numerically, SSR was lowered by governance from 4.75% at the end of April 2026 to about 3.6% to 3.75% in early June. USDS circulation was about $11 billion.
Tokenized Treasuries, sUSDe and the spread map
Tokenized Treasuries form the approximately 4% to 5% risk-free leg and are presented as a candidate for a crypto risk-free benchmark. BlackRock’s BUIDL, Franklin Templeton’s BENJI and similar products bring Treasury coupon income on-chain. In April 2026, major tokenized Treasury tokens such as BUIDL, USDY, USDM and USYC paid about 4.1% to 4.7% APY, closely tracking the three-month Treasury yield. Their yields can be compared almost directly with traditional risk-free rates.
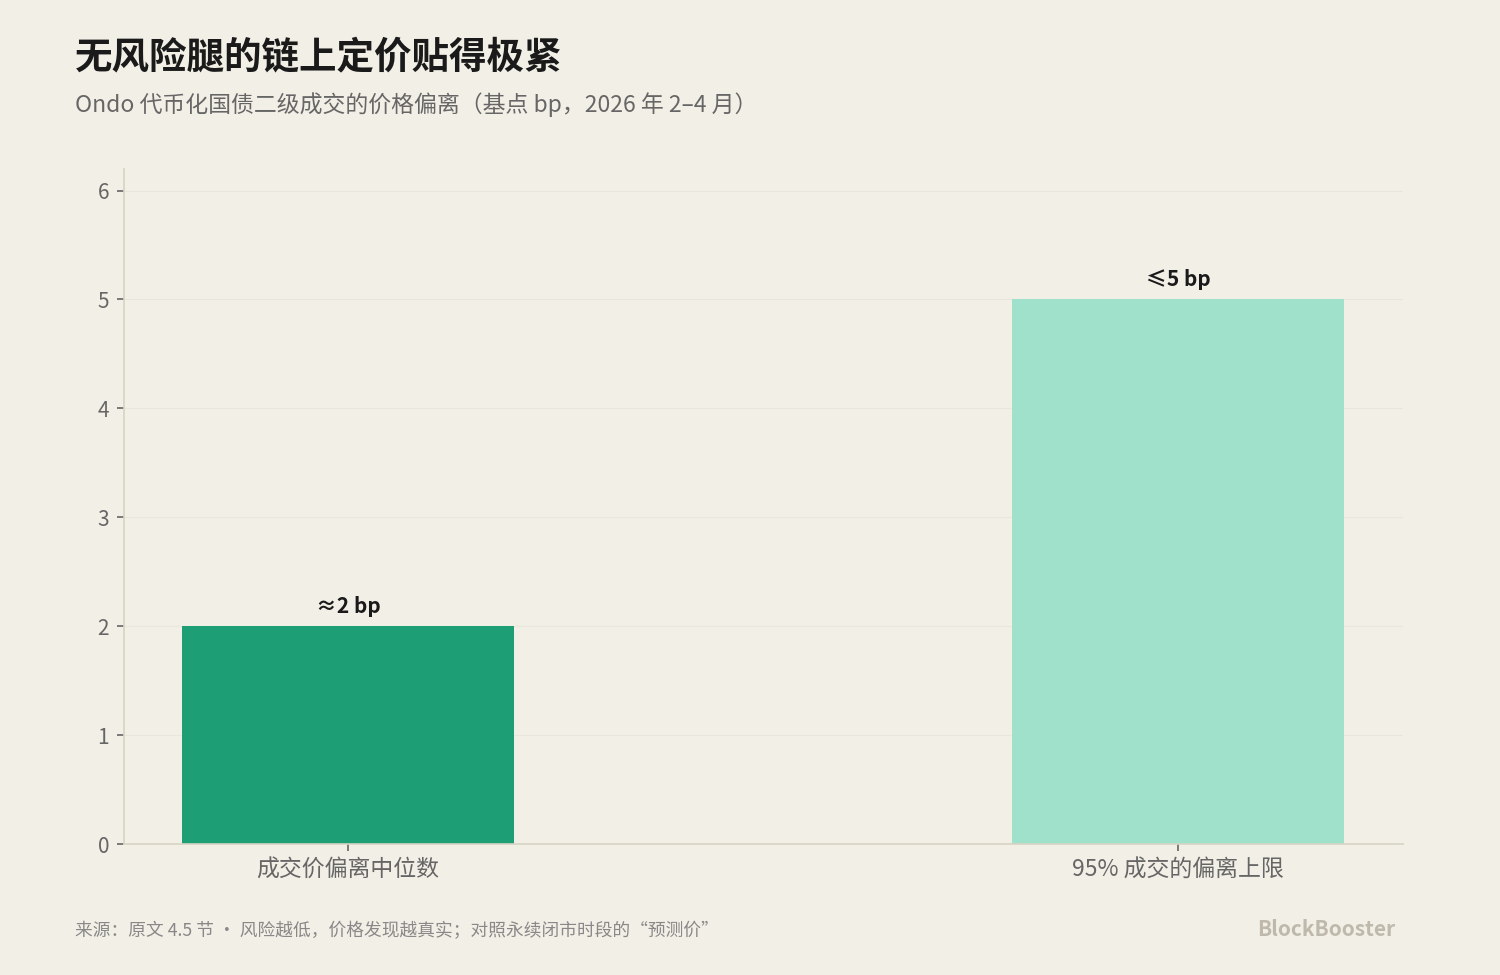
The secondary-market pricing of this risk-free leg is also tight. Using Ondo’s tokenized Treasuries as an example, from February to April 2026, executed prices deviated from the median by only about two basis points, and 95% of trades were within five basis points. The author uses this as evidence that when the underlying asset is sufficiently standardized and sufficiently risk-free, on-chain price discovery can be highly precise. In contrast, the price of higher-risk instruments such as perpetuals during traditional-market closing periods contains far more forecasting. Lower risk produces more real pricing; higher risk makes pricing look more like estimation.
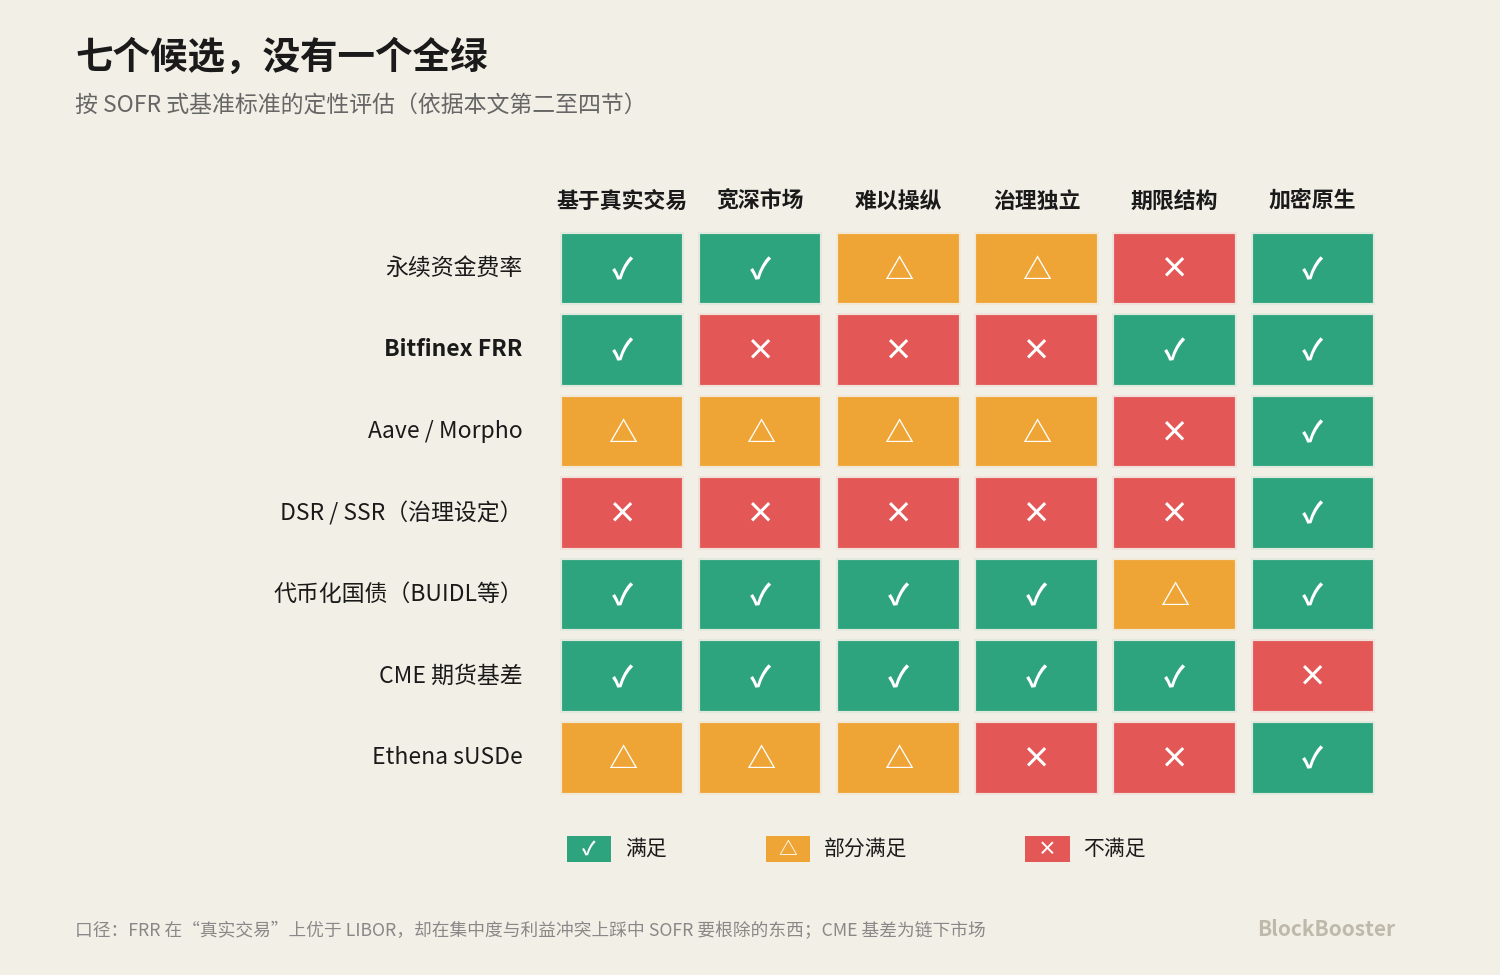
Ethena’s sUSDe is described as a securitized product built from perpetual funding rates plus collateral yield. Its APY is highly dependent on the level of funding rates in the perpetual market. For that reason, it is a repackaging of implied rates rather than a benchmark itself. When all seven candidates are placed side by side, they each measure different things: leverage sentiment, real lending, algorithmic utilization, governance policy, risk-free coupons and institutional arbitrage. They also embed different risks: liquidation, counterparty risk, smart-contract risk, governance risk and credit risk. Different actors set their prices. None currently satisfies all three conditions at once: broad coverage, term structure and governance independence.
The article provides a numerical snapshot for early June 2026. Tokenized Treasuries such as BUIDL were around 4.1% to 4.7%, serving as the baseline risk-free leg. SOFR overnight, used as a TradFi comparison anchor, was about 3.61%. Sky SSR was about 3.6% to 3.75%, around negative 1% to negative 0.4% relative to Treasuries, attributed to governance setting and protocol credit premium. Aave USDC deposits were about 3.5% to 6%, or roughly negative 0.6% to positive 1.9% relative to Treasuries, reflecting smart-contract and utilization premia. Ethena sUSDe had a historical range of 4% to 17% with sharp fluctuations, driven by funding rates and collateral yield. Perpetual funding was near neutral and low at the time, close to zero or even negative relative to Treasuries, and moved with long-short sentiment. CME basis varied with tenor and sentiment and normally stayed positive as a cleaner institutional financing premium. Bitfinex FRR was around 5.1% annualized, or about 0.0136% per day, with a historical range of 3% to 20%.
The spread logic can be written as a set of attributions. Perpetual funding minus Treasury yield is roughly leverage or short-volatility premium. Bitfinex FRR minus Treasury yield is roughly venue risk premium plus Tether counterparty premium. Aave lending rates minus Treasury yield are roughly smart-contract risk premium. DSR or SSR minus Treasury yield is roughly governance setting and protocol credit premium. CME basis minus Treasury yield is roughly a clean institutional financing premium. Looking specifically at Bitfinex FRR, its current level near 5% annualized sits close to tokenized Treasuries around 4.5%, Aave around 4% to 5.5% and SSR around 3.6%. The spread is thin in calm periods. The danger is not simply that FRR fluctuates; it is that the anchor itself can jump sharply when the market most needs stability, because USD lending rates have historically swung from 3% to 20% APR and can rise rapidly during high-leverage, high-demand or stressed conditions.
In traditional finance, if two instruments reflect the same risk but offer different rates, arbitrageurs quickly step in and compress the spread. In crypto, the article argues, spreads are often the market’s way of pricing structural risk. A BIS working paper cited in the article states that crypto carry can become extremely large, sometimes exceeding 40% per year, and can fluctuate sharply over time. In moments of stress, it can reverse violently. During the FTX collapse, CME carry once fell below negative 50%. Crypto also displays negative convenience yield: investors prefer holding futures rather than spot. This is the opposite of commodity markets and resembles the dynamics of some government bond markets, where balance-sheet constraints make derivatives more attractive than holding the cash asset. In the author’s summary, crypto carry is large and not arbitraged away because regulated capital has difficulty holding spot assets and participates through futures, while arbitrage capital is scarce due to margin and liquidation risk.
Based on the regulatory trend and the direction of capital flows discussed in the article, the proposed direction is a combination of tokenized Treasuries as the base risk-free leg, plus a term curve assembled from CME basis, the Bitfinex term structure and on-chain interest-rate swaps. Another route is a governance-neutral aggregated index. The first approach treats the risk-free leg as something that should be anchored by the asset closest to risk-free status, while the term curve must be spliced together from existing sources that already contain term structure. The second approach avoids dependence on any single source by building a neutral, multi-source index. As of the article’s comparison, however, no single crypto rate yet combines broad market scope, term structure and independent governance.