



Microsoft and Alphabet are scheduled to report after the close on Oct. 28, with Amazon next and Exxon Mobil and Chevron wrapping up the week. The main question heading into this earnings stretch is no longer only how much AI demand can keep growing. It is also about the cash cost required to support that growth.
Over the past two years, investors were willing to pay a premium for the long-term payoff from cloud computing and AI infrastructure. As capital spending keeps rising and free cash flow comes under pressure, the calculation changes. The market is now asking whether orders can turn into revenue quickly enough, whether revenue can absorb depreciation, and how much cash ultimately remains for shareholders.
This week, Microsoft, Alphabet and Amazon are expected to address the return profile of AI investment. Exxon Mobil and Chevron offer a different reference point: when profit turns into cash, and that cash can be directed to dividends, buybacks and debt reduction, what valuation does the market assign to that kind of asset?
About 160 S&P 500 companies are reporting this week, and cash flow is at the center
According to a compilation from TradingKey and company filings, roughly 160 S&P 500 companies are set to report this week. Microsoft, Alphabet, Amazon, Exxon Mobil and Chevron are among the most closely watched names. Microsoft and Alphabet are due after the close on Oct. 28. Amazon and Intel follow after the close on Oct. 29. Eli Lilly and Caterpillar are scheduled before the open on Oct. 29. Exxon Mobil and Chevron come at the end of the week on Oct. 30.
At the same time, memory makers including Samsung Electronics, SK Hynix and Kioxia are also due to report. Demand and cost across AI infrastructure have become a shared issue spanning U.S. equities and Asian technology stocks.
The market had already started to signal some of this tension. The source article says the Roundhill MAGS ETF had fallen nearly 7% from its high for the year in the previous week, while Meta dropped about 18% from its peak after free cash flow turned negative, citing an Oct. 26 report.
That does not mean investors have stopped believing in AI. The shift is narrower and more specific. As AI demand keeps expanding, investors want to know how much capex, depreciation and financing costs will rise with it. Once revenue growth alone is no longer enough to justify valuation, the cash flow statement becomes the next test.
AI leaders are spending at a massive pace, and the market is asking whether cash generation can keep up
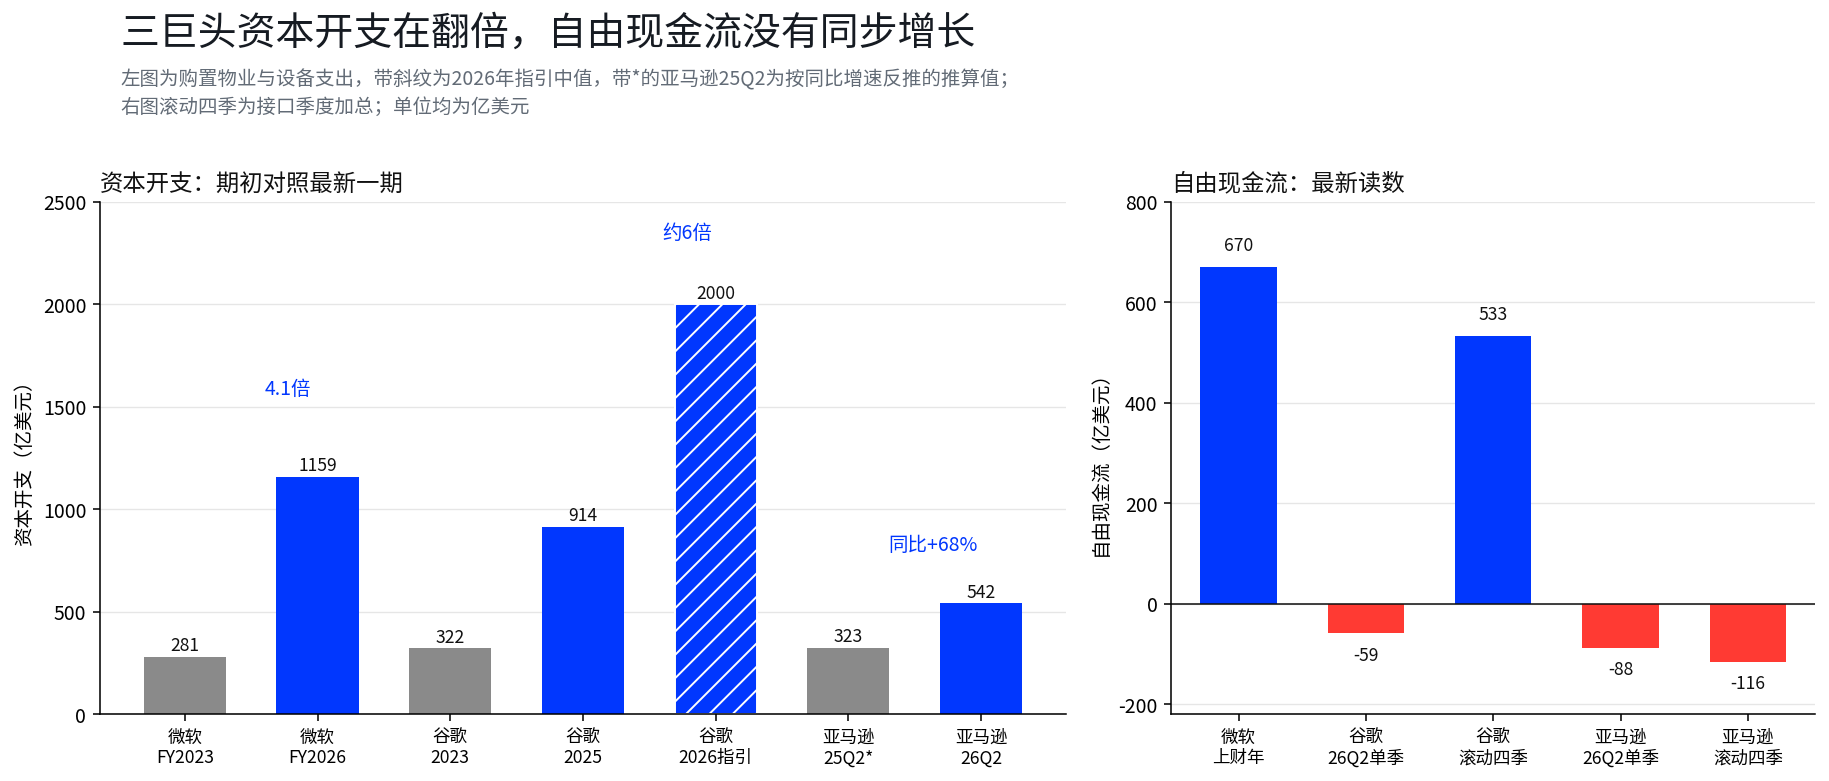
The article says the three large technology companies spent a combined roughly $134.9 billion on property and equipment in the previous quarter, about double the level from a year earlier, based on company disclosures. AI infrastructure buildout is still accelerating. What matters now is that the gap between the pace of investment and the pace of cash return is widening.
Alphabet's capital expenditure rose from $32.2 billion in 2023 to $91.4 billion in 2025, with 2026 guidance centered around $200 billion, according to interface data and company guidance cited in the piece. On that basis, the article estimates average quarterly spending in the second half at roughly $57.2 billion to $62.2 billion, well above the second-quarter figure of $44.9 billion. The point is not just how much was spent in one quarter. It is whether the spending curve is still steepening.
Amazon faces a similar cash burden. Second-quarter capex was $54.2 billion, up 68% year over year. Free cash flow was about negative $18.2 billion in the first quarter and about negative $8.8 billion in the second quarter, marking two straight quarters of net outflow.
Microsoft offers another version of the same mismatch. In fiscal 2026, defined here as July 2025 through June 2026, capex reached about $115.9 billion, 4.1 times the $28.1 billion recorded in fiscal 2023. Over the same period, free cash flow rose only from $59.5 billion to about $67 billion, based on interface data and fiscal-year figures cited in the article. Investment expanded by far more than cash return.
Demand support is not absent. Alphabet disclosed cloud backlog of about $514 billion, and Amazon's compute orders extend to 2028. The unresolved issue is how quickly those orders can become revenue and profit, and how much additional capex is needed to deliver them.
Free cash flow yields trail Treasury yields, adding pressure to tech valuations
A single quarter of negative free cash flow can be distorted by payment timing and the schedule of spending. The article argues that a trailing four-quarter total is a better way to judge cash creation. On interface data, Alphabet still generated about $53.3 billion in trailing four-quarter free cash flow, so one negative quarter does not mean the prior year's cash generation has collapsed.
Amazon's trailing four-quarter free cash flow is listed at about negative $11.6 billion, while a reported figure cited in the article shows negative $7.6 billion. The difference may come from lease-accounting treatment, and the source text notes both numbers side by side. Microsoft's free cash flow in the last fiscal year was $66.987 billion.
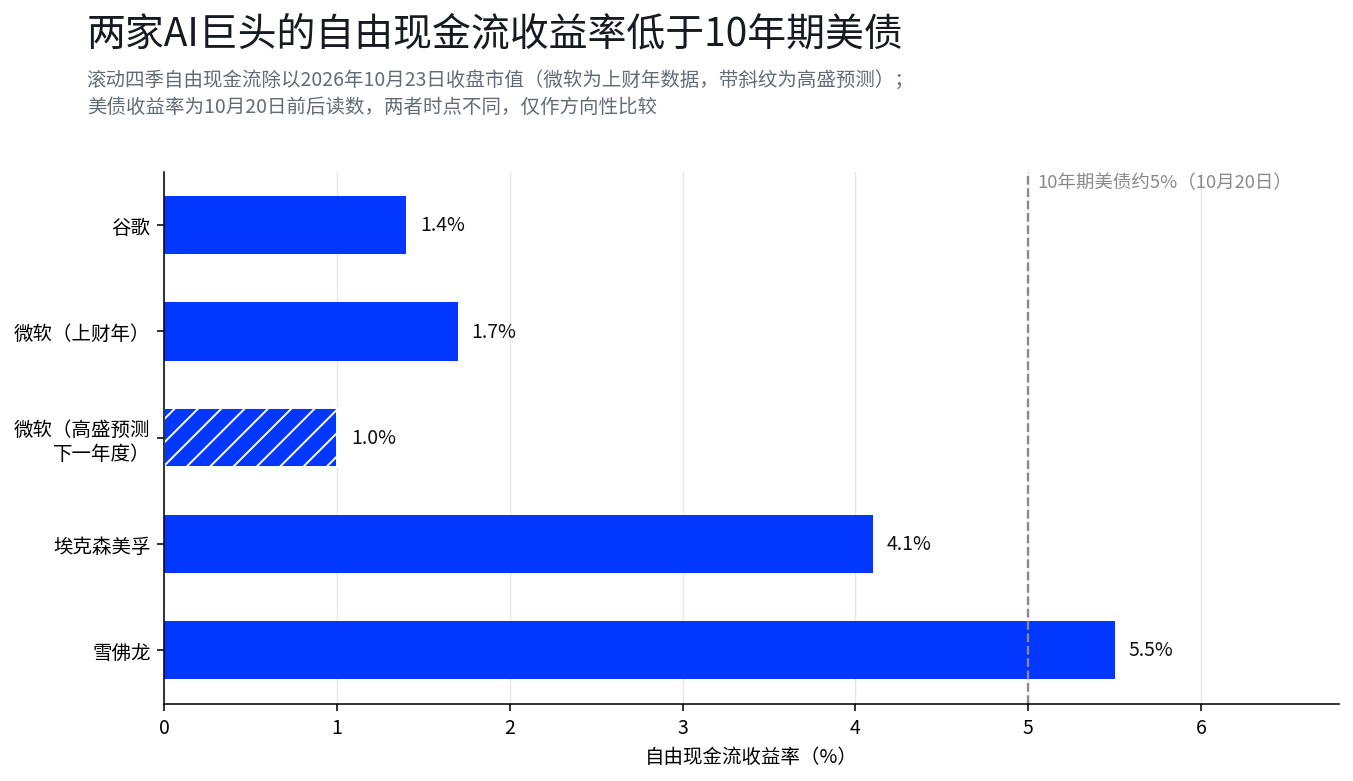
Comparing free cash flow with market value makes the valuation issue easier to see. Using trailing four-quarter data and market capitalization at the Oct. 23 close, the article estimates Alphabet's free cash flow yield at about 1.4% and Microsoft's at about 1.7% for the last fiscal year. If Goldman Sachs' forecast is realized, with Microsoft's free cash flow falling from $67 billion to $40.1 billion, that figure would drop to about 1.0% in the next year. Around the same time, the 10-year U.S. Treasury yield was near 5%.
The article is explicit that this comparison does not prove Treasuries are superior to technology stocks. Equity cash flow can grow with the business, and bond yields are not the same thing as long-term total return on stocks. What the comparison does show is that when the risk-free rate is high, current valuations need stronger future cash-flow growth to hold up.
Energy majors provide a different benchmark. Using the same method, Exxon Mobil and Chevron show free cash flow yields of about 4.1% and 5.5%, respectively, above or close to Treasury levels. The market is effectively comparing how much cash today's price can buy, and how much risk must be taken to get future growth.
Orders are not cash receipts: when does AI infrastructure earn back its cost?
The return on AI infrastructure depends on three things in the article's framework: how quickly orders convert, how intense capex remains, and how much depreciation new assets add once they are in service.
On order conversion, Alphabet's cloud backlog stands at about $514 billion. Using second-quarter cloud revenue of $24.8 billion and annualizing it simply, the article derives annual revenue of about $99.2 billion and a static ratio of roughly 5.2 times. It stresses that this is not a payback period and does not mean backlog will be recognized evenly over five years. It is a way to show the distance between order size and current revenue. Management commentary on delivery timing, revenue recognition and possible changes in customer demand will matter.
On spending scale, reported data cited in the article puts Amazon's 2026 capex plan at about $220 billion, already above AWS revenue of about $168.8 billion over the past four quarters, calculated as $42.2 billion times four. The article notes that the two figures are not directly comparable because capex supports multiple years and multiple businesses, while AWS revenue is current-period revenue from one segment. Even so, the ratio illustrates how much front-loaded investment AI infrastructure requires and how much short-term pressure that can place on cash flow.
Depreciation is another key variable. Media compilations cited in the article put combined 2026 capex for the three tech giants at about $670 billion. Using a static straight-line depreciation assumption over five to six years, the article estimates additional annual depreciation of roughly $110 billion to $130 billion once all of that spending is placed into service. It also says this is only a static scenario. It does not mean all spending enters service in the same year or uses the same useful life. The real question is whether gross profit from incremental cloud revenue can cover the added depreciation, and when margins begin to feel the effect.
The article also places counterarguments in the same frame. Cloud revenue still carries upside from both pricing and volume growth, and Microsoft has already told investors that free cash flow will return to growth, according to the cited report. In valuation terms, the key variable is the gross-margin structure of incremental revenue. The absolute spending number matters less than that relationship, which is why the earnings call language is so important.
Energy majors are being judged on how profit turns into distributable cash
Unlike AI companies that are still spending heavily on future capacity, energy majors are being judged on whether profit becomes cash and where that cash goes.
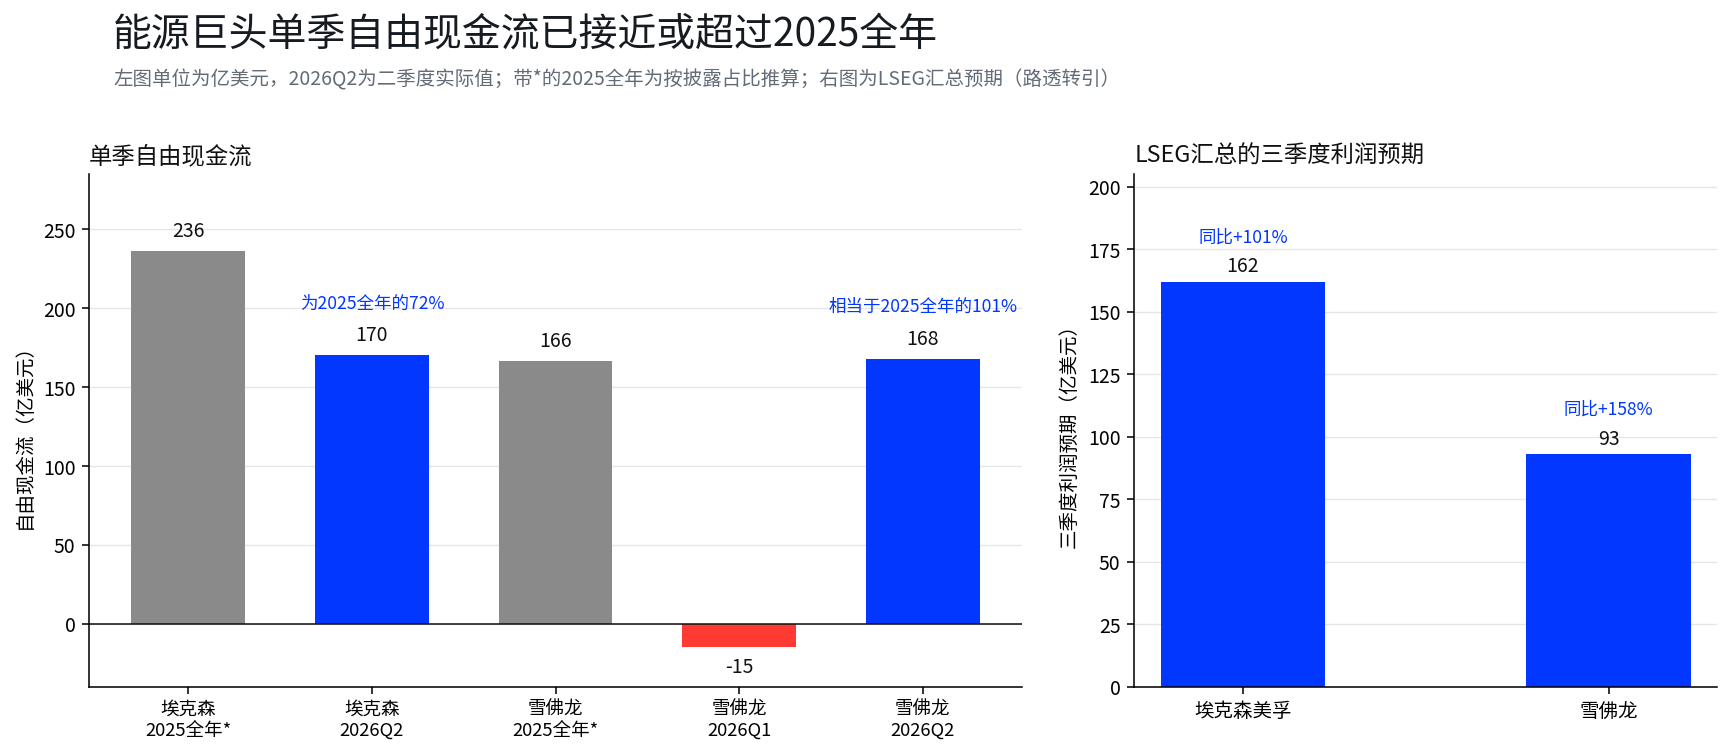
Based on LSEG consensus data cited through Reuters, Exxon Mobil is expected to post about $16.2 billion in third-quarter profit, up about 101% year over year, while Chevron is expected to report about $9.3 billion, up about 158%. The article says calculations using interface data and the prior-year base produce roughly 115% and 163%, with the gap versus LSEG possibly explained by adjustments, so the text uses the LSEG figures as the main reference. These are still expectations and await confirmation in the formal reports, but they show what the market is pricing in.
Cash-flow data adds another layer. Exxon Mobil generated about $23.555 billion in operating cash flow and about $17.028 billion in free cash flow in the second quarter, equal to 72% of its full-year 2025 total in one quarter. Quarterly capex stayed around $6.5 billion and did not expand with oil prices. Chevron posted about $16.807 billion in second-quarter free cash flow, equal to about 101% of its full-year 2025 total. Full-year capital spending is trending toward the low end of the $18 billion to $19 billion range, according to a Goldman Sachs note cited secondhand in the article. The same section also notes that Chevron's first-quarter free cash flow was negative $1.5 billion, so one strong quarter should not be projected across the full year without caution.
For the energy sector, the issue is not only how much can be earned when oil prices rise. It is whether companies can keep capex under control and continue directing cash to dividends, buybacks and lower leverage. If third-quarter earnings meet expectations, Exxon Mobil's trailing price-to-earnings ratio would fall from about 23 times to about 18 times, based on net-income aggregation and market-cap calculations in the article. Combined with a trailing free cash flow yield of about 4%, that would make the stock's appeal less dependent on another move higher in oil. The article also says that conclusion still depends on oil prices, refining margins and capital-return policy, and cannot rest on one quarter's profit growth alone.
Caterpillar's backlog covers expected second-half revenue, but the stock has still pulled back sharply
Caterpillar's report is presented as a test of whether AI investment is still feeding through to the real economy. The company is due before the open on Oct. 29. Market expectations cited in the article call for revenue of about $20.7 billion, up about 17% year over year, and adjusted EPS of about $7.
Bernstein estimates Caterpillar's backlog at about $77 billion, equal to roughly 0.93 times annualized revenue, using an annualized third-quarter expectation of about $82.8 billion. The article says that backlog already covers 100% of expected revenue for the second half of 2026, versus a historical average of about 60%, based on research cited secondhand. Demand for power equipment, cooling systems and heavy machinery tied to data-center expansion is described as direct support for those orders.
Still, a full order book does not guarantee profit growth. In the week before earnings, Caterpillar shares were down about 33.89% from the June 30 closing high, according to TIKR data cited in the article. The market is still checking whether backlog can convert into shipments and revenue on schedule, and whether sales growth in power equipment can maintain the 29% pace seen in the second quarter. Orders show demand. Shipments, gross margin and cash collection determine what that demand is worth.
Eli Lilly is expensive, but its cash generation is easier to see
Eli Lilly is scheduled to report before the open on Oct. 29. Market expectations cited from RBC Capital and public reports call for third-quarter EPS of about $8.38 and revenue of about $22.97 billion. Using interface data as the base, the article estimates revenue growth of about 31% year over year and EPS growth of about 35%, with quarter-on-quarter performance broadly flat. Management commentary is expected to clarify whether that growth slope is holding.
At about 45 times earnings, based on trailing four-quarter net income of roughly $26.7 billion and market capitalization at the Oct. 23 close, Eli Lilly is not cheap. The article's point is that its growth logic is different. Prescription-driven drug revenue and AI infrastructure investment are two separate paths.
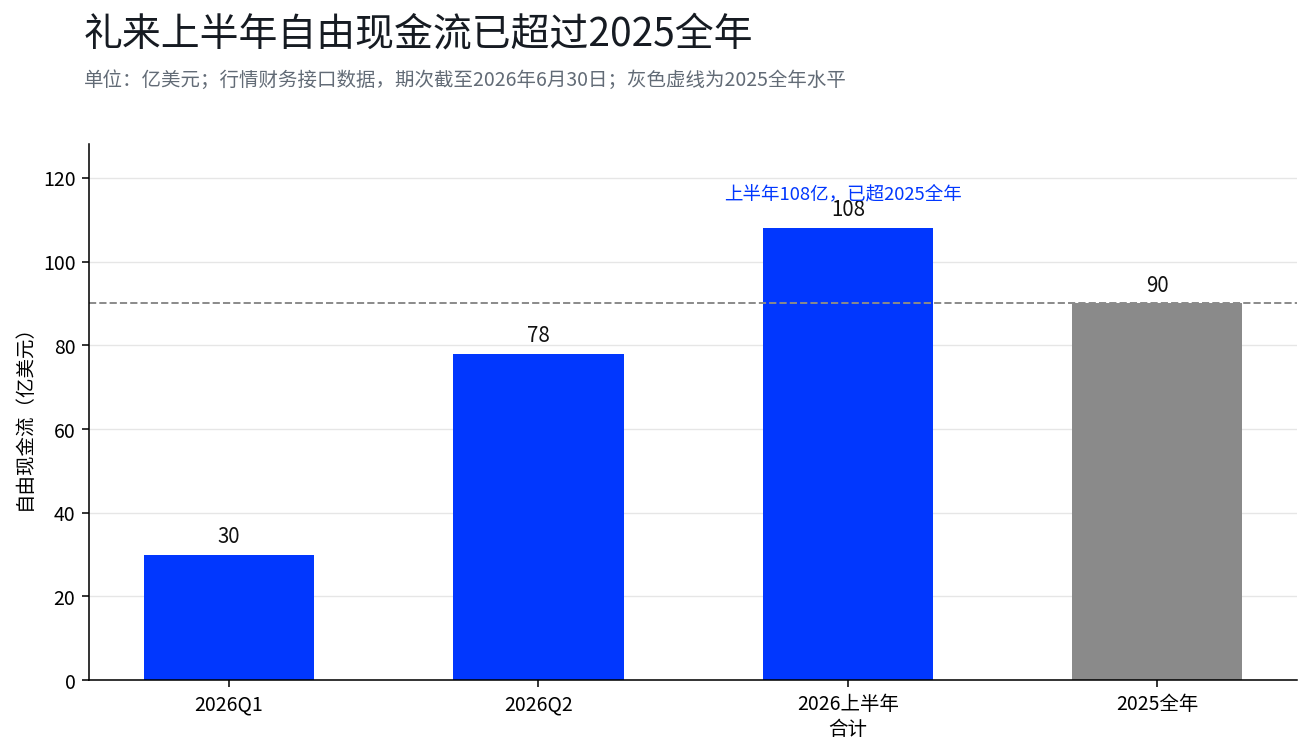
The company generated free cash flow of $3 billion in the first quarter and $7.8 billion in the second quarter, for about $10.8 billion in the first half, already above the $9 billion recorded for full-year 2025. The article notes that this kind of cash flow still faces risks from research spending, competition and drug pricing, but it does not depend on technology companies continuing to expand capex at the same pace.
In a week when AI-linked assets are being repriced, Eli Lilly represents a different kind of exposure. The question for investors is how much they are willing to pay for visible revenue growth and visible cash creation.
Three lines on earnings calls matter most: capex, depreciation and order conversion
The article closes by narrowing the earnings-week checklist to three areas: capital spending, depreciation and order realization.
First comes 2027 capex guidance. Whether spending slows or accelerates will shape how long the cash-flow warning lasts. Second comes the match between depreciation and margins. The article points specifically to Azure growth at constant currency and asks whether it can absorb rising depreciation, and when incremental gross profit will cover the added depreciation burden. That is effectively the timetable for cash flow to recover. Third comes orders and collections: the pace of revenue recognition for cloud backlog, and the delivery progress on Amazon's compute orders that extend to 2028.
In the article's framing, this earnings week is about putting different assets back on the same table and comparing cash-flow quality, timing of realization and valuation cost. AI giants may still justify heavy spending through cloud growth and compute demand, but investors want a clearer path to returns. Energy majors, by contrast, need to show that current cash flow can keep turning into dividends, buybacks and balance-sheet improvement, rather than depending only on a favorable short-term price environment.
The article also says the transmission is crossing markets. Rotation between more certain U.S. assets and higher-beta AI assets may already be affecting Hong Kong-listed technology shares and dividend plays, with consecutive southbound net selling over the past two weeks presented as another reading of the same logic.
Methodology and source notes in the original article
The earnings calendar and company count were compiled from TradingKey weekly previews, MarketBeat, CNBC and Eastmoney, dated Oct. 25 to Oct. 26, 2026.
Financial statement data including revenue, net income, operating cash flow, capex and free cash flow came from a market-data financial interface, with the latest period through June 30, 2026, and historical periods aligned by reporting date. Microsoft figures use fiscal-year data from July 2025 through June 2026, while trailing four-quarter figures are built from quarterly sums.
The article says capex in the text and charts is measured as spending on property and equipment disclosed by each company and excludes finance-lease principal. It also notes that lease accounting differs across companies, and figures affected by that issue are separately marked. For free cash flow yield comparisons, market capitalization is taken from the Oct. 23, 2026 close, while the 10-year Treasury yield near 5% reflects readings around Oct. 20, so the comparison is directional rather than point-in-time exact.
It further states that free cash flow yield, the roughly 5.2-year Google order-conversion comparison, the Amazon capex-versus-AWS-revenue comparison, depreciation scale, and valuation calculations for Eli Lilly and Exxon Mobil are the article's own estimates rather than company or institutional disclosures.
The figures for Alphabet's $514 billion cloud backlog, Amazon's roughly $220 billion 2026 capex and reported trailing free cash flow were cited secondhand from reports by OANDA, Benzinga and Wallstreetcn, without line-by-line verification against original filings. The Microsoft free cash flow forecast, from $67 billion down to $40.1 billion, was cited secondhand from Goldman Sachs research dated Oct. 15 to Oct. 16, 2026.
Energy profit expectations came from LSEG and Reuters, cited through OilPrice.com and Yahoo Finance on Oct. 21, 2026. Details on Exxon Mobil refining profit came from the company's 8-K preview and BMO estimates cited secondhand. Caterpillar backlog and coverage ratios came from Bernstein and Citi research cited through Investing.com between Oct. 12 and Oct. 14, 2026. Share-price and expected revenue data came from TIKR on Oct. 23, 2026. Eli Lilly expectations came from RBC Capital and public reports in October 2026. Closing prices and market capitalizations came from a market-data interface at the Oct. 23 close.
The original article also states that the content is for general information and market commentary only and does not constitute investment advice, investment research, an offer, a solicitation or a recommendation regarding any security, investment product or trading strategy.