
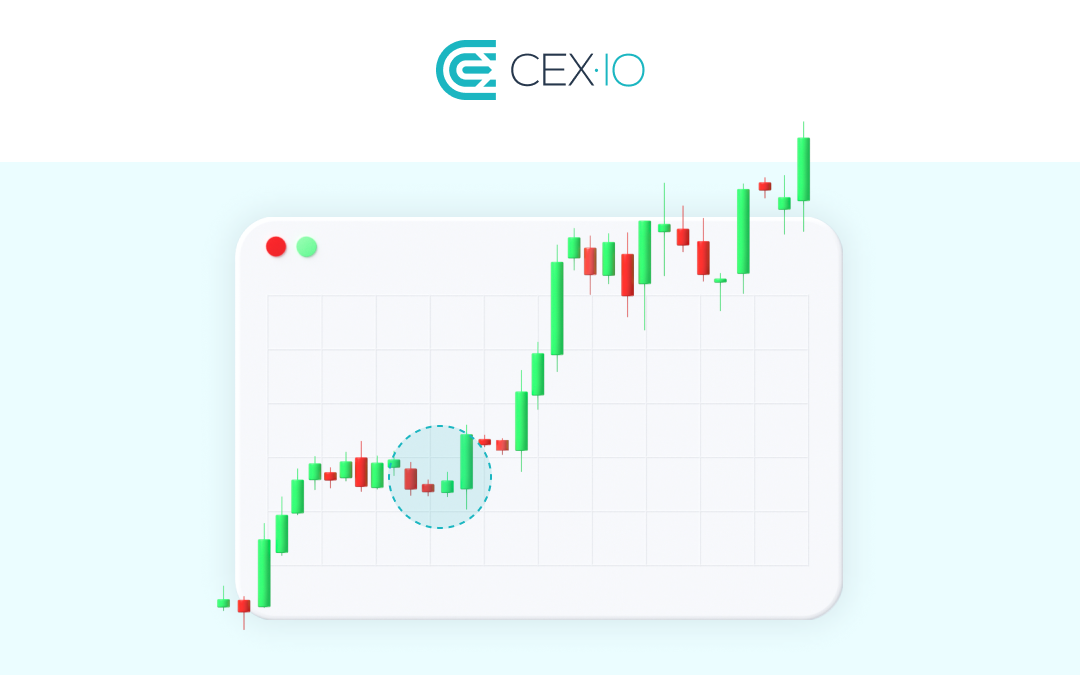
EMA, or the exponential moving average, remains one of the most widely used tools in crypto trading. Unlike the simple moving average, or SMA, it gives more weight to recent prices, so it reacts faster to fresh market moves. Traders often use it in two ways: buying or selling around key EMA support and resistance levels, and tracking bullish or bearish crossover signals between shorter and longer EMAs.
Why traders use EMA instead of SMA
A moving average smooths past price data over a selected period, helping reduce the impact of random short-term fluctuations. SMA treats each data point equally. EMA does not. Because recent closes carry more influence in the calculation, EMA tends to respond more quickly when momentum starts to shift.
Common moving-average settings include round-number periods such as 10, 30, 50, 100, and 200. In EMA trading, Fibonacci-based settings are also widely followed, including 8, 13, 21, 34, 55, 89, and 144. On different timeframes, these lines are often treated as possible support or resistance zones.
Using EMA support and resistance in trade setups
One of the most common approaches is simple in structure: buy when price pulls back to a major EMA support and sell when it reaches a major EMA resistance. The source notes that day traders often focus on the 8 EMA and 21 EMA, while longer-term participants are more likely to watch the 55, 144, and 200 EMA. In Bitcoin’s case, the 144-day EMA has at times acted as support during uptrends and as near-precise resistance during downtrends.
Another approach looks for extreme deviations from a chosen EMA. If price falls far below a key EMA by a margin that stands out against historical behavior, some traders may treat that move as a possible buy signal. The same logic applies on the upside when price stretches unusually far above an EMA. The source stresses that this should be measured against past retracements and advances rather than using a fixed distance rule.
Fake breakdowns, fake breakouts, and higher-timeframe closes
A break below support does not always mean the setup has failed. A move above resistance does not automatically confirm a clean breakout either. The article highlights both bear traps and bull traps. Bear traps can shake out weak hands, keep sidelined traders from entering, or liquidate margin shorts. Bull traps can catch buyers after an apparent upside move. One point is clear: false signals are common.
To judge whether a breakout is real, traders are advised to watch the next few candle closes on a higher timeframe than the one being traded. If the setup is based on 4-hour EMAs, the daily close matters. If the trade is built around daily EMAs, then the weekly or monthly close becomes more relevant. Larger timeframes carry more weight in trend assessment, and that matters a great deal when EMA levels are being tested.
EMA crossovers: golden cross and death cross
The second major EMA method is crossover trading. When a faster EMA rises above a slower EMA, traders usually call it a bullish crossover or a golden cross. When the faster EMA drops below the slower one, it is treated as a bearish crossover or death cross. Many traders use those moments as buy or sell triggers.
Even so, crossovers are not instant signals. They often lag behind price, and that lag tends to increase on longer timeframes and with larger EMA lengths. The source gives a Bitcoin example on the 3-day chart, where the 55 EMA crossed below the 144 EMA. Even after 15 days, price had not yet broken out of sideways consolidation. On the bullish side, the article points to Zilliqa’s ZIL/BTC daily chart in 2020: the 55-day EMA crossed above the 144-day EMA on May 15, followed by an approximately 500% gain in the pair over the course of a year.
Shorter timeframes create more noise
The article also warns that EMA crossovers can generate many fake signals, especially on shorter timeframes. That includes daily charts. A crossover may appear, yet price can stall or move the other way. Because of that, some traders prefer to focus on 3-day, weekly, or monthly crossover structures instead of lower-timeframe signals.
No EMA method is presented as a certainty. Before acting, the source suggests waiting for several bullish or bearish candle closes and checking momentum tools such as RSI and stochastic RSI for confirmation. EMA can help identify trend direction, support, and resistance, but fakeouts, invalid signals, and conflicts with higher timeframes remain part of the process, which is why position sizing also matters.