

Gate Research Institute has released a research note focused on chart pattern analysis and breakout trading strategy, offering a structured review of how traders can read price formations, assess breakout quality, and apply risk management in actual market execution. The study frames chart patterns as a visual expression of changing supply and demand, arguing that price action compresses the ongoing struggle between buyers and sellers into recognizable structures that can help traders organize decisions more systematically.

The report says the practical value of pattern analysis does not come from memorizing shapes in isolation. Instead, traders need to evaluate each setup in the context of the prevailing trend, trading volume, support and resistance, the duration of consolidation, and whether a breakout is truly accepted by the market. In that sense, breakout trading is presented as the most direct application of chart pattern analysis, because it focuses on what happens when price finally leaves a well-defined structure and begins choosing direction.
The framework behind chart patterns
At the theoretical level, the report relies on two familiar assumptions of technical analysis. First, prices tend to move in trends. Second, history often repeats in similar ways. In an uptrend, buyers usually dominate; in a downtrend, sellers usually lead. But trends do not extend forever. When bullish and bearish forces move toward temporary balance, price tends to enter a consolidation phase, and that is where chart patterns begin to form.
Once consolidation is complete, price may either continue in the direction of the previous trend or reverse entirely. This is why the study divides chart patterns into two broad categories: reversal patterns, such as double tops, double bottoms, head-and-shoulders tops, and inverse head-and-shoulders bottoms; and continuation patterns, such as flags, triangles, and rectangles. Gate Research Institute also notes that the same pattern should not be interpreted rigidly, because its meaning can change depending on where it appears, the timeframe involved, and the associated volume structure.
Rectangles, flags, and pennants
In the section on rectangle formations, the report explains that a rectangle emerges when price oscillates between two roughly parallel boundaries of support and resistance. This usually signals indecision in the market. Although rectangles are often treated as continuation patterns, they can also evolve into reversal structures. The deciding factor is the direction of the eventual break and whether that move is confirmed by meaningful volume expansion. In both bullish and bearish rectangles, the expected post-break move is often estimated using the height of the rectangle itself.
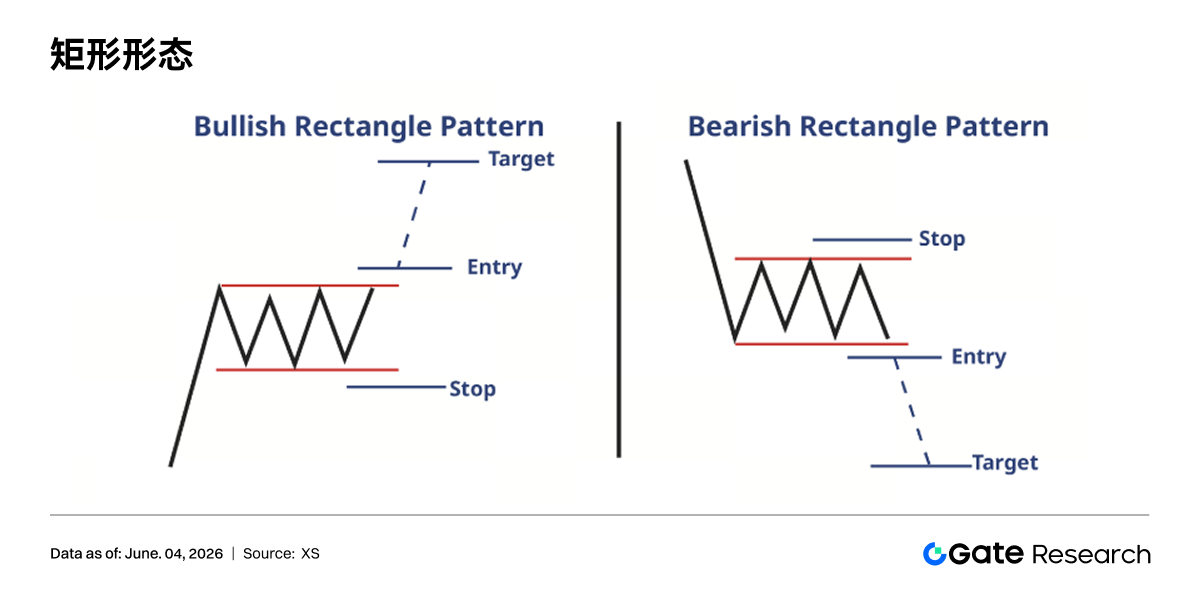
A bullish rectangle typically appears during an uptrend when price pauses and moves sideways between two horizontal levels before resuming higher. A breakout above resistance, especially on rising volume, is considered confirmation that the broader uptrend remains intact. A bearish rectangle forms in a downtrend when price stabilizes temporarily within a horizontal band before breaking lower again. In that case, the rectangle height can be projected downward from the breakdown point to estimate the next target zone.
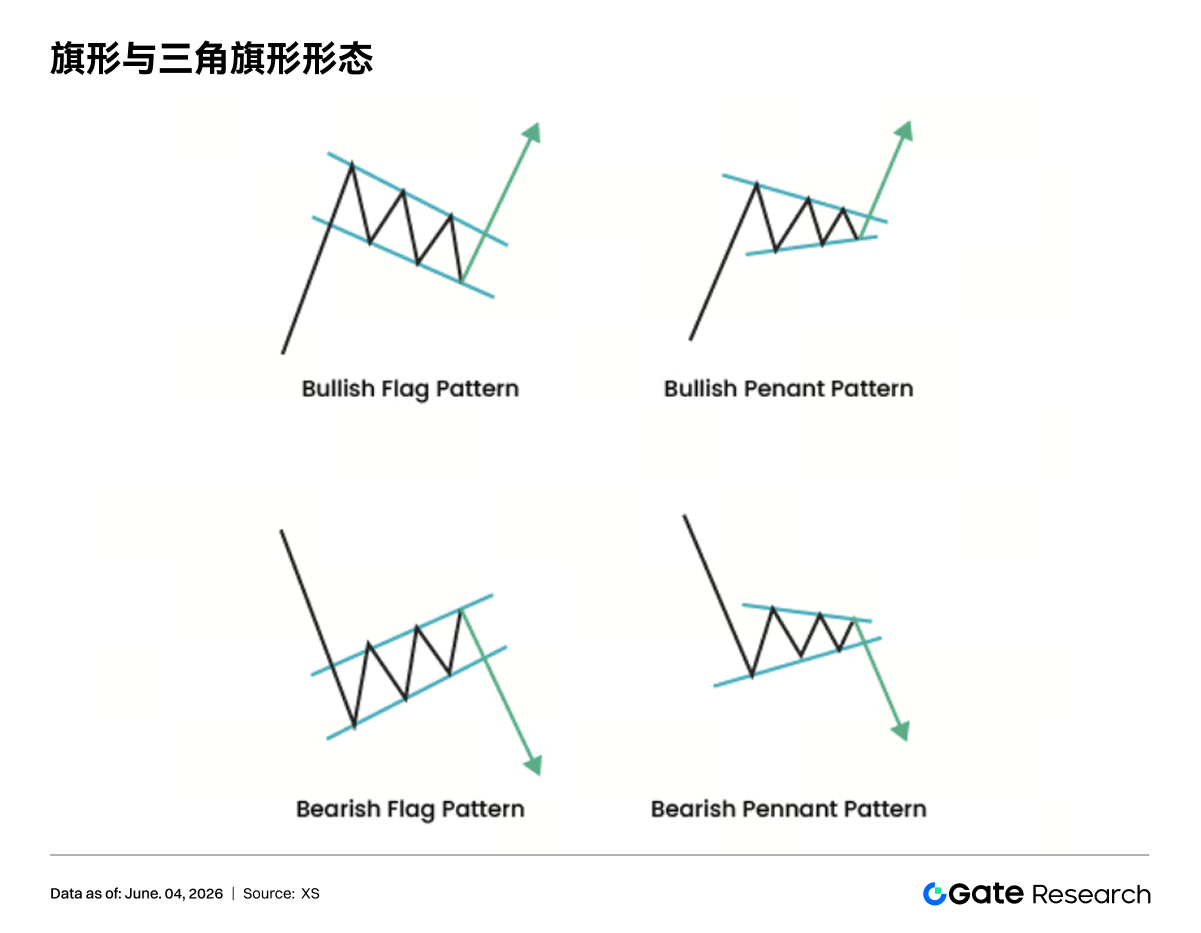
The report also covers flag and pennant formations, both of which are described as short-term continuation patterns that usually develop after a sharp directional move. In a flag, the initial impulse creates the “flagpole,” followed by a brief consolidation channel or small parallelogram that slopes against the original trend. In a pennant, the same sharp initial move is followed by a small converging triangle. Gate Research Institute says the flagpole phase is usually accompanied by strong volume, the consolidation phase often shows declining volume, and the actual continuation signal is stronger when volume returns on the breakout.
One point the study highlights is timing. Rectangles often take much longer to form, sometimes around three months, while flags are more compressed structures, often taking around three weeks. That difference matters because traders should not confuse a long sideways range with a short pause pattern inside a fast trend. After a successful breakout, projected targets are commonly estimated from the length of the flagpole rather than the size of the consolidation body alone.
Triangle structures and directional pressure
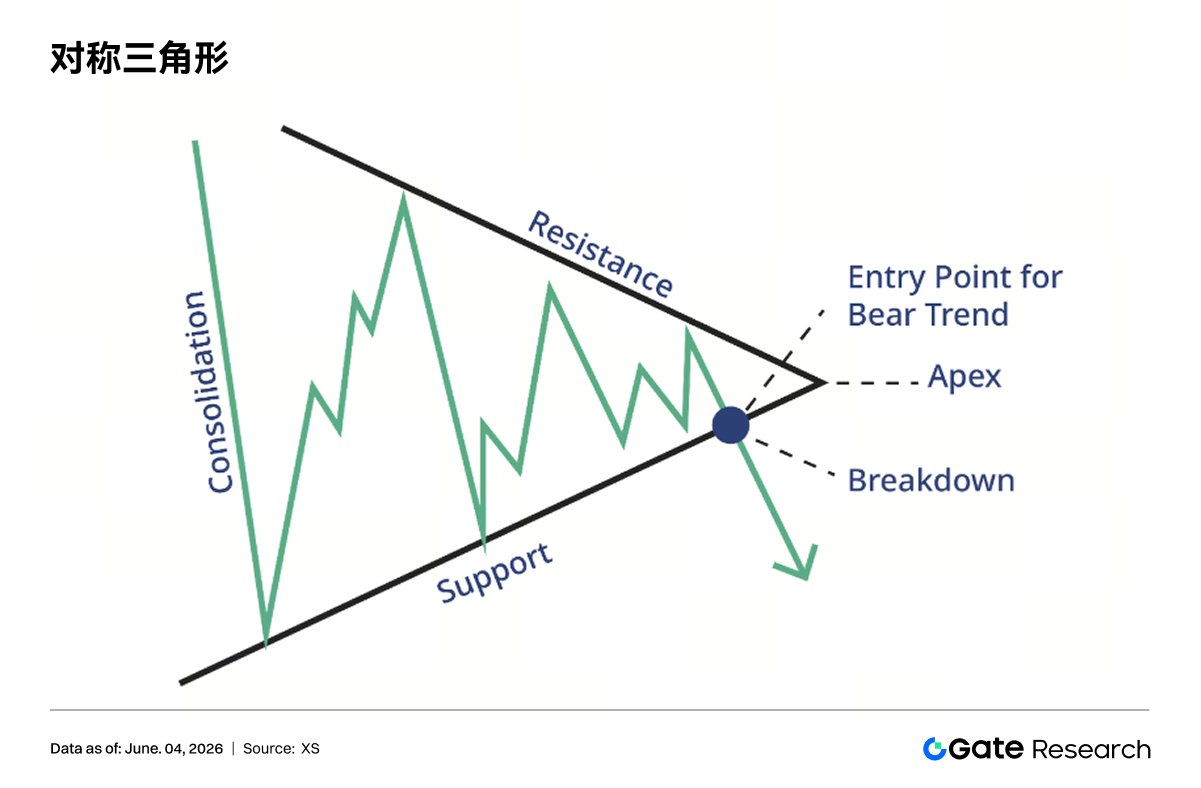
Gate Research Institute describes the symmetrical triangle as a pattern that often carries a bullish bias but can still break in either direction. It is characterized by progressively lower highs and progressively higher lows, which means the price range narrows over time. Unlike a pennant, a symmetrical triangle usually lasts more than three weeks. The report stresses that the essential feature of this formation is not an early prediction of which side has already won, but the recognition that volatility is compressing and the market is moving closer to a directional decision.
The preferred breakout zone in a symmetrical triangle is typically between one-half and three-quarters of the pattern’s full length. Volume often decreases while the triangle develops, and traders should watch closely for price acceleration and volume confirmation at the point of breakout or breakdown. The study mentions two common ways to estimate a target: measuring the widest part of the triangle and projecting it from the breakout point, or using parallel projection lines based on the structure itself.
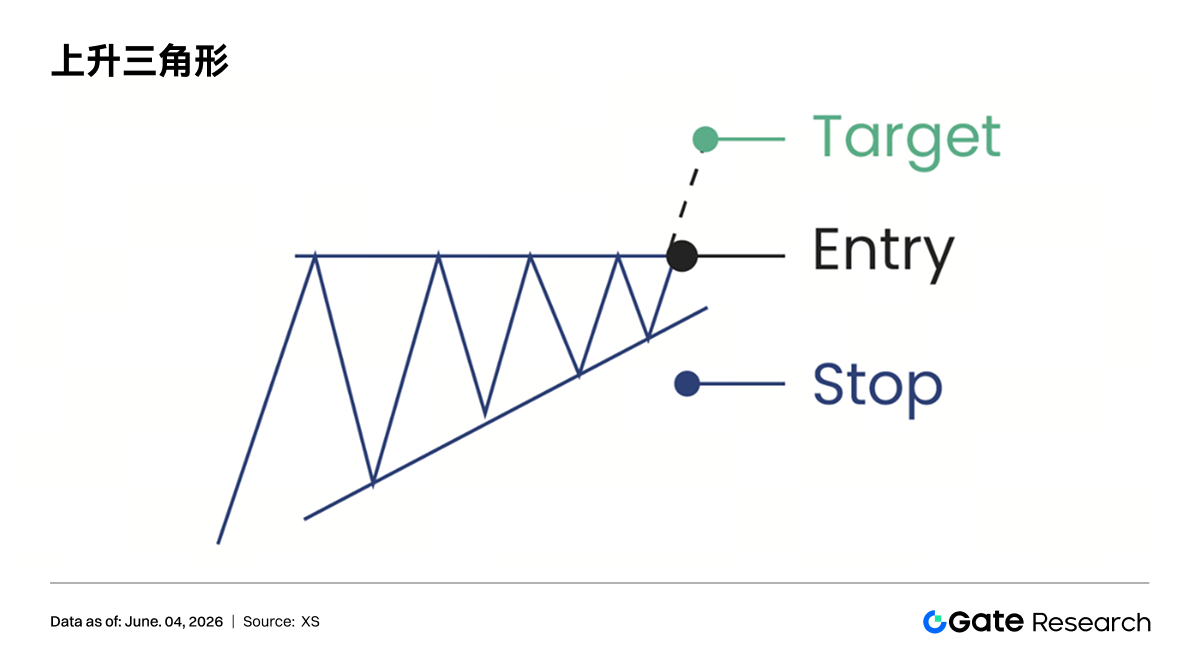
The ascending triangle is presented as a more bullish configuration. It features a relatively flat resistance line on top and rising lows underneath, showing that buyers are stepping in at increasingly higher levels. In practical terms, sellers continue to defend the same resistance zone, but buyers become more aggressive with each pullback. If the market eventually breaks through that resistance on rising volume, the report argues that the overhead supply has likely been absorbed and additional upside may open up. The target is commonly estimated by taking the height of the widest part of the triangle and projecting it above the breakout level.
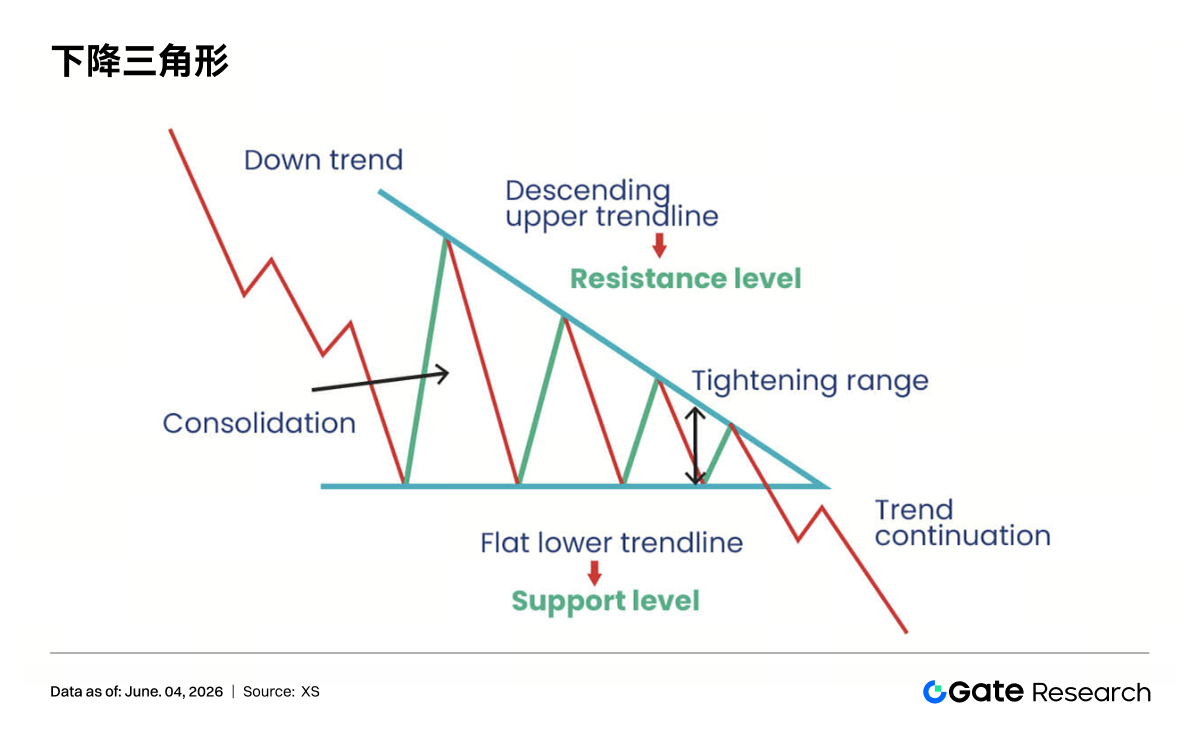
The descending triangle is the mirror image and is generally treated as bearish. It has a relatively flat support level at the bottom and progressively lower highs above it, suggesting sellers are pressing at increasingly lower prices while buyers struggle to produce strong rebounds. The report says repeated tests of support show demand still exists in that area, but the weaker rebound profile indicates fading bullish strength. Once support finally gives way, those prior buyers may turn into stop-loss sellers, adding to downward pressure and accelerating the move lower.
Head-and-shoulders reversals
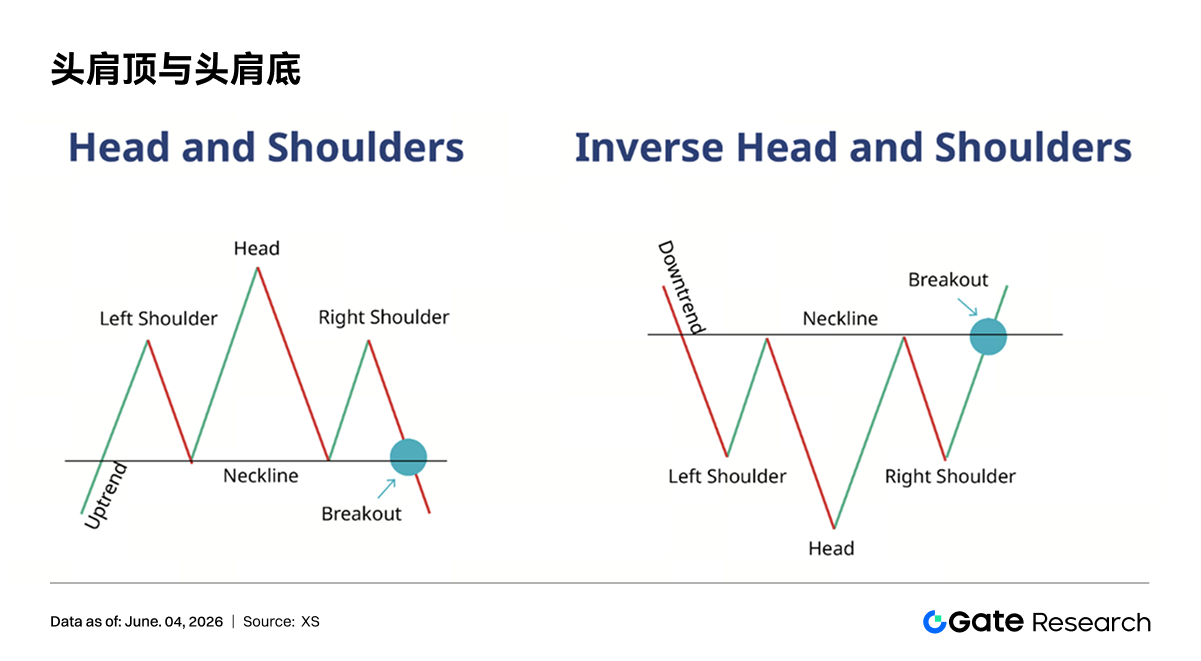
Among reversal patterns, the report places special emphasis on the head-and-shoulders top and bottom. A head-and-shoulders top is described as one of the most important bearish reversal formations and usually appears near the end of an uptrend. It consists of a left shoulder, a higher head, a right shoulder of roughly similar height to the left shoulder, and a neckline drawn through the lows between the shoulders and the head. The formation logic is sequential: price rallies to form the left shoulder, pushes to a higher high for the head, then fails to reclaim that high on the third rally, creating the right shoulder.
Volume behavior is treated as a major part of the confirmation process. The left shoulder often forms on relatively strong volume, the head may print on weaker volume despite making a higher high, and the right shoulder usually shows weaker participation still. A decisive break below the neckline, particularly on increased volume, strengthens the reversal signal. The usual target is measured by taking the vertical distance from the head to the neckline and projecting that distance downward from the break point. The inverse head-and-shoulders bottom follows the same logic in reverse and is more often found near the end of downtrends.
What breakout trading is actually trying to capture
In strategy terms, the report defines a breakout as a move above a clearly established resistance level that continues higher, while a breakdown is a move below a clearly established support level that continues lower. In practice, both are treated under the broader umbrella of breakout trading. Unlike range traders, who focus on buying support and selling resistance within a defined channel, breakout traders are less interested in the oscillation inside the range and more interested in the expansion that may follow once price escapes the structure.
Gate Research Institute attributes the effectiveness of breakout trading to both market psychology and order clustering. Many traders place entry orders above resistance or sell orders below support. Once those levels are breached, stop orders, breakout entries, and fear-of-missing-out behavior can all trigger in a short period of time, generating fast movement. That is why long consolidations around obvious price boundaries can become the launch point for larger directional moves.
The report makes clear, however, that range trading and breakout trading are not contradictory approaches. They apply to different market states. Range trading is better suited to environments where price is contained and repeatedly respects support and resistance. Breakout trading becomes more relevant when the market has spent enough time consolidating and is close to making a directional choice.
Conditions for a valid breakout
To qualify as a valid breakout, the report says several conditions should be present. Price should break a clear resistance or support level. A recognizable consolidation range or pattern should already exist before the move. Volume should expand during the breakout. Price should not quickly fall back into the original range. And if a retest occurs, former resistance should behave as support after an upside breakout, while former support should act as resistance after a downside break.
One of the study’s main points is that traders should not rely on intraday breaches alone. Closing behavior matters much more. If price trades above resistance during the session but closes back below it, overhead selling pressure may still be strong. If price closes firmly above that level and volume expands at the same time, the quality of the signal improves. For daily chart traders, the daily close is generally more informative than a temporary intraday spike. For short-term traders, the same principle applies to the timeframe they actually trade.
The report also stresses the importance of consolidation quality before the breakout. A higher-quality setup usually has three features: clearly defined boundaries, enough time for market participation and position exchange, and gradually narrowing volatility. If price suddenly surges without a recognizable range or key resistance area in place, the move may be closer to a short-term impulse than a structural breakout.
Gate Research Institute further grades breakout signals into strong, medium, and weak categories. A strong breakout often appears as a long bullish or bearish candle on high volume, closes well beyond the breakout level, and does not return to the prior range. A medium-quality breakout closes only slightly beyond the key level and may still need retest confirmation. A weak breakout often shows an intraday push through the boundary but an unstable close, insufficient volume, or immediate loss of momentum. The report argues that these different signal grades should be matched with different position sizes instead of applying one fixed allocation rule to every setup.
Entries, stops, and position sizing
On execution, the report outlines a straightforward framework. In upside breakouts, traders may consider entering above the high of the first breakout candle. In downside breakdowns, traders may consider entering below the low of the first breakdown candle. In range conditions, the classic approach of buying near support and selling near resistance remains relevant. For breakout trades, stop-loss placement may sit around 1% to 2% below the breakout level or beyond the key support or resistance defining the pattern.
The report separates entries into three methods. The first is immediate breakout entry, which is more suitable when volume expands sharply, the close is strong, and the broader trend is clear. Its advantage is full participation in the strongest moves, but the cost of false breakouts is higher. The second is retest entry, where traders wait for price to break out and then return to test the former resistance or support. This gives a clearer risk-reward setup but may miss fast-moving trends that never come back. The third is scaled entry, in which a partial position is opened at the breakout and more size is added only if the retest confirms the move.
On stop-loss rules, the report emphasizes the principle that if the pattern fails, the trade should be considered invalid. For a rectangle breakout, if price falls back into the rectangle and cannot re-establish itself in the breakout direction, the setup weakens materially. For triangle breakouts, a return inside the triangle often invalidates the signal. For head-and-shoulders structures, a move back across the neckline after the break calls for a reassessment of the reversal view. Stop placement should therefore depend on volatility, liquidity, timeframe, and actual position size rather than a single mechanical percentage.
Position sizing should also reflect signal quality. Strong breakouts can justify a larger base allocation. Medium breakouts may warrant probing positions only. Weak breakouts should usually be left alone until confirmation arrives. The report adds that traders can be more constructive if multiple timeframes align in the same direction, such as a weekly uptrend combined with a daily rectangle breakout and rising volume. If a short-term breakout is running directly into a major higher-timeframe resistance zone, caution and smaller size are advised.
Profit-taking and the three outcomes after a breakout
Gate Research Institute argues that buying is often easier than selling, and that position management is where discipline is truly tested. The goal in breakout trading is to let valid trends run far enough to justify the setup, while keeping losses from false breaks small enough that they do not wipe out multiple successful trades. The report suggests several management tools: taking partial profits at an initial target, letting the remaining position follow the trend, protecting open gains with a trailing stop, and cutting exposure quickly if price collapses back into the prior range.
It divides exits into target-based exits, structural exits, and trend exits. Target-based exits work best when the pattern offers a measurable height, as in rectangles, triangles, and head-and-shoulders structures. Structural exits become relevant near prior highs, prior lows, long-term moving averages, or heavy traded zones. Trend exits are better suited for strong directional moves after a valid breakout and may rely on moving averages, trendlines, prior swing lows, or volatility-based trailing methods. The report warns that the two biggest performance drags in breakout trading are taking profits too early and refusing to stop out when a breakout clearly fails.
The study groups post-breakout behavior into three broad paths. The first is the clean valid breakout, where price accelerates quickly and barely looks back. This is the ideal situation for trend traders, but the report says it is not the most common one. The second is the retest breakout, where price first breaks resistance, then pulls back to test the breakout zone, and only then resumes higher. Many traders prefer this pattern because it offers tighter stops and cleaner risk-reward, but its drawback is obvious: some strong trends never provide that second chance.
The third path is the false breakout, which the report treats as one of the most important risks in live trading. A false breakout occurs when price briefly moves above resistance or below support, then quickly reverses back into the range and may even continue in the opposite direction. According to the report, false breakouts often appear in three conditions: when the broader market lacks trend, when breakout volume fails to expand meaningfully, or when a short-term breakout runs directly into a higher-timeframe barrier. Traders can look for several warning signs, including failure to keep closing outside the key level, rapidly shrinking volume after the initial move, and a quick reversal through the breakout candle’s key high or low.
Volume, support-resistance flips, and confirming indicators
Among the validation tools discussed, volume stands first. Consolidation phases often show declining turnover, while true breakouts should be accompanied by a visible pickup in trading activity. This is especially important in upside breakouts and inverse head-and-shoulders neckline breaks, where the absence of volume confirmation can materially reduce reliability. The second major check is the support-resistance flip: former resistance should begin acting as support after an upside break, while former support should become resistance after a downside break. Whether the retest holds is one of the clearest ways to judge whether the move has real structural backing.
The report also lists several momentum and volatility indicators that can be used as secondary confirmation tools: Average True Range, moving averages, Bollinger Bands, and the Relative Strength Index. Rising ATR can reflect expanding market activity around a breakout. Major moving average breaks can support the view that trend conditions are changing. Bollinger Band compression, or a “squeeze,” often precedes larger directional expansion. RSI can help identify whether the market is moving into overbought or oversold territory before or after the breakout takes place.
Final takeaway from the report
Gate Research Institute concludes that chart patterns and breakout trading can provide a structured framework for market analysis, but their usefulness depends on confluence rather than on any single shape. Trend context, volume confirmation, support-resistance transitions, pattern duration, and disciplined risk management all influence the quality of a trading signal. For institutional and professional traders, the report suggests that pattern analysis works best as one module inside a broader trading system rather than as a standalone decision engine.
The more robust process proposed by the study is to use pattern recognition to build a watchlist, use breakout confirmation to trigger a trading plan, use position sizing and stop losses to control downside risk, and use partial profit-taking together with trailing stops to manage trend exposure. The report also includes a risk reminder that crypto investing carries high risk and that market participants should conduct independent research before making any investment decisions.