

Gate Research Institute said May’s crypto market moved from an early-month rebound into a mid-month decline and a late-month phase of low-volatility consolidation. BTC, ETH and SOL all formed interim highs in the first half of the month before entering pullbacks. At the same time, spot ETF absorption weakened and perpetual futures activity remained dominant, leaving the market with a structure in which spot demand was insufficient and leveraged trading played a larger role in price discovery.
Early strength faded into a low-volatility month-end range
Measured by 4-hour closing prices, BTC fell from $77,117.4 at the start of the month to $73,684.0 at month-end, a monthly return of -4.45%. ETH dropped from $2,283.02 to $2,007.0, a monthly return of -12.09%. SOL moved from $83.90 to $82.44, a monthly return of -1.74%. SOL’s closing decline looked modest, but its path was much more volatile: it reached an intramonth high of $98.40 before pulling back to the area near $80.00.
The first phase ran from May 1 to May 6. BTC advanced from $77,117.4 to $82,828.2, ETH rose from $2,283.02 to $2,423.99, and SOL extended its rally until May 11, when it touched $98.40. During this stage, short-period moving-average clusters moved higher and volatility stayed within a controllable range. SOL led in elasticity, showing that funds were willing to take on greater risk exposure at the beginning of the month.
The second phase began on May 7. BTC failed to hold above $82,000, ETH could not remain above $2,400, and SOL formed its monthly high near $98. Breakout signals began to fail more frequently. Prices repeatedly fell back toward EMA12 and triggered exits. BTC long trades after May 14 hit stop losses, ETH long trades after May 6 continued to fail, and SOL entered a clearer downward leg after May 15. The third phase was concentrated from May 22 to month-end, when BTC moved down to the area near $73,000, ETH approached $2,000, and SOL returned to the area near $82. Price ranges narrowed and moving-average cluster width declined, putting the market into another compression phase.
ETF outflows and derivatives turnover defined the market structure
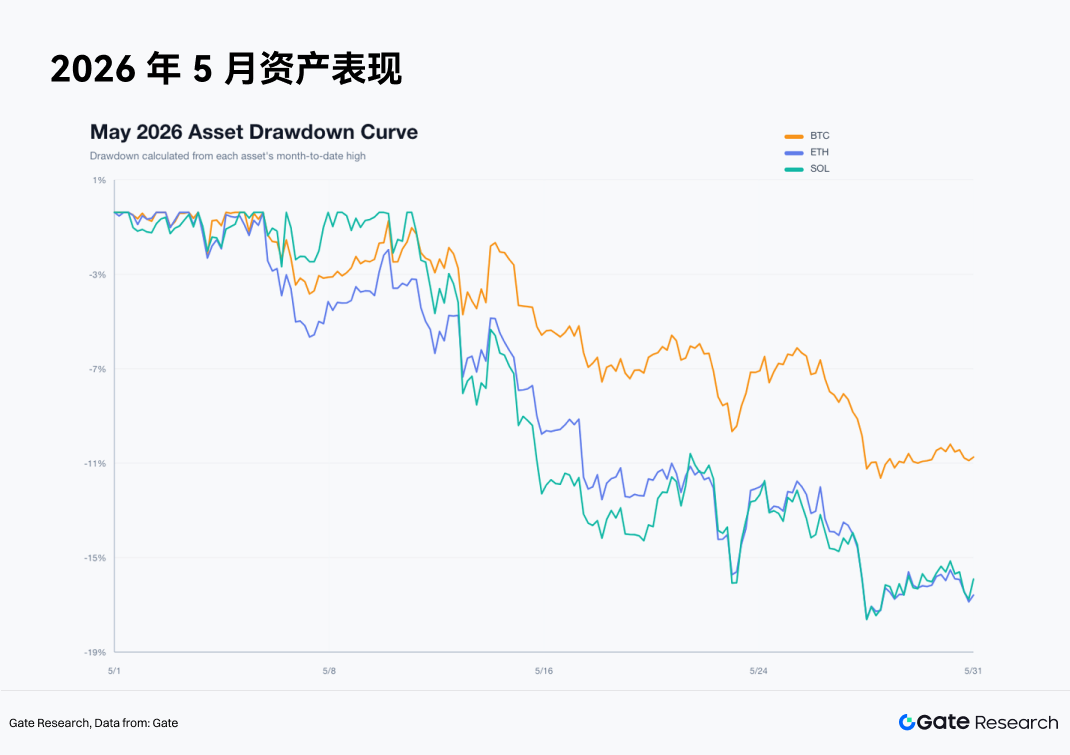
The drawdowns during the month confirmed the roles of the three assets. BTC’s maximum decline from intramonth high to low was about 12.5%, compared with about 18.8% for ETH and about 18.7% for SOL. In Gate Research Institute’s framework, BTC acted as the risk anchor, while ETH and SOL acted as amplifiers of risk appetite. Once BTC weakened, ETH and SOL declined faster, which made it necessary at the strategy level to reduce long exposure to high-beta assets.
As of May 31, total stablecoin market capitalization was about $320 billion and DeFi TVL was about $251 billion. Underlying dollar liquidity did not show a systemic retreat. However, CEX 24-hour spot volume was about $124.2 billion, while CEX perpetual volume was about $894.4 billion. Perpetual turnover was roughly 7.2 times spot turnover, meaning more of the price discovery function was carried by derivatives markets. For BTC, ETH and SOL, active buy-sell ratios were all below 1, with active selling slightly stronger. Funding rates were around 0.01%, not at an extreme crowded level.
ETF flows became an important source of pressure in the second half of May. Public reports cited in the research showed that spot BTC ETFs recorded nine consecutive trading days of net outflows, totaling about $2.8 billion. During that sequence, there was one day with about $649 million in net outflows, including about $448 million from BlackRock IBIT. ETH ETFs were also under pressure, with net outflows of about $241 million in the final week of May.
The cross-asset backdrop reinforced the same conclusion. BTC’s correlation with the S&P 500 remained elevated. Public samples showed that the 30-day correlation in 2026 had reached about 0.74, and it was still around 0.6 near the end of May. Crypto assets did not detach from the U.S. equity risk-budget framework. On the equity side, support came from AI and large technology stocks. Nvidia reported strong quarterly results in May, with Q1 FY2027 revenue of about $81.6 billion. Its share price reached a record high at one point and the company again touched a market capitalization milestone of about $5 trillion. AI heavyweights supported Nasdaq risk appetite through earnings confirmation, while crypto assets lacked an earnings anchor of the same strength and were more affected by ETF flows, derivatives leverage and liquidity expectations.
The two-way moving-average cluster strategy outperformed long-only trading
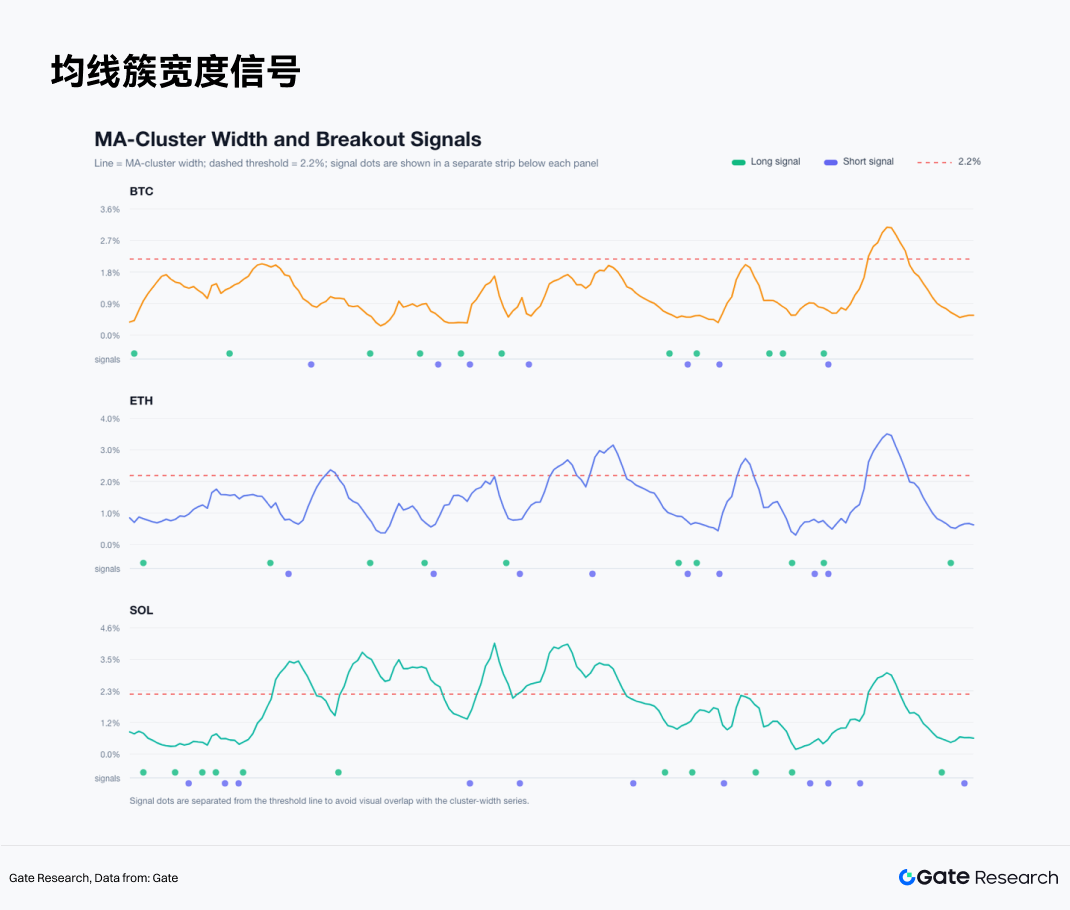
Gate Research Institute tested a system based on six moving averages: EMA6, EMA12, EMA24, SMA6, SMA12 and SMA24. The moving-average cluster width equals the highest of the six averages minus the lowest, divided by the current closing price. If the previous candle’s cluster width was below 2.2% and the current candle closed above the upper edge of the cluster, the strategy opened a long position at the next 4-hour open. If the previous candle’s cluster width was below 2.2% and the current candle closed below the lower edge of the cluster, the strategy opened a short position at the next 4-hour open.
The exit rules were fixed. Long positions exited when price fell below EMA12, and short positions exited when price rose above EMA12. The stop loss per trade was 2.5%, while take profit was 3R, or 7.5%. If take profit and stop loss were triggered on the same candle, stop loss took priority. Round-trip trading costs of 8 basis points were deducted for each trade. Any position still open at month-end was closed at the final 4-hour closing price. The report tested both a long-only version, which traded only upside breakouts, and a two-way version, which traded both upside and downside breakouts.
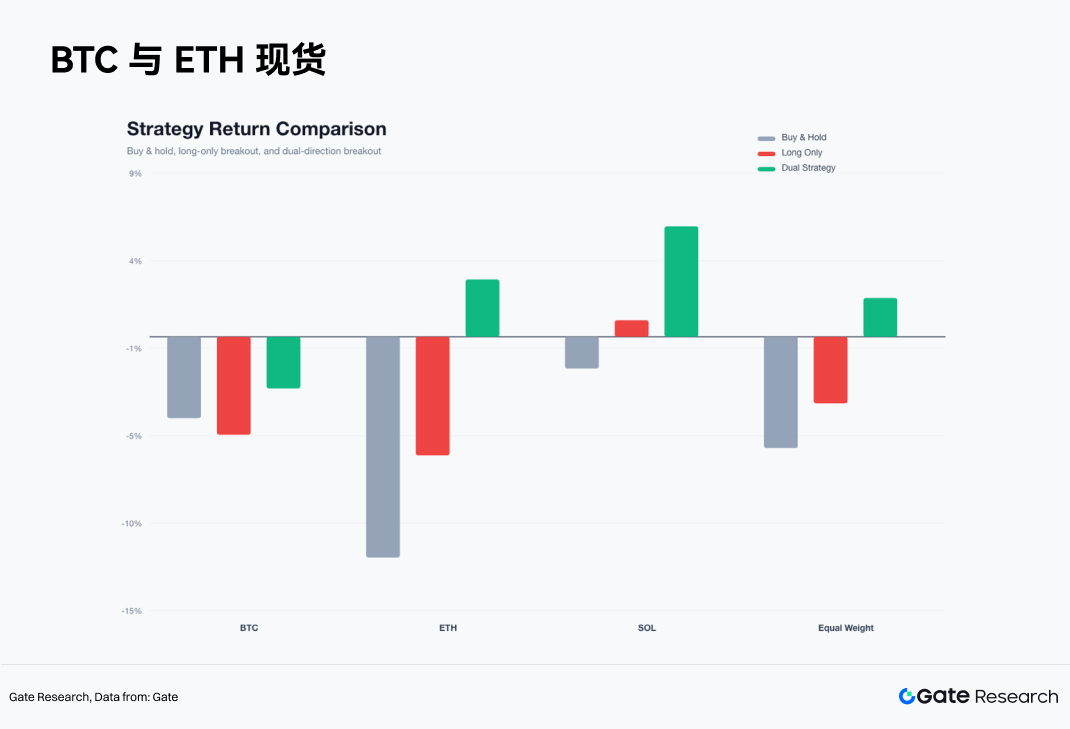
The overall results were clear. Equal-weight buy-and-hold across BTC, ETH and SOL returned about -6.09%. The long-only moving-average cluster breakout strategy returned about -3.65%. The two-way moving-average cluster breakout strategy returned +2.11%, producing about +8.2% of excess return over buy-and-hold. The gains came mainly from short trend legs after mid-May, especially in ETH and SOL, while SOL also contributed through an early-month long trend leg.
The long-only strategy broadly failed to adapt to the market. BTC produced 11 trades, a return of -5.36%, an 18.2% win rate and a maximum drawdown of -10.08%. ETH produced 10 trades, a return of -6.49%, a 10.0% win rate and a maximum drawdown of -10.64%. SOL produced 11 trades, a return of +0.91%, an 18.2% win rate and a maximum drawdown of -7.11%. BTC’s long-only gains were concentrated in two early trades: a May 1 entry exited on May 4 for a net gain of +2.09%, and a May 4 entry exited on May 7 for a net gain of +0.92%. A long entered on May 14 hit its stop loss and lost -2.58% net. ETH was weaker: a May 1 to May 5 long returned +3.17%, but the following nine long trades all lost money. SOL’s positive long-only result came from two trades, a May 5 to May 8 long that returned +3.95% and a May 8 entry that hit 3R take profit on May 10 for +7.42% net.
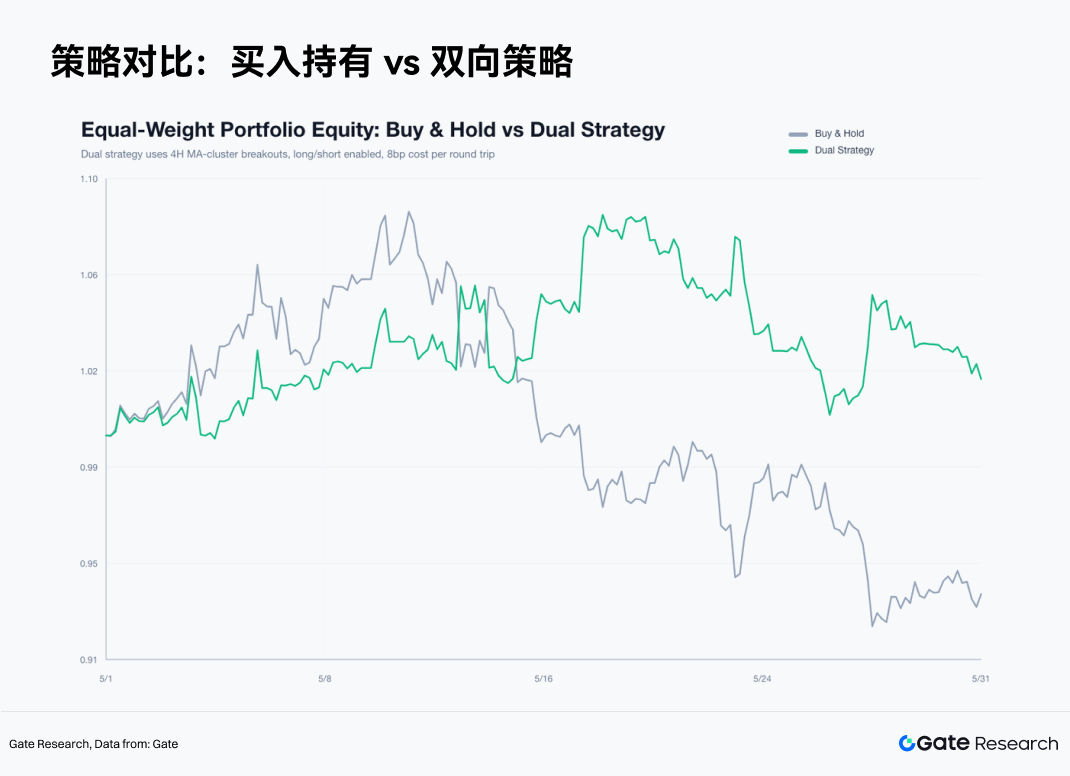
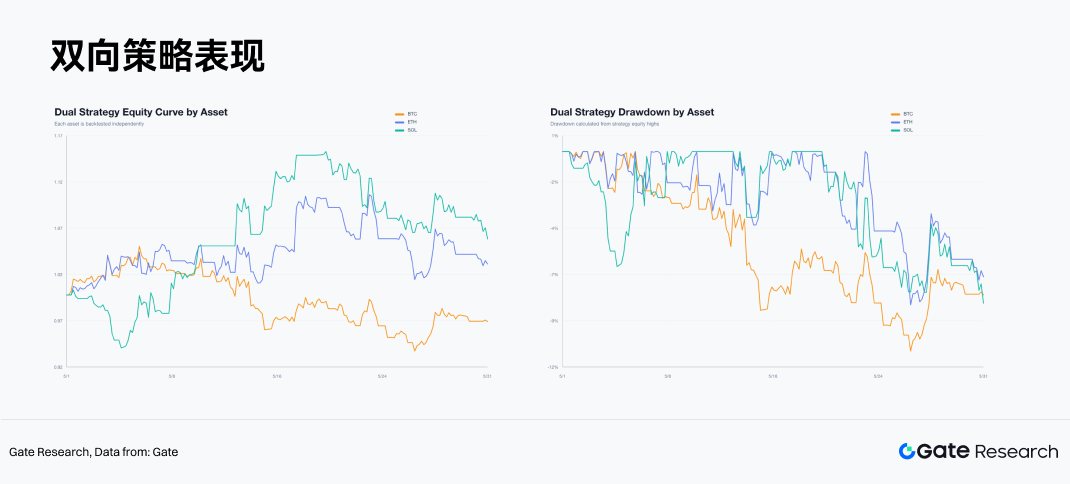
The two-way version improved the results materially. BTC’s two-way strategy still lost money, but its loss narrowed to -2.83%. It traded 18 times, with a 22.2% win rate and a maximum drawdown of -10.74%. Two short trades contributed the most: a May 15 short exited on May 20 for +2.35% net, and a May 26 short exited on May 30 for +3.42% net. ETH’s two-way strategy returned +3.14% over 18 trades, with a 38.9% win rate and a maximum drawdown of -8.26%. Its key trade was a May 15 short that hit 3R take profit on May 17 for +8.03% net, followed by a May 26 short that exited on May 29 for +2.68% net. SOL’s two-way strategy returned +6.05% over 22 trades, with a 22.7% win rate and a maximum drawdown of -8.17%. SOL provided both long and short trend trades: the May 8 long hit 3R take profit at 16:00 on May 10 for +7.42% net, and the May 15 short hit 3R take profit on May 17 for +8.03% net.
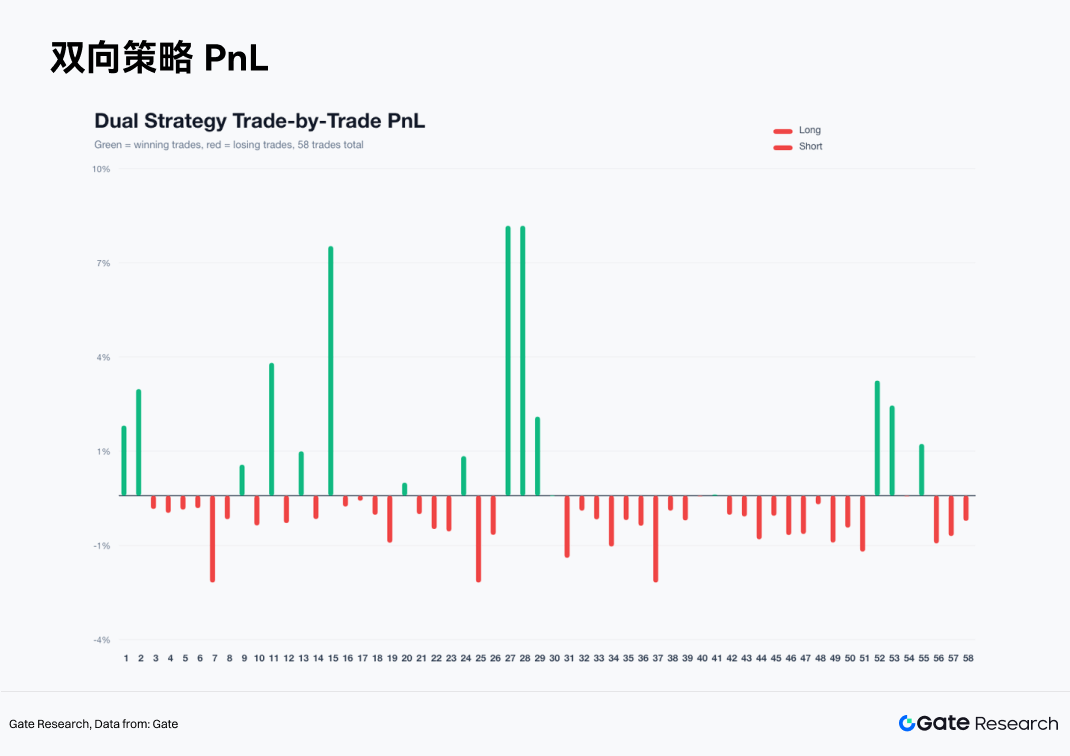
Across all 58 trades in the two-way strategy, the number of profitable trades was limited. BTC’s win rate was 22.2%, ETH’s was 38.9%, and SOL’s was 22.7%. The strategy’s return came from a small number of larger trend trades, while losses were contained by EMA12 exits and fixed stop losses. Cumulative trade performance showed that the strategy’s equity curve moved higher in a volatile way early in the month, rose in mid-May on ETH and SOL shorts, and received additional support in late May from BTC and SOL shorts. Losses were concentrated in periods when the market switched repeatedly between long and short signals.
Low-volatility compression shaped the June framework
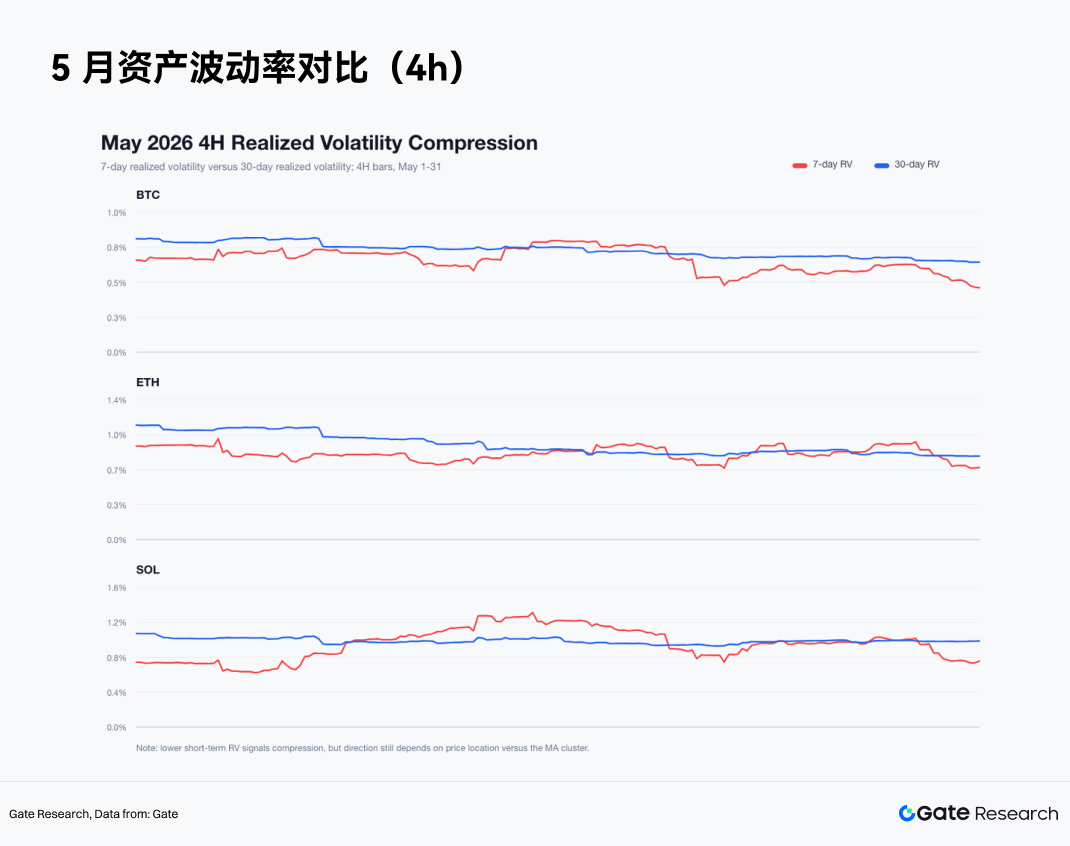
By the end of May, BTC’s 7-day 4-hour realized volatility was about 0.46%, compared with 30-day 4-hour realized volatility of about 0.64%. ETH’s figures were about 0.7% and 0.81%, while SOL’s were about 0.76% and 1%. For all three assets, short-cycle volatility was below medium-cycle volatility, indicating low-volatility compression. BTC closed the month at $73,684.0, with EMA12 near $73,776.35. ETH closed at $2,007.0, with EMA12 near $2,016.34. SOL closed at $82.44, with EMA12 near $82.39. BTC and ETH remained in weak zones, while SOL had just returned to the area near EMA12.
Moving-average cluster width showed the same state. At month-end, BTC’s cluster width was about 0.57%, ETH’s was about 0.63%, and SOL’s was about 0.58%, all below the 2.2% strategy threshold. In this environment, breakout signals can be triggered frequently. The report stressed that after moving-average cluster compression, the system must allow two-way trades. Trading only upside breakouts would systematically miss downside trends.
The report also tested an enhanced filter version. Its conditions included 7-day volatility no higher than 1.15 times 30-day volatility, volume no lower than 0.9 times the average of the past 20 candles, with each candle representing 4 hours, longs close to 20-candle highs and shorts close to 20-candle lows. This version performed worse. BTC’s enhanced two-way strategy returned -3.40%, ETH’s returned -5.03%, SOL’s returned -2.58%, and the three-asset equal-weight result was -3.63%. The failure came from the fact that high-volume breakouts in May often appeared near local tops. BTC’s enhanced long signal on May 4 entered at $80,322.9 and hit its stop loss within four hours for -2.58% net. ETH’s enhanced long signal on May 6 entered at $2,410.39 and hit its stop loss on the same candle for -2.58% net. SOL’s enhanced long signal on May 4 also hit its stop loss.
Gate Research Institute described BTC as the state anchor. Its monthly decline was smaller than ETH’s and its drawdown was more controlled, but the BTC two-way strategy still returned -2.83%, so BTC itself was not the best return asset in May. It was more useful for judging the market’s risk budget. ETH was the weak main line. It fell -12.09% for the month, its long breakout win rate was extremely low, and its two-way strategy depended on short profits. After failing near $2,400, ETH broke below $2,300, $2,200 and $2,100 in sequence. The report said ETH would first need to repair the $2,100 to $2,200 zone before long exposure could be reassessed. SOL was described as a trading asset. Its monthly closing decline was only -1.74%, but its intramonth path was intense. Its two-way strategy returned +6.05%, higher than BTC and ETH, making it more suitable for trend following than passive holding in the tested framework.
For June, the report said the two-way 4-hour moving-average cluster breakout system would continue to be used. One-sided long chasing should be reduced in weight. BTC should act as the state filter, while ETH and SOL should be used as return assets after relative strength is confirmed. If BTC moves back above EMA12 and the 30-candle moving-average region, ETF outflows slow, and active buy-sell ratios return above 1, the weight of long signals can be raised. If BTC remains below the $74,000 to $76,000 area, the market stays in a weak repair state. The U.S. equity filter should also remain: strength in Nasdaq and AI leaders together with slower BTC ETF outflows would show an improvement in the cross-asset risk budget; strength in Nasdaq while BTC ETF outflows continue would show that funds are still favoring U.S. technology leaders with stronger earnings certainty; if U.S. equities and crypto weaken together, ETH and SOL short signals receive higher priority.
The position rules remain mechanical: 2.5% risk per trade, 3R take profit, and EMA12 exits unchanged. Breakout signals alone do not justify heavy positions. When spot absorption is weak, ETF outflows continue, perpetual volume remains high and active buying is insufficient, upside breakout signals receive lower weight while downside breakout signals receive higher weight. Gate Research Institute said May represented a shift from repair to failure: stablecoin and DeFi base liquidity remained, but mainstream ETF absorption weakened, derivatives activity took a larger share, and price discovery leaned toward leveraged markets. The institute cited Gate, Investor, DeFiLlama, CMC, BlackRock, Coinglass and K33 as information sources, and reminded users that cryptocurrency investment involves high risk, that users should conduct independent research and understand the assets and products they purchase, and that Gate is not liable for losses or damages caused by such investment decisions.