

Gemini Space Station posted $45.475 million in revenue for the second quarter of 2026, up 37% from a year earlier. Trading activity, however, moved in the opposite direction: spot trading volume dropped 66% year over year.
The company’s latest earnings release and presentation point to a different engine behind the revenue line.
Credit card revenue became the largest single line item
In Gemini’s second-quarter presentation, credit card revenue came in at $16.178 million, above exchange platform revenue of $12.497 million. That marked the first time the credit card business generated more revenue than the trading platform.
A year earlier, the picture was reversed. Exchange platform revenue was $20.233 million, while credit card revenue was $4.882 million. Gemini is still running a spot matching business, but revenue is no longer tied as closely to order flow as it once was.
The pace of the shift was sharp. Credit card revenue increased 231% from a year earlier, while exchange platform revenue declined 38%, based on the company’s presentation materials. The gain in one segment filled the gap left by the other and pushed the card business into the top spot.
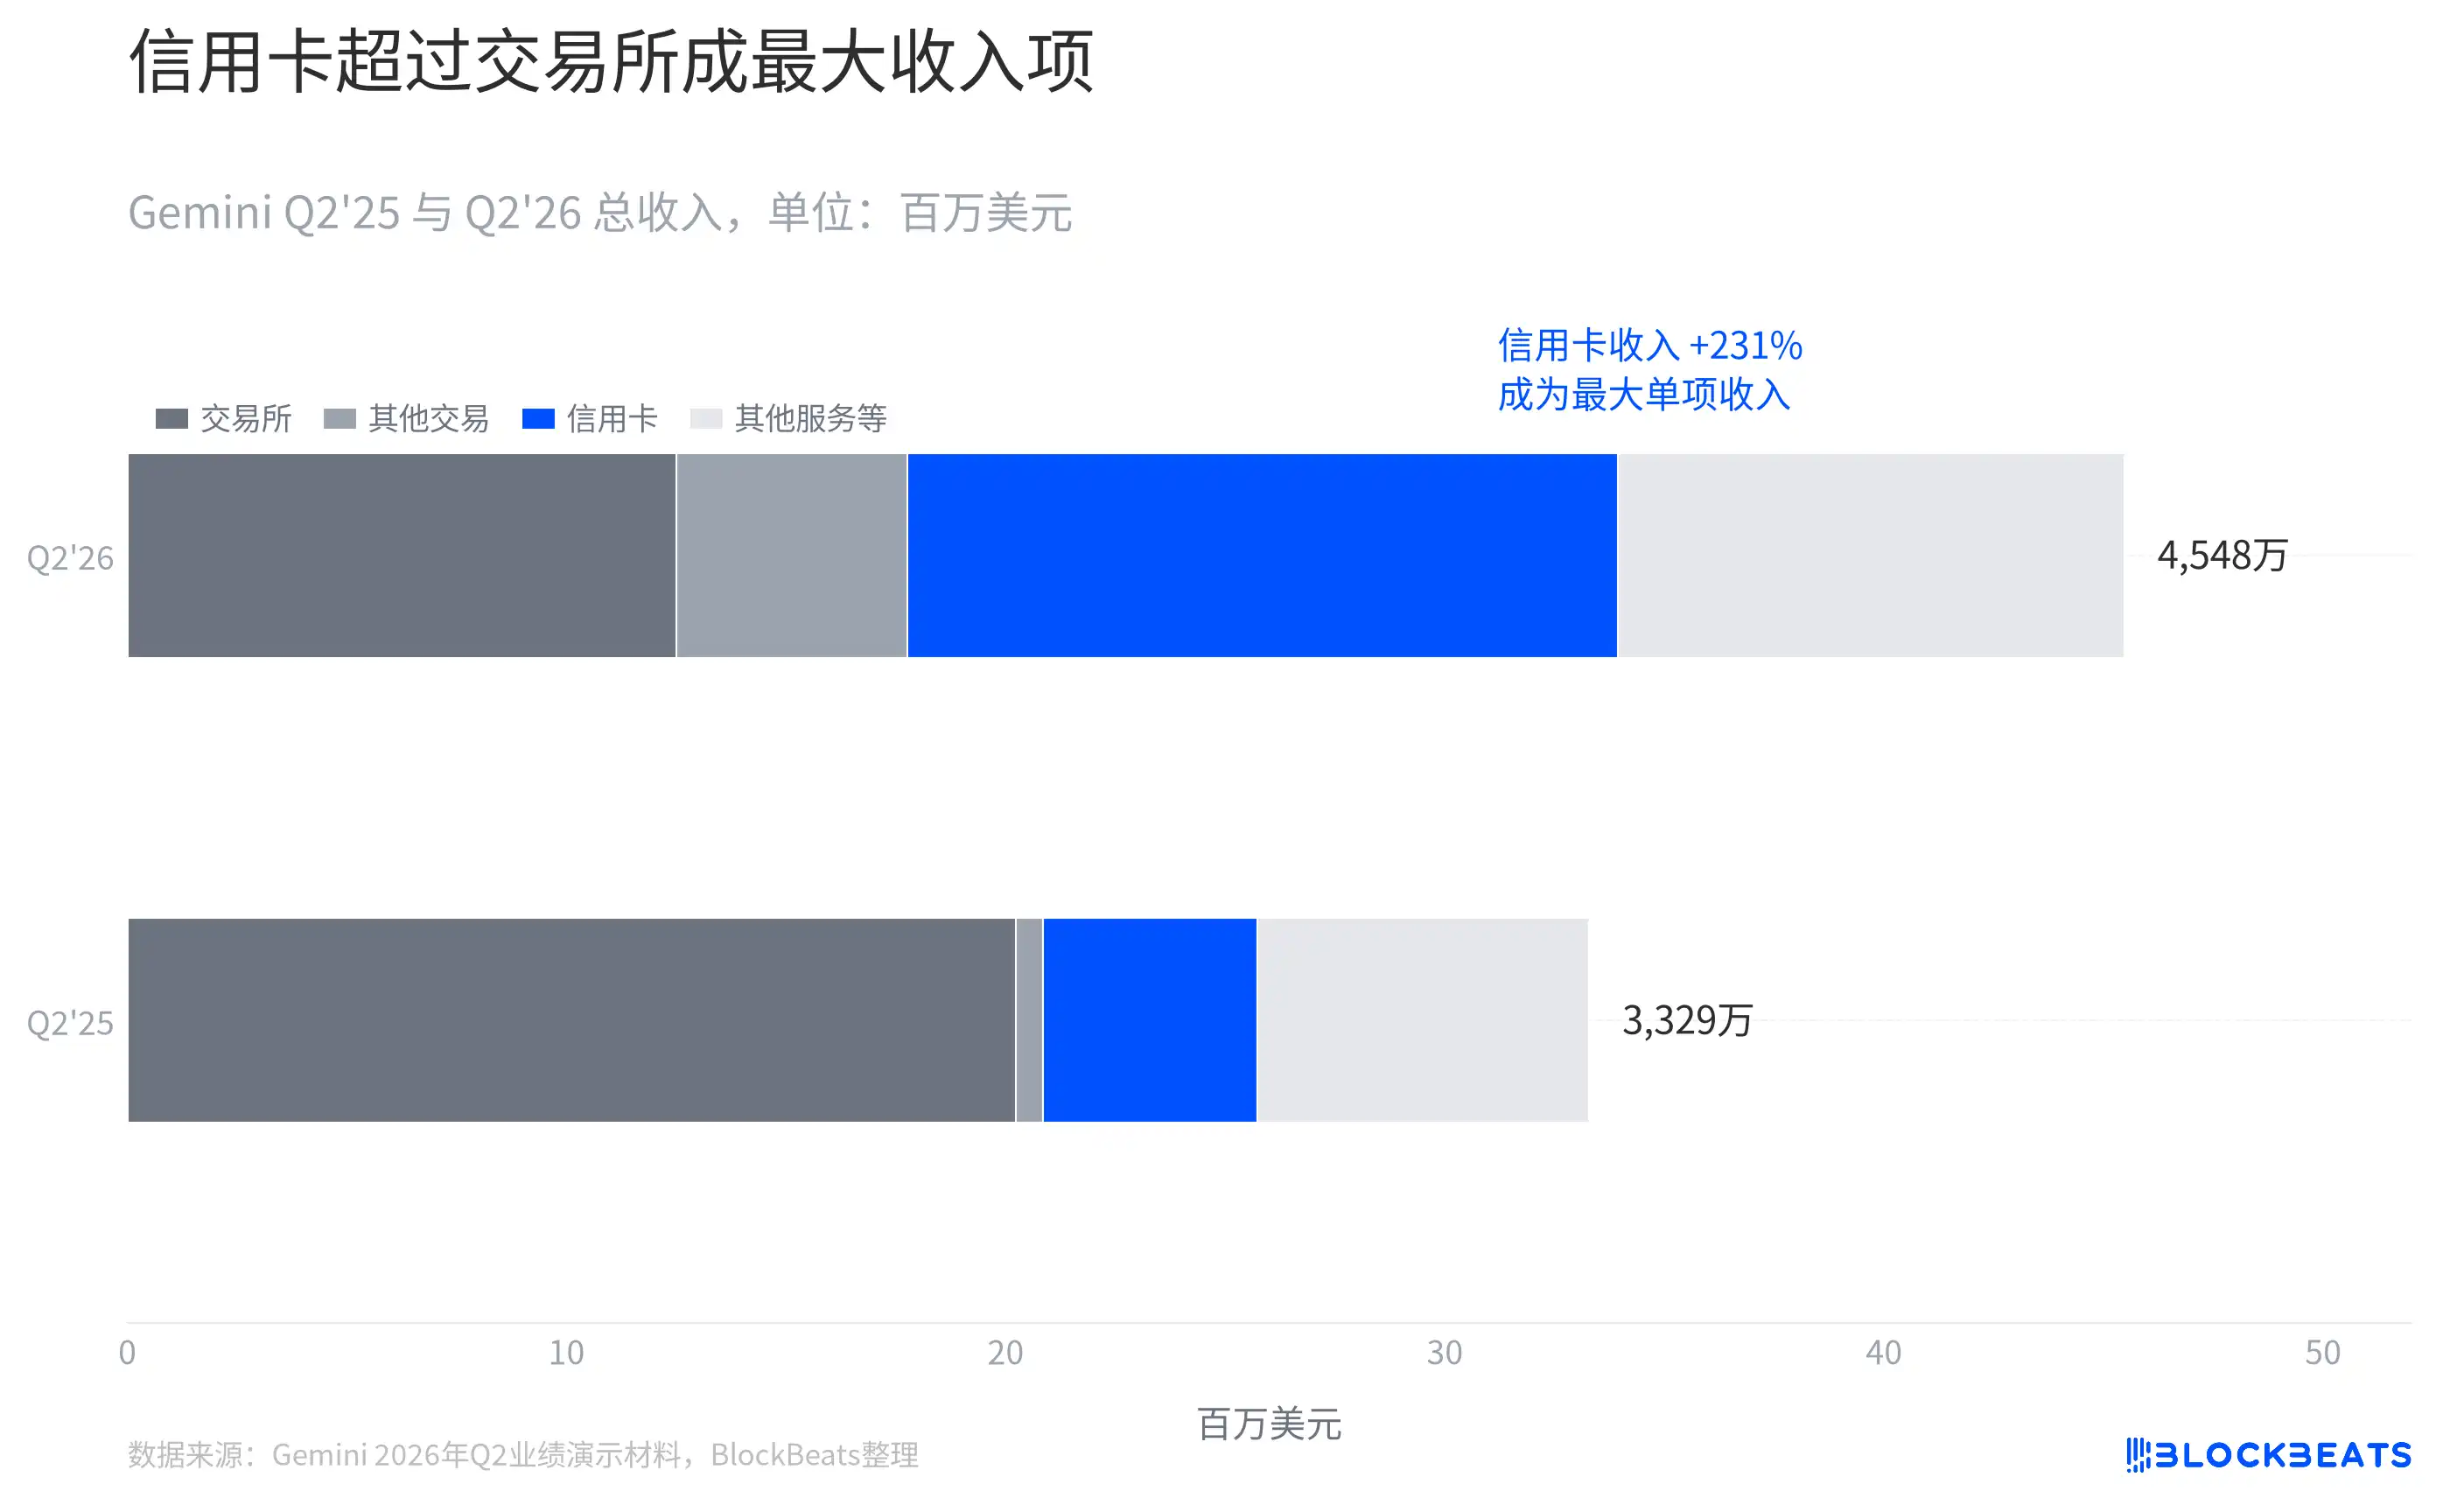
The same materials said service revenue and interest income accounted for 59.4% of net revenue. That figure uses a net revenue basis, so it cannot be read directly as the share of the stacked total revenue bars shown elsewhere in the deck. It does indicate that Gemini’s revenue mix is broadening, but it does not on its own show that profitability has improved.
Gemini also disclosed that credit card revenue includes both interchange fees and interest income, which makes it a different business from pure trading fees. Because the company carries its own receivables, it also has to manage account quality and collections speed.
Revenue and trading volume are no longer following the same line
Gemini reported total trading volume of $3.8 billion in the second quarter, down from $11.3 billion a year earlier. On the exchange’s most familiar operating metric, the company is still in a clear contraction phase.
When revenue, trading volume and platform assets are viewed against the same base period, the divergence becomes clear. Revenue has pulled back from a prior high but remains above the starting point, while both trading volume and platform assets have trended lower. In practice, trading volume is no longer the only key to explaining Gemini’s revenue. Product mix is taking over more of that role.
The same pattern appears in user metrics. Monthly transacting users rose to 580,000 from 523,000, according to the company’s presentation. But Gemini’s MTU definition includes users who generated any revenue in the past 30 days, or whose accounts produced revenue, and that includes non-spot activity such as the credit card business. The figure therefore cannot be treated as a direct measure of active spot traders.
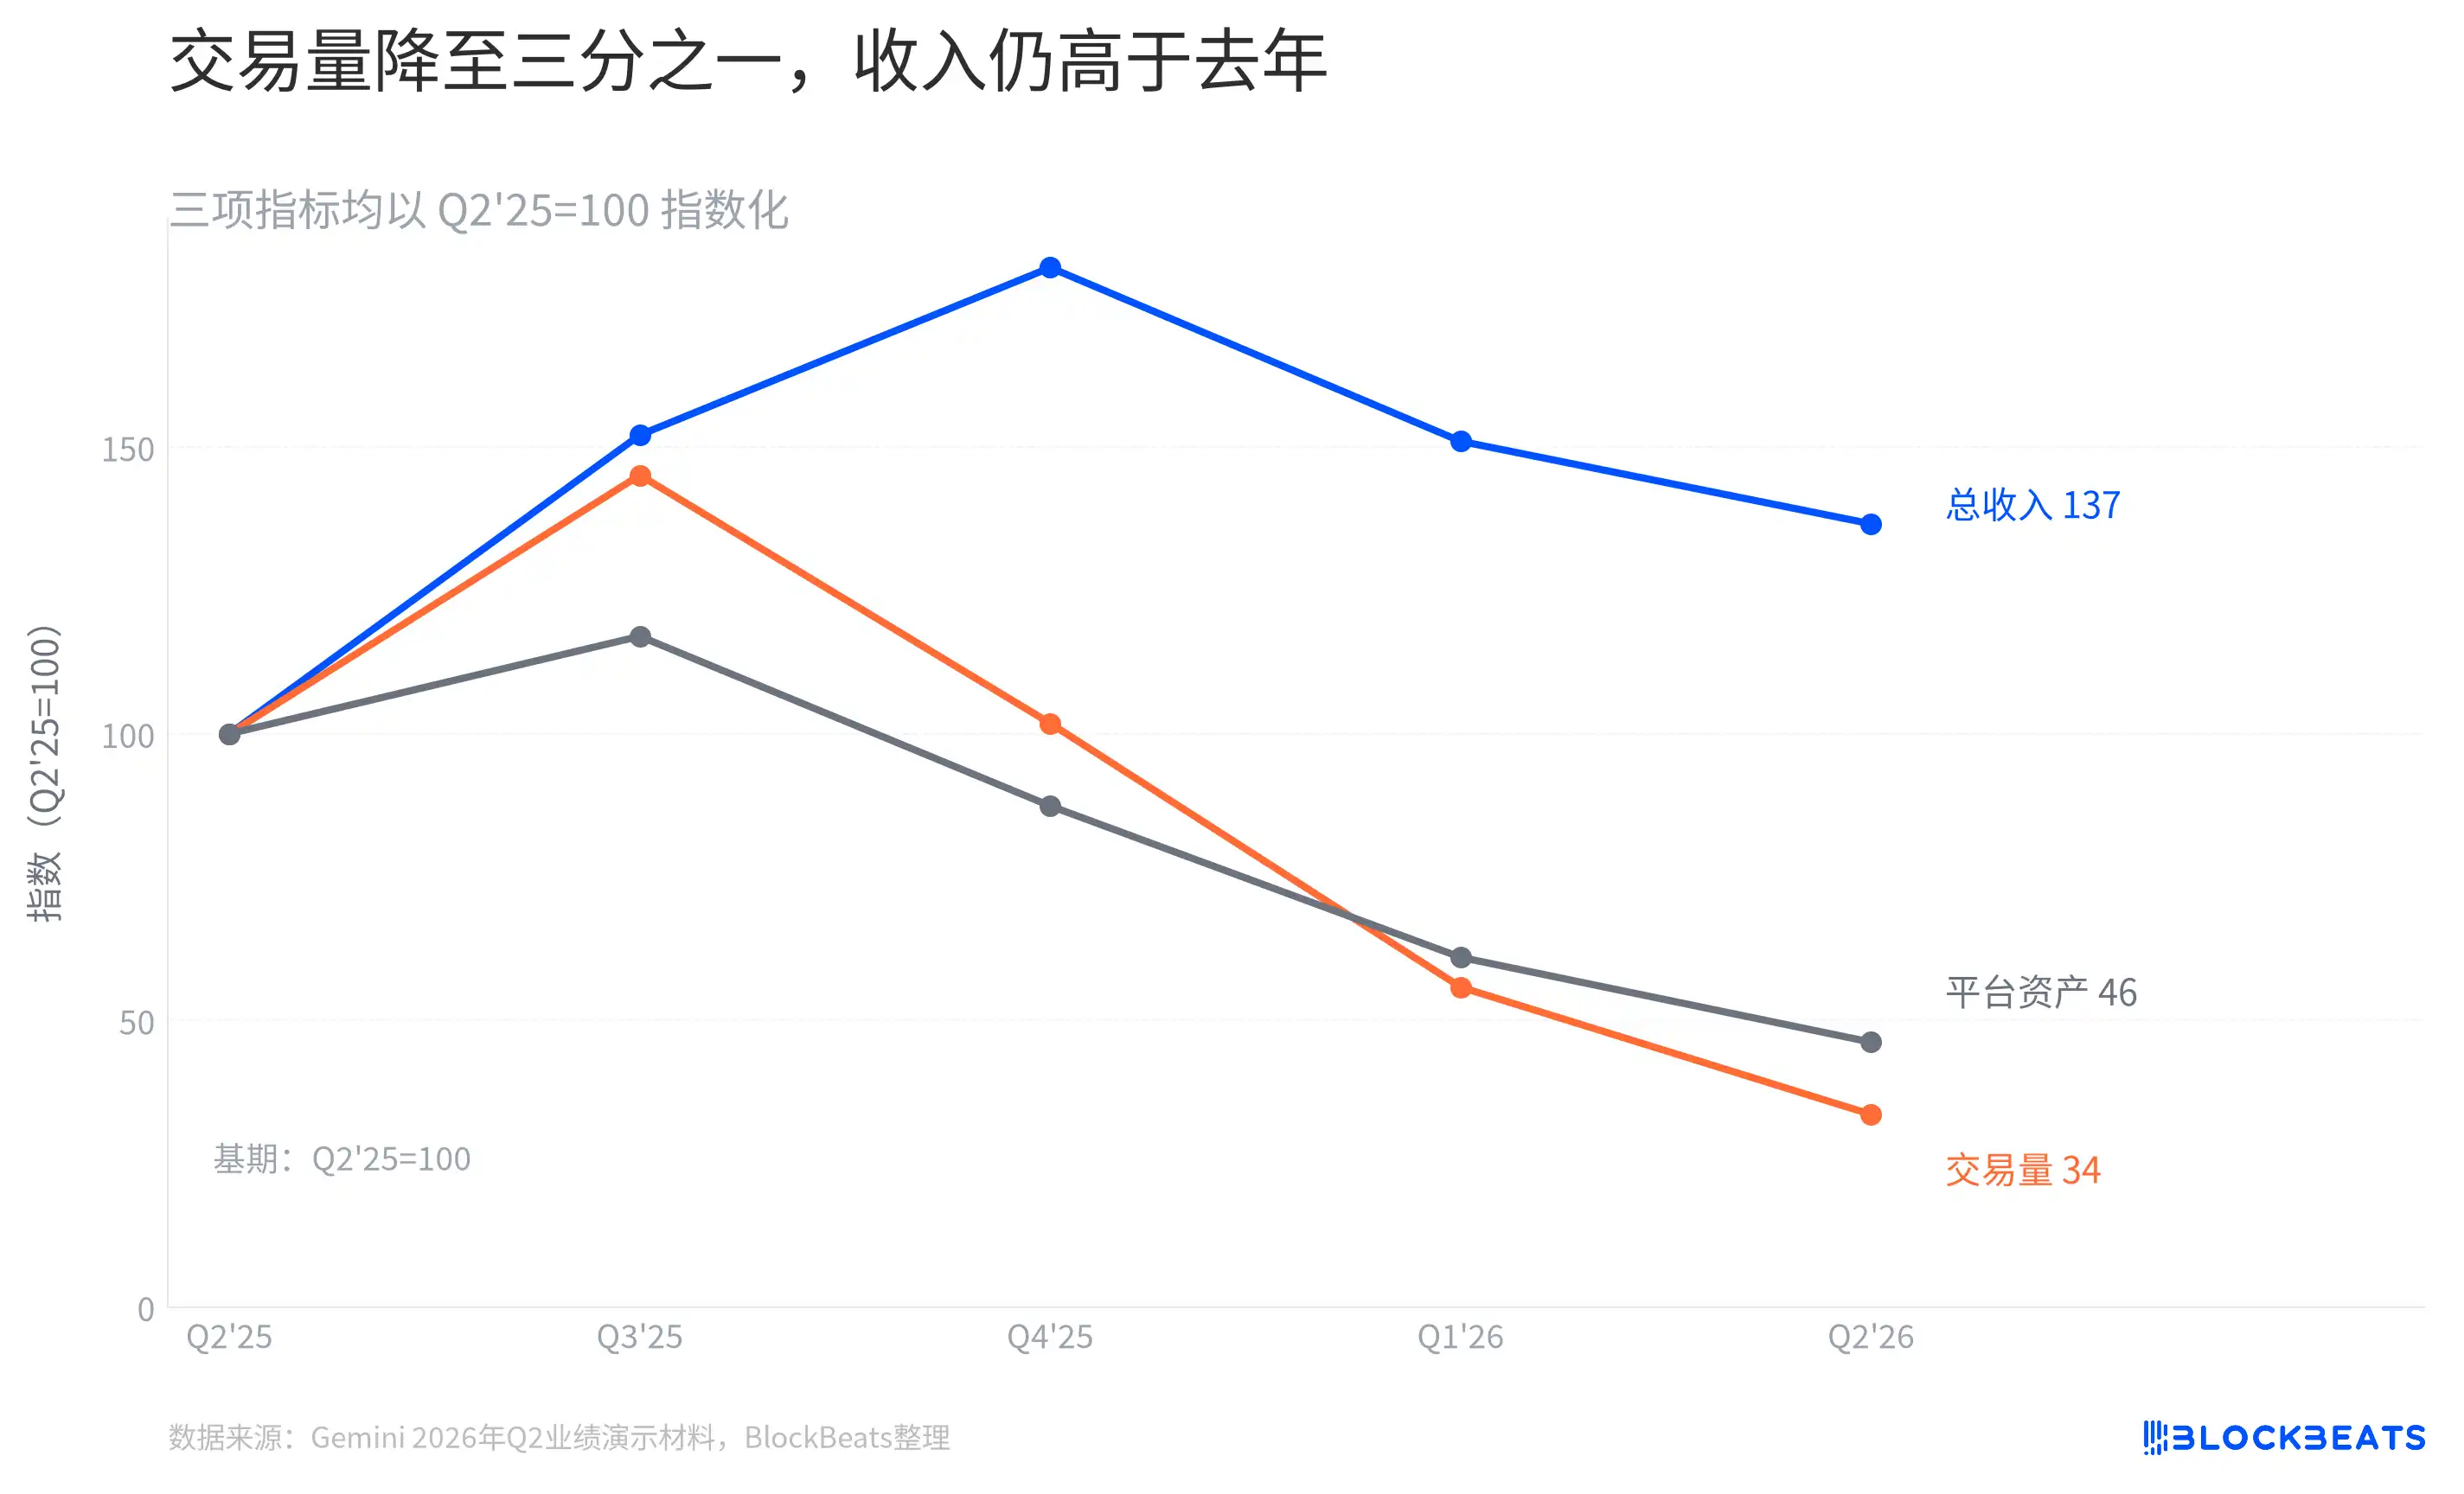
That is one of the clearest signs of what product expansion changes. The platform can now generate revenue from a wider set of user interactions, and the explanatory power of trading volume alone has weakened.
There is another boundary in the disclosure. Platform assets are not Gemini’s own cash. The figure includes custody, staking, trading products, customer fiat custody assets and GUSD reserves. Reading that line as freely deployable corporate cash, or treating the revenue divergence as proof that the company has become insulated from crypto cycles, would go beyond what the earnings materials actually show.
What the filing does show is a real change in revenue mix. What it does not yet establish is that Gemini has moved beyond cycle dependence. Across the past five quarters, the data suggests the company is spreading a story once driven mainly by one trading curve across a broader set of business lines.
New revenue has to be measured against credit costs
Rapid growth in credit card revenue does not mean the business contributed profit on the same scale. Gemini defines its non-GAAP PPNR metric as credit card net revenue after funding debt interest expense and crypto rewards expense.
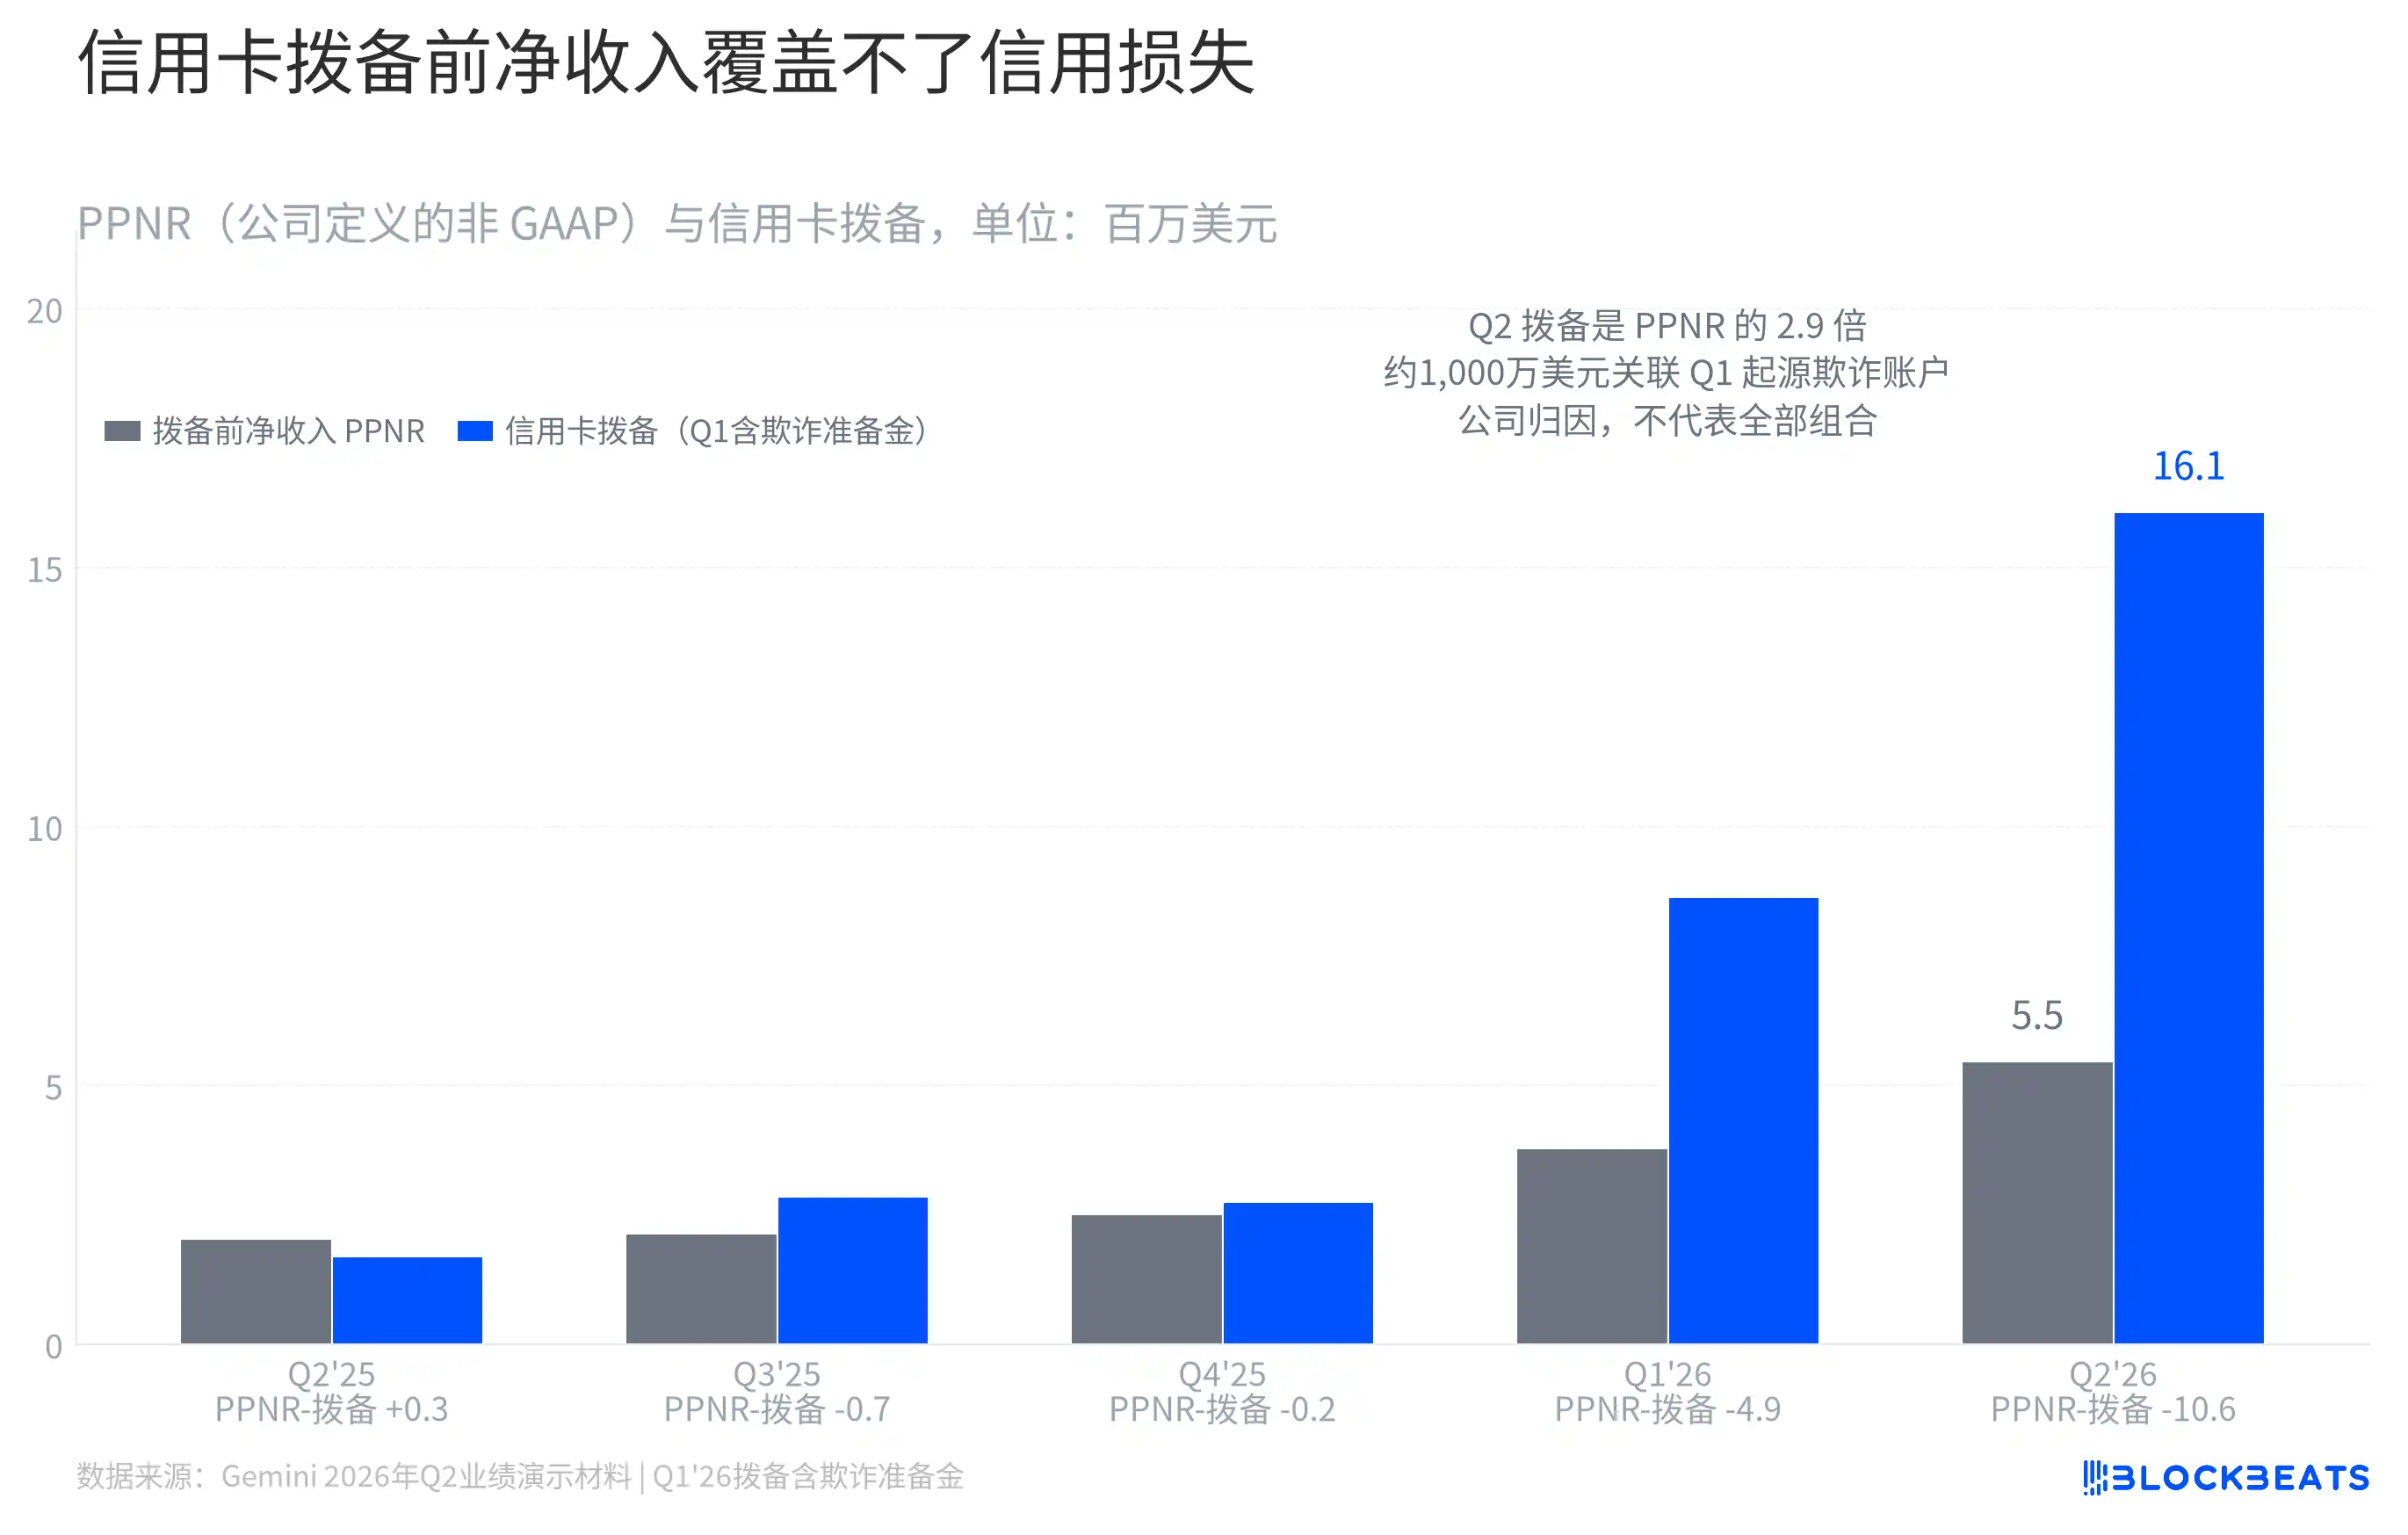
For the second quarter, PPNR was $5.457 million, while credit card provisions were $16.062 million. Using the company’s two disclosed figures, that leaves a gap of $10.605 million. The second row on the chart’s horizontal axis is labeled “PPNR-provision,” not Gemini’s net profit. It answers a narrower question: whether net income from the card business before credit costs was enough to absorb those provisions.
In its earnings release, Gemini said about $10 million of the provision was tied to a group of accounts opened in the first quarter that involved identified identity fraud activity. That attribution was made by management for a specific account cohort and should not be generalized to the entire card portfolio.
Still, the qualifier does not remove the pressure on risk controls. Gemini also disclosed that receivables more than 30 days delinquent rose to 9.4% from 3.8% in the previous quarter. For a business that has just become the company’s largest revenue source, the revenue curve now has to be read alongside the credit-cost curve.
Gemini has more ways to make money than before. The operating variables behind that revenue are also changing, extending beyond trading activity into credit costs and risk management.