
Gold rose in early August even as oil prices moved lower, breaking from the usual script in which easing energy markets and lower geopolitical tension tend to cool safe-haven trades.
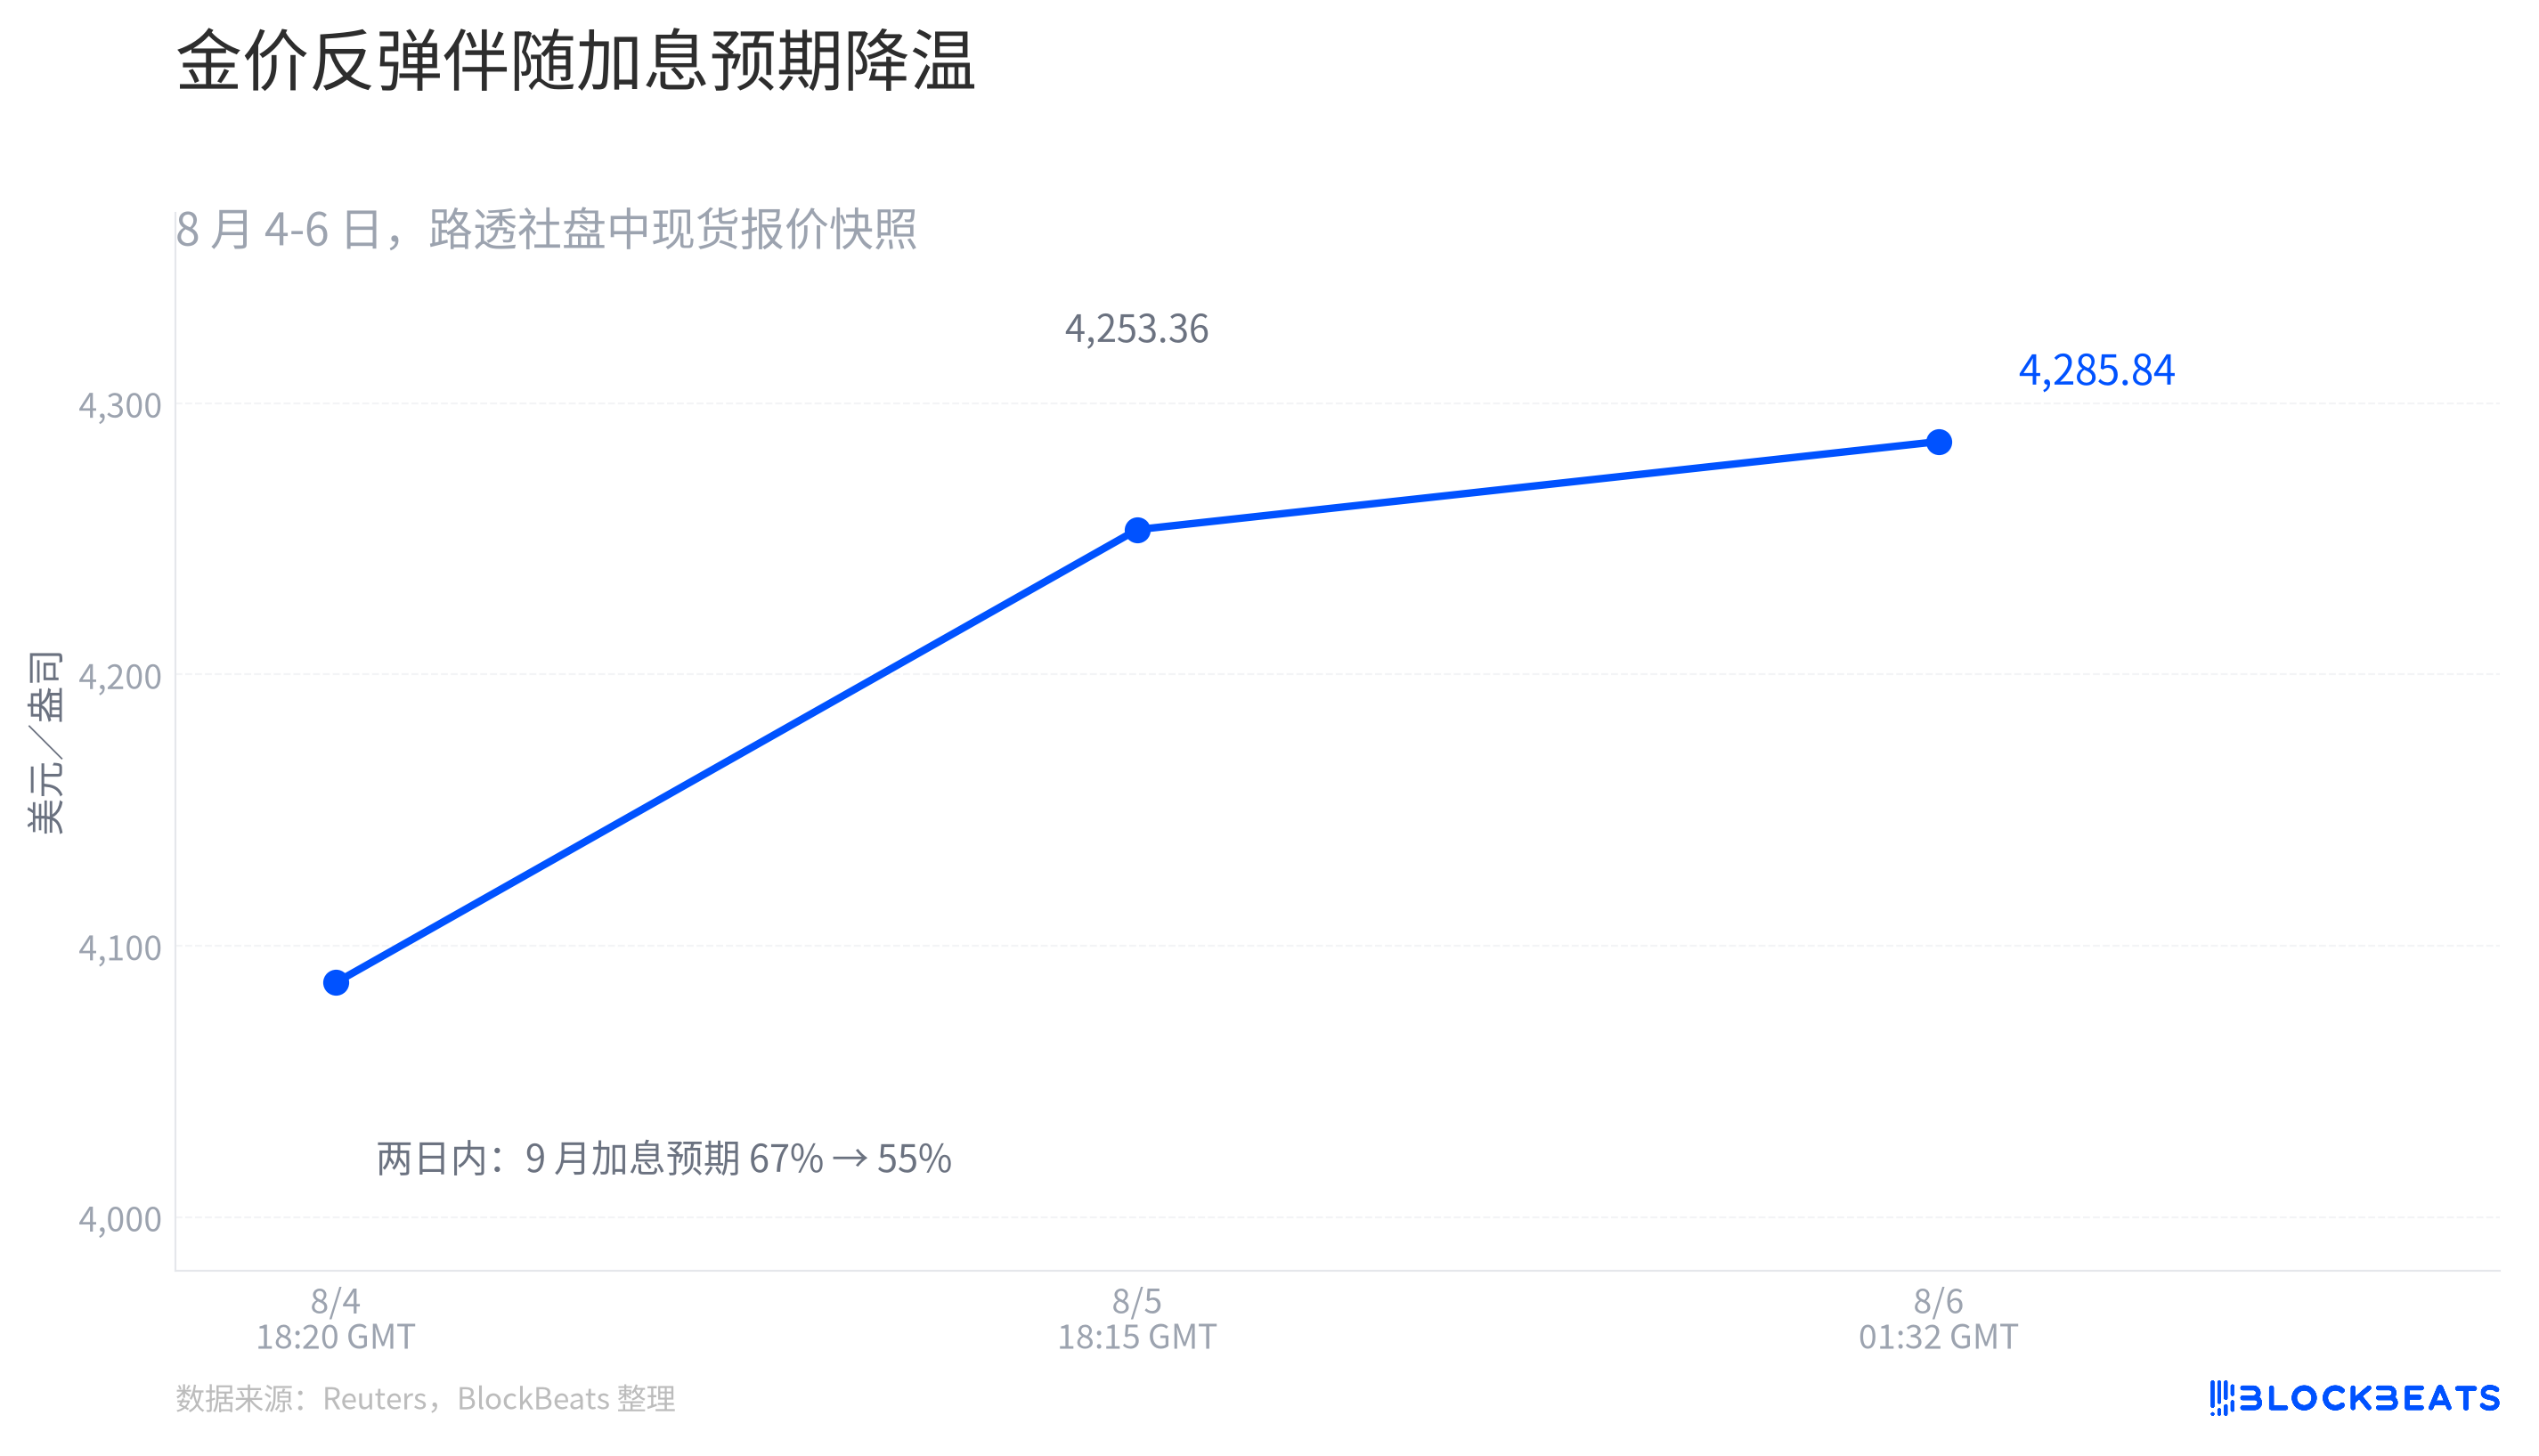
Reuters reported on Aug. 6 that spot gold was quoted at $4,285.84 per ounce, up for a fourth straight session and at its highest level since mid-June.
That price action can be placed inside a geopolitical-risk narrative, but Reuters pointed to a faster-moving explanation. As oil retreated, the U.S. dollar and Treasury yields weakened as well, and markets began recalculating how high the Federal Reserve might still need to push rates. Gold started rising when the opportunity cost of holding it was repriced.
Rate expectations shifted first
There is no direct supply-and-demand conveyor belt between crude oil and gold. Oil matters because it shapes inflation expectations. If energy prices stop pressing higher, the case for further rate hikes looks less urgent.
According to Reuters on Aug. 6, market pricing for an additional September rate hike fell to 55% from 67% over two days. The same report said Treasury yields moved lower and the dollar index came under pressure. That helps explain why a development that appeared to reduce geopolitical risk still ended up giving gold short-term support.
The chart data came from Reuters intraday quotes on Aug. 4, Aug. 5 and Aug. 6.
Those three price points were not daily candles and not closing prices. They were closer to snapshots taken at different moments during trading. Gold moved higher while rate-hike pricing eased back, with both reflecting the same round of macro repricing.
Data from the St. Louis Fed’s FRED database showed the 10-year Treasury Inflation-Protected Securities yield falling from 2.47% to 2.40%. For gold, that is not an abstract macro figure. It means the risk-free return available from not holding gold fell slightly. The hurdle for owning a non-yielding asset became lower, and a weaker dollar also reduced the pricing burden for overseas buyers, giving short-term demand a place to enter.
Higher prices did not bring a matching rise in tonnage
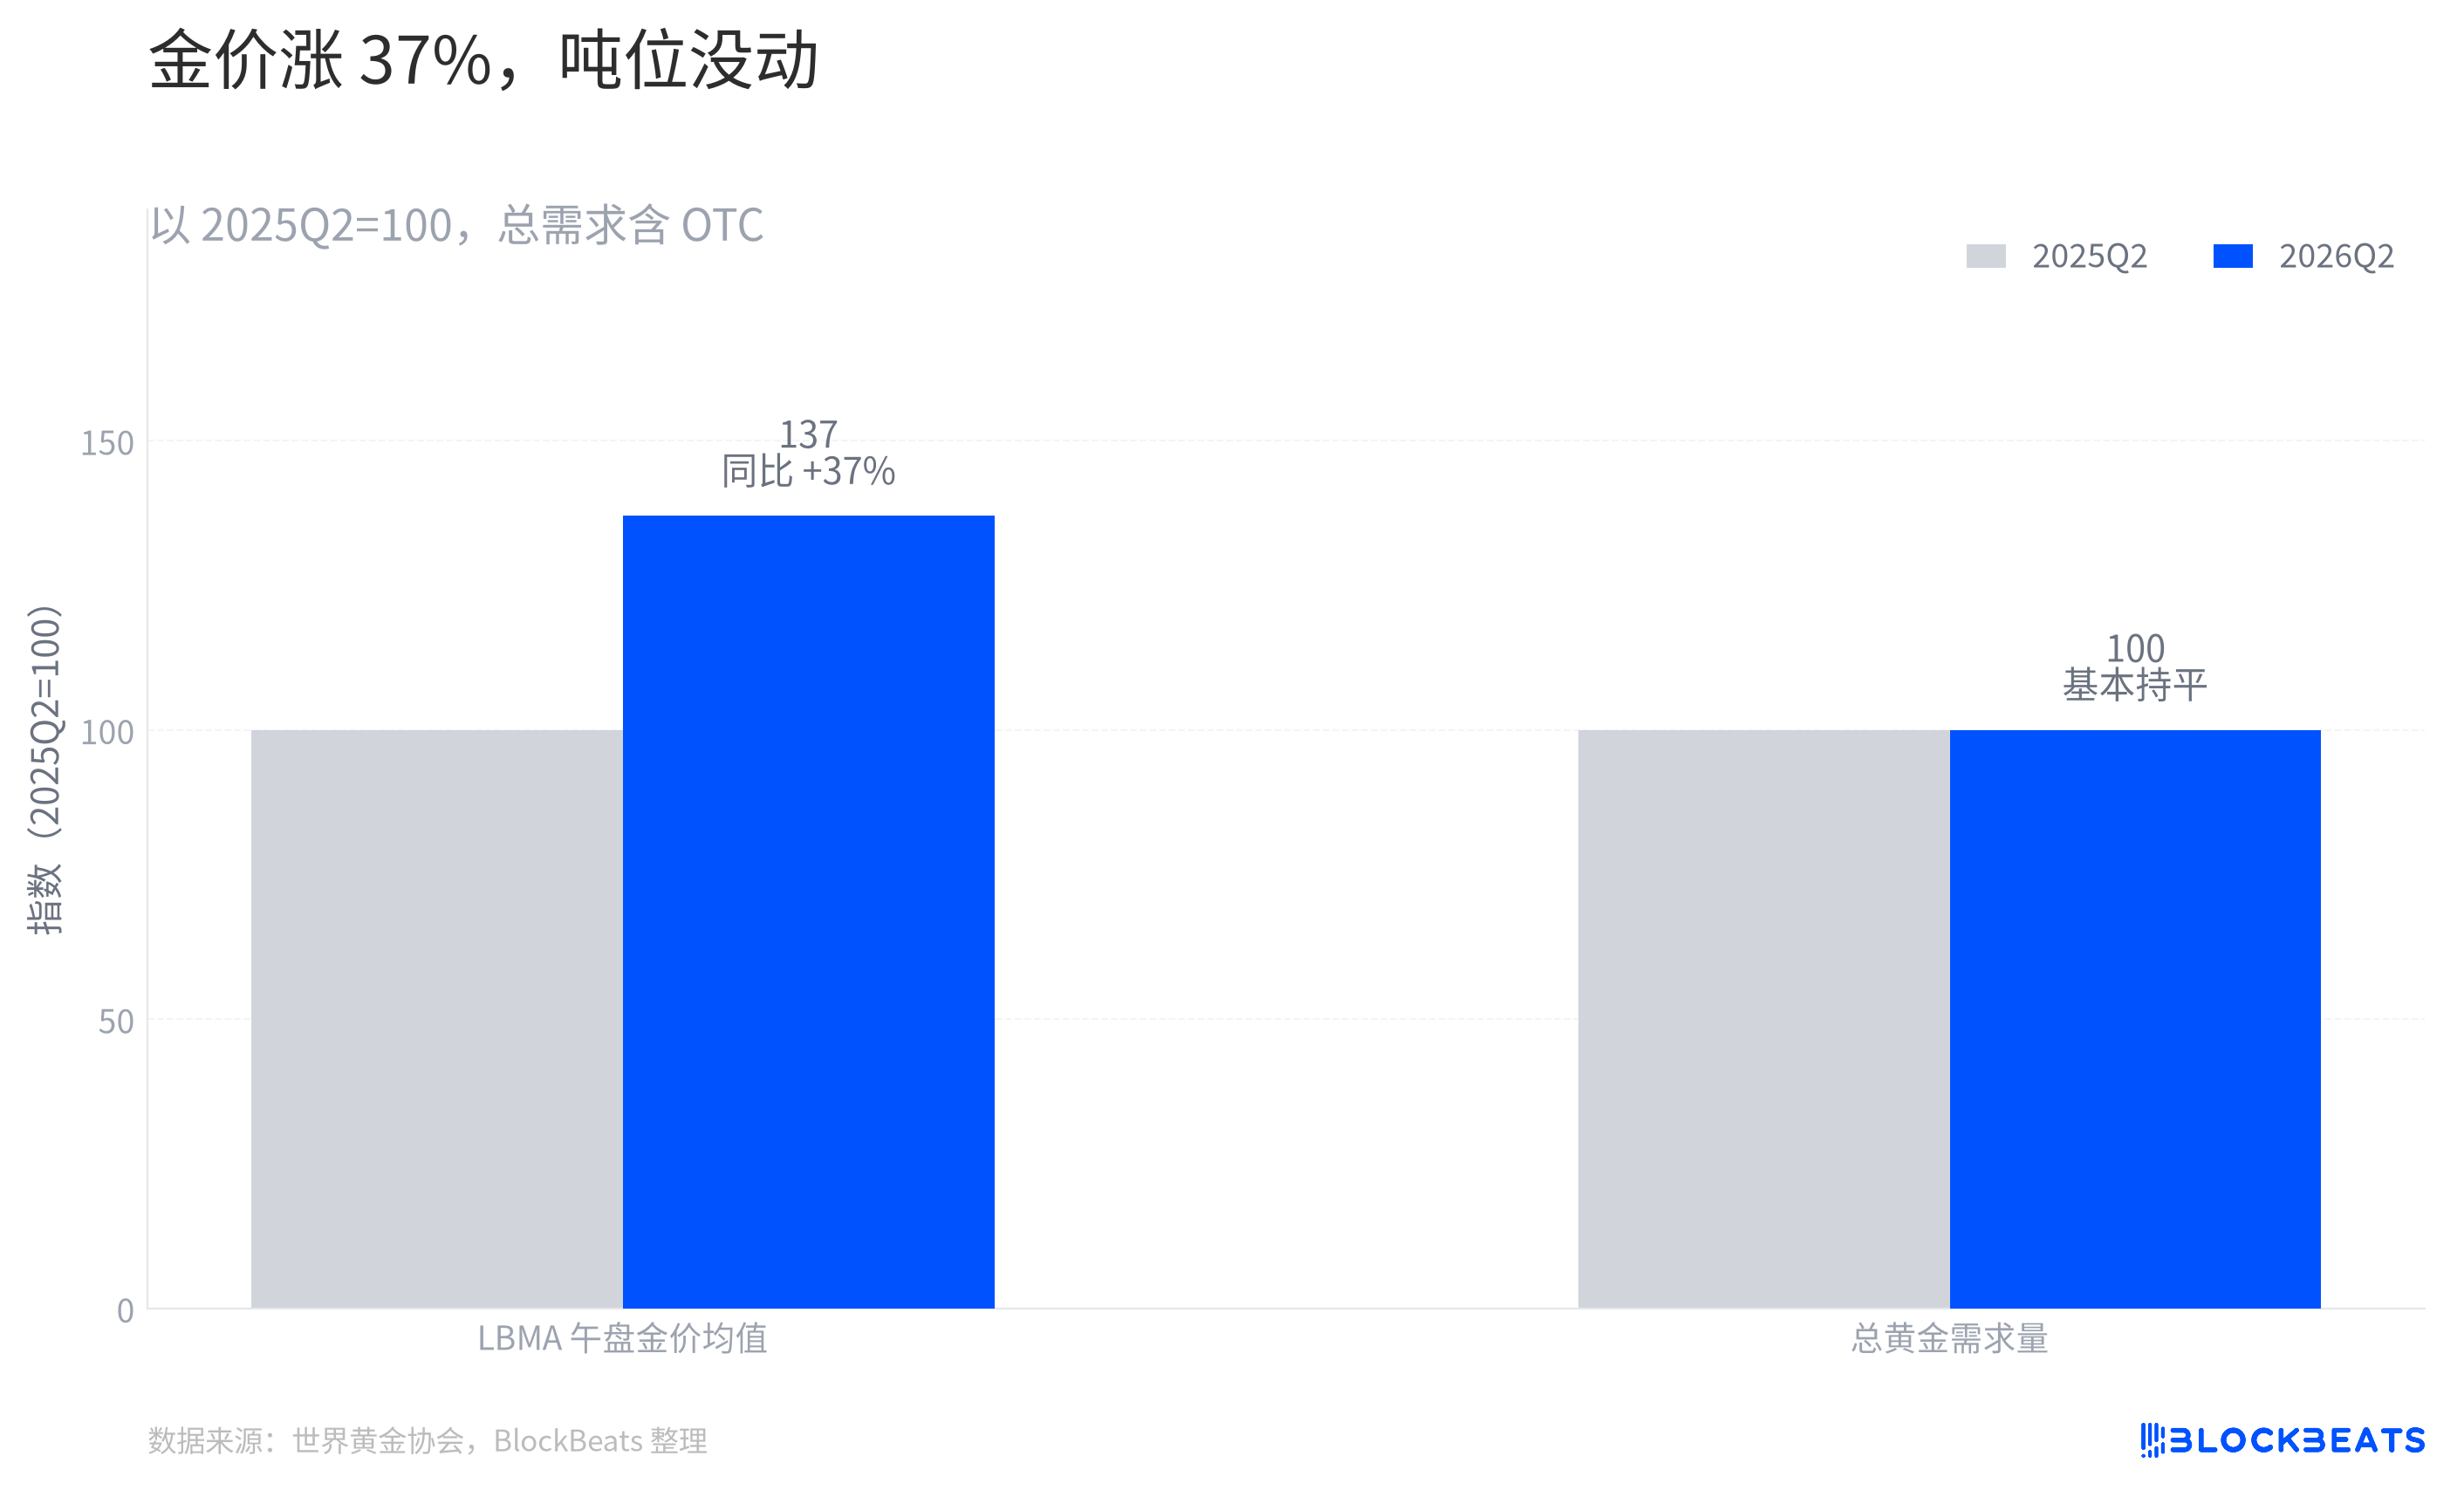
A fast move in price can easily create the impression that the whole world is scrambling for gold. The World Gold Council’s second-quarter table showed a quieter picture. The LBMA afternoon gold price average rose 37% year over year, while total gold demand including OTC was broadly flat at 1,269 tonnes. The World Gold Council placed both figures in the same summary table.
The key point is not simply that demand did not grow. It is that the definition of demand already changed. Total demand includes over-the-counter transactions and other balancing items; it is not the same as the total number of bars physically taken away by retail buyers. Tonnage that barely moved suggests price was repriced first, rather than every category of buyer suddenly increasing purchases.
The World Gold Council’s first-half figures also showed demand value reaching a record $380 billion, while demand volume rose only 2% year over year. That gap shows larger dollar demand did not translate into proportionate tonnage growth. What the price reflected was a change in the weight of different demand categories, not uniform buying across all of them.
ETF flows do not tell the whole story
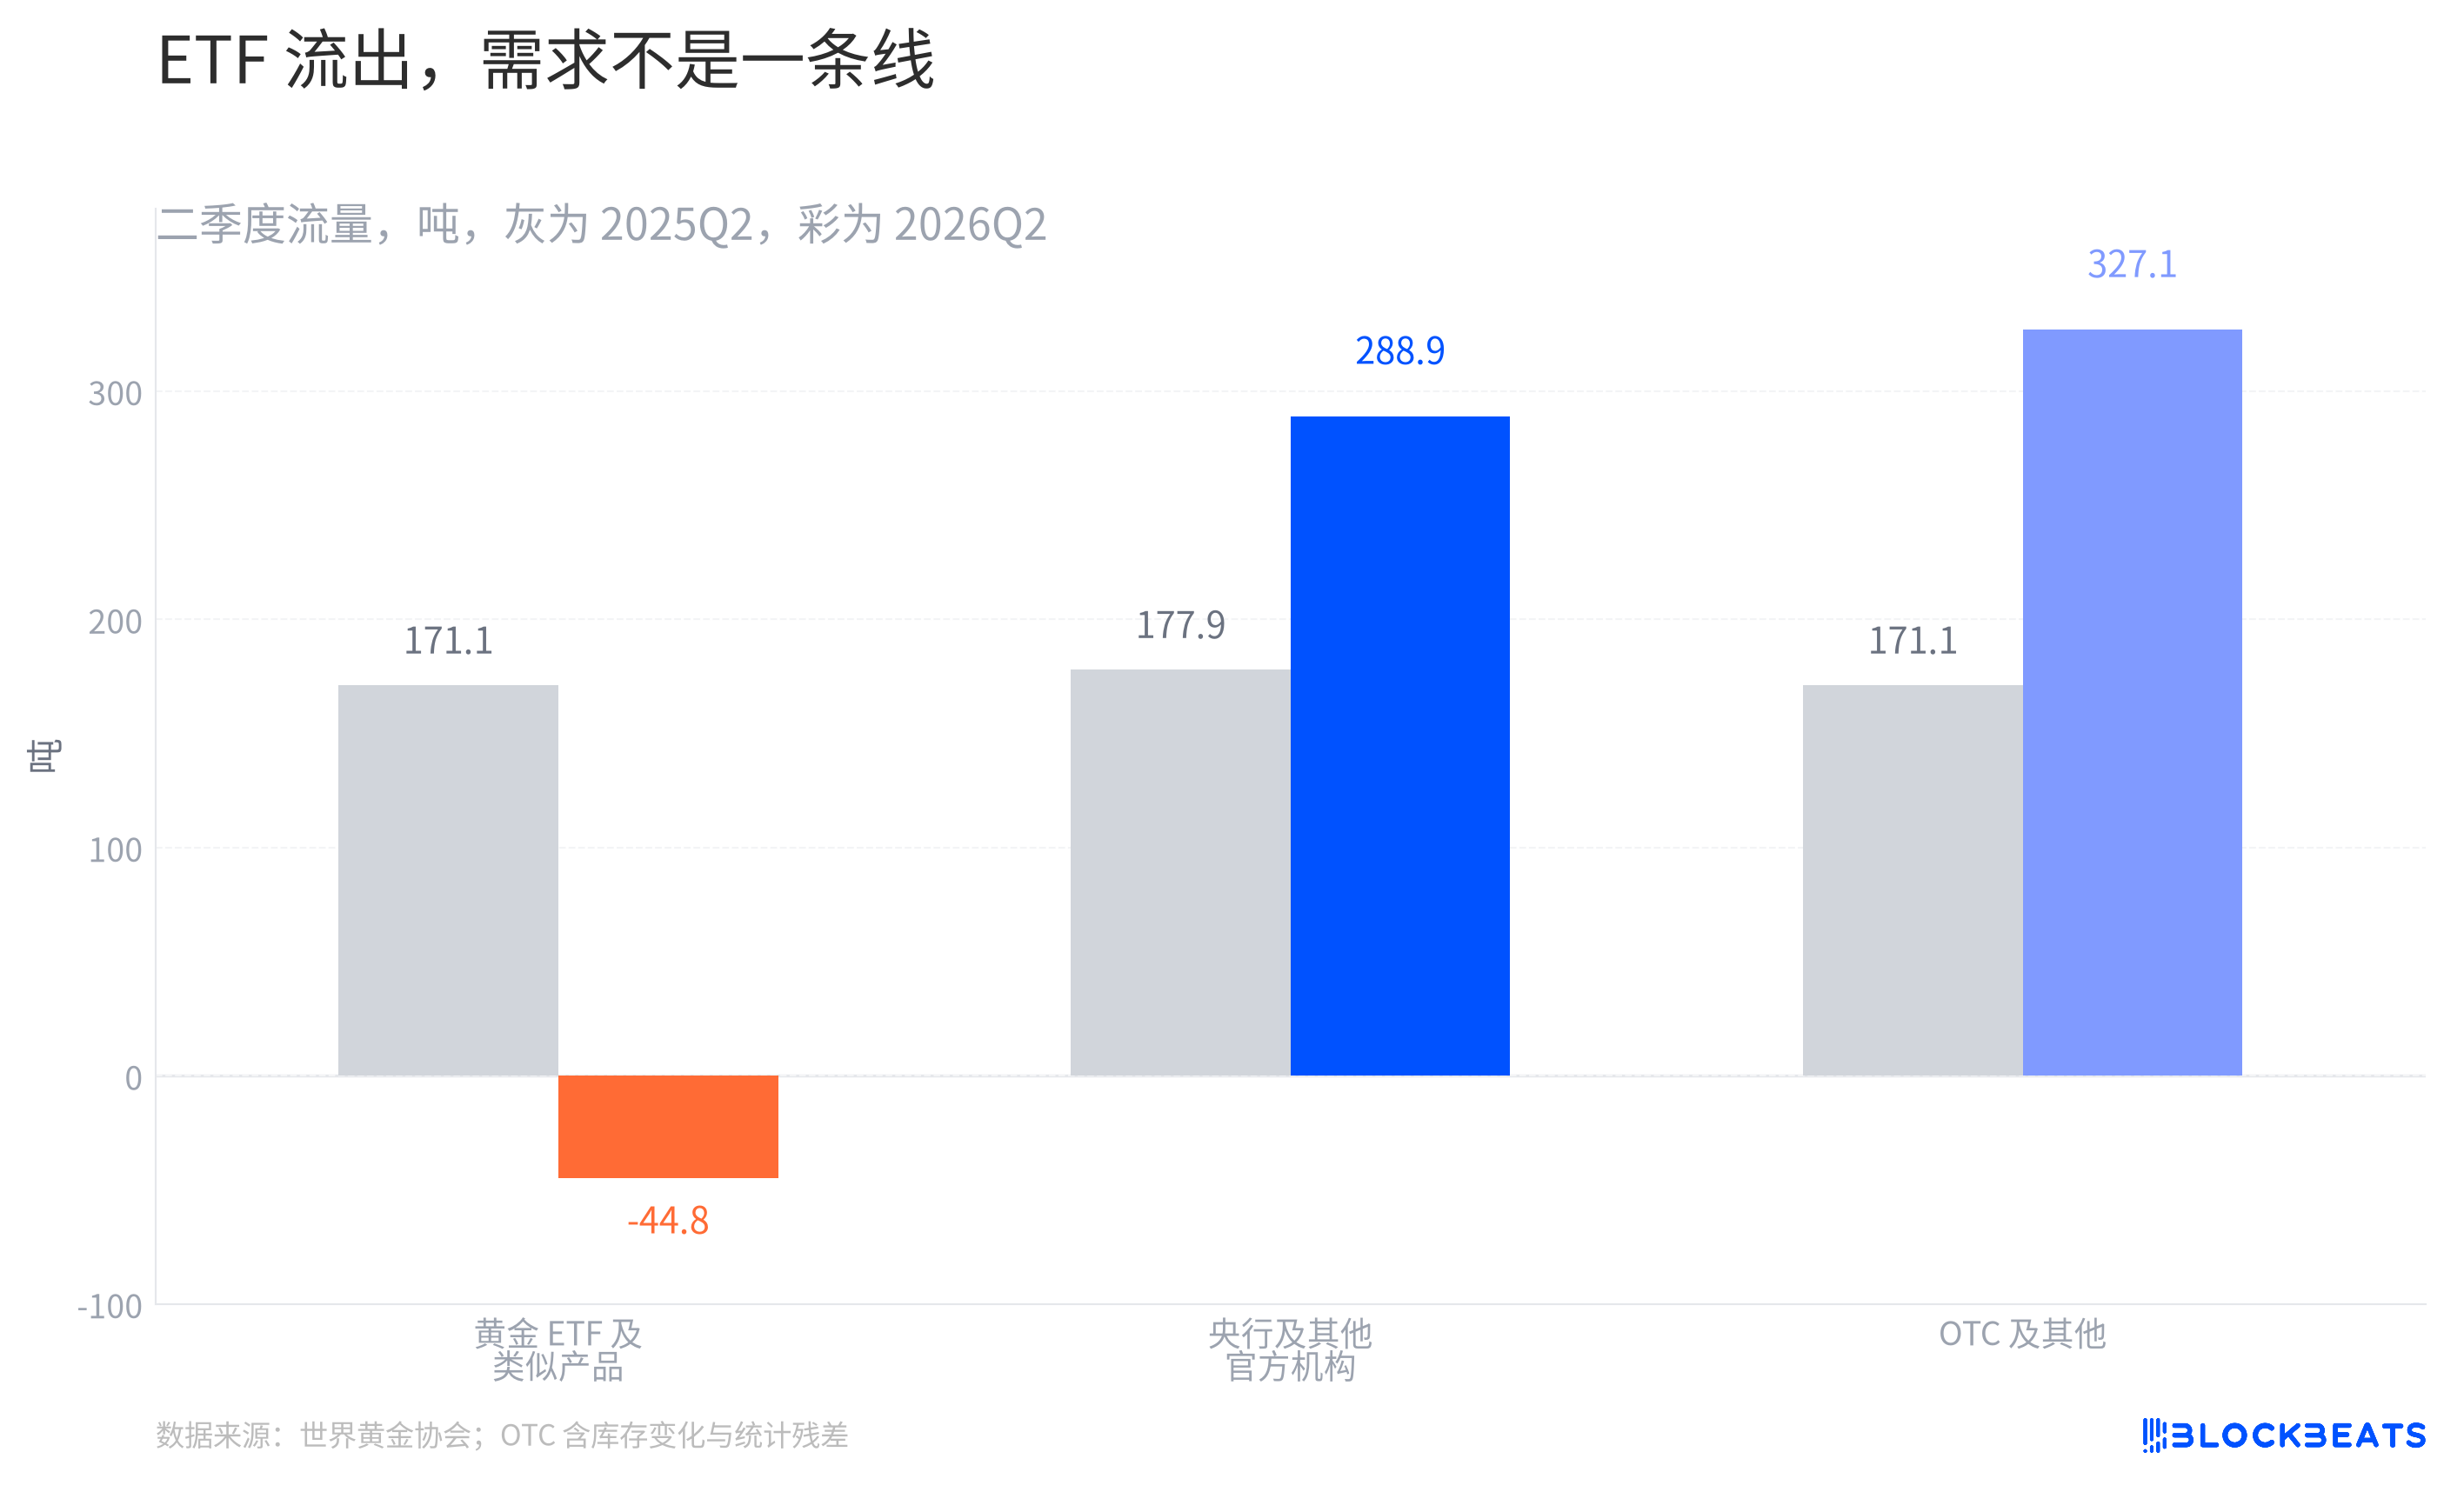
The most visible selling came from gold ETFs. In the second quarter, ETFs and similar products turned to net outflows. At the same time, the World Gold Council recorded a recovery in net purchases by central banks and other official institutions, while OTC and other categories also expanded. Looking at these items side by side shows that the gold market is not driven by one public holdings curve alone.
That table, though, should not be read as a delivery sheet showing exactly who absorbed ETF selling. In its methodology notes, the World Gold Council said OTC and other categories also include changes in exchange inventories, unobserved changes in fabrication inventories and statistical residuals. The figures can show that ETF outflows do not mean the broader market lacked buyers, but they cannot identify one country or one class of capital as the direct taker.
Central-bank data should not be stretched into a one-way line either. The World Gold Council has already revised down its estimate for official-sector gold buying in the first quarter because reporting and statistics come with lags. Treating ETFs as the only thermometer, or central banks as the only buyer, flattens a layered market into a single story.
From this set of signals, the drop in oil prices lowered the short-term opportunity cost of holding gold. The split between price and tonnage, and between public and non-public flows, suggests that what changed during the rally was often the composition of holders rather than a universal surge in buying.