

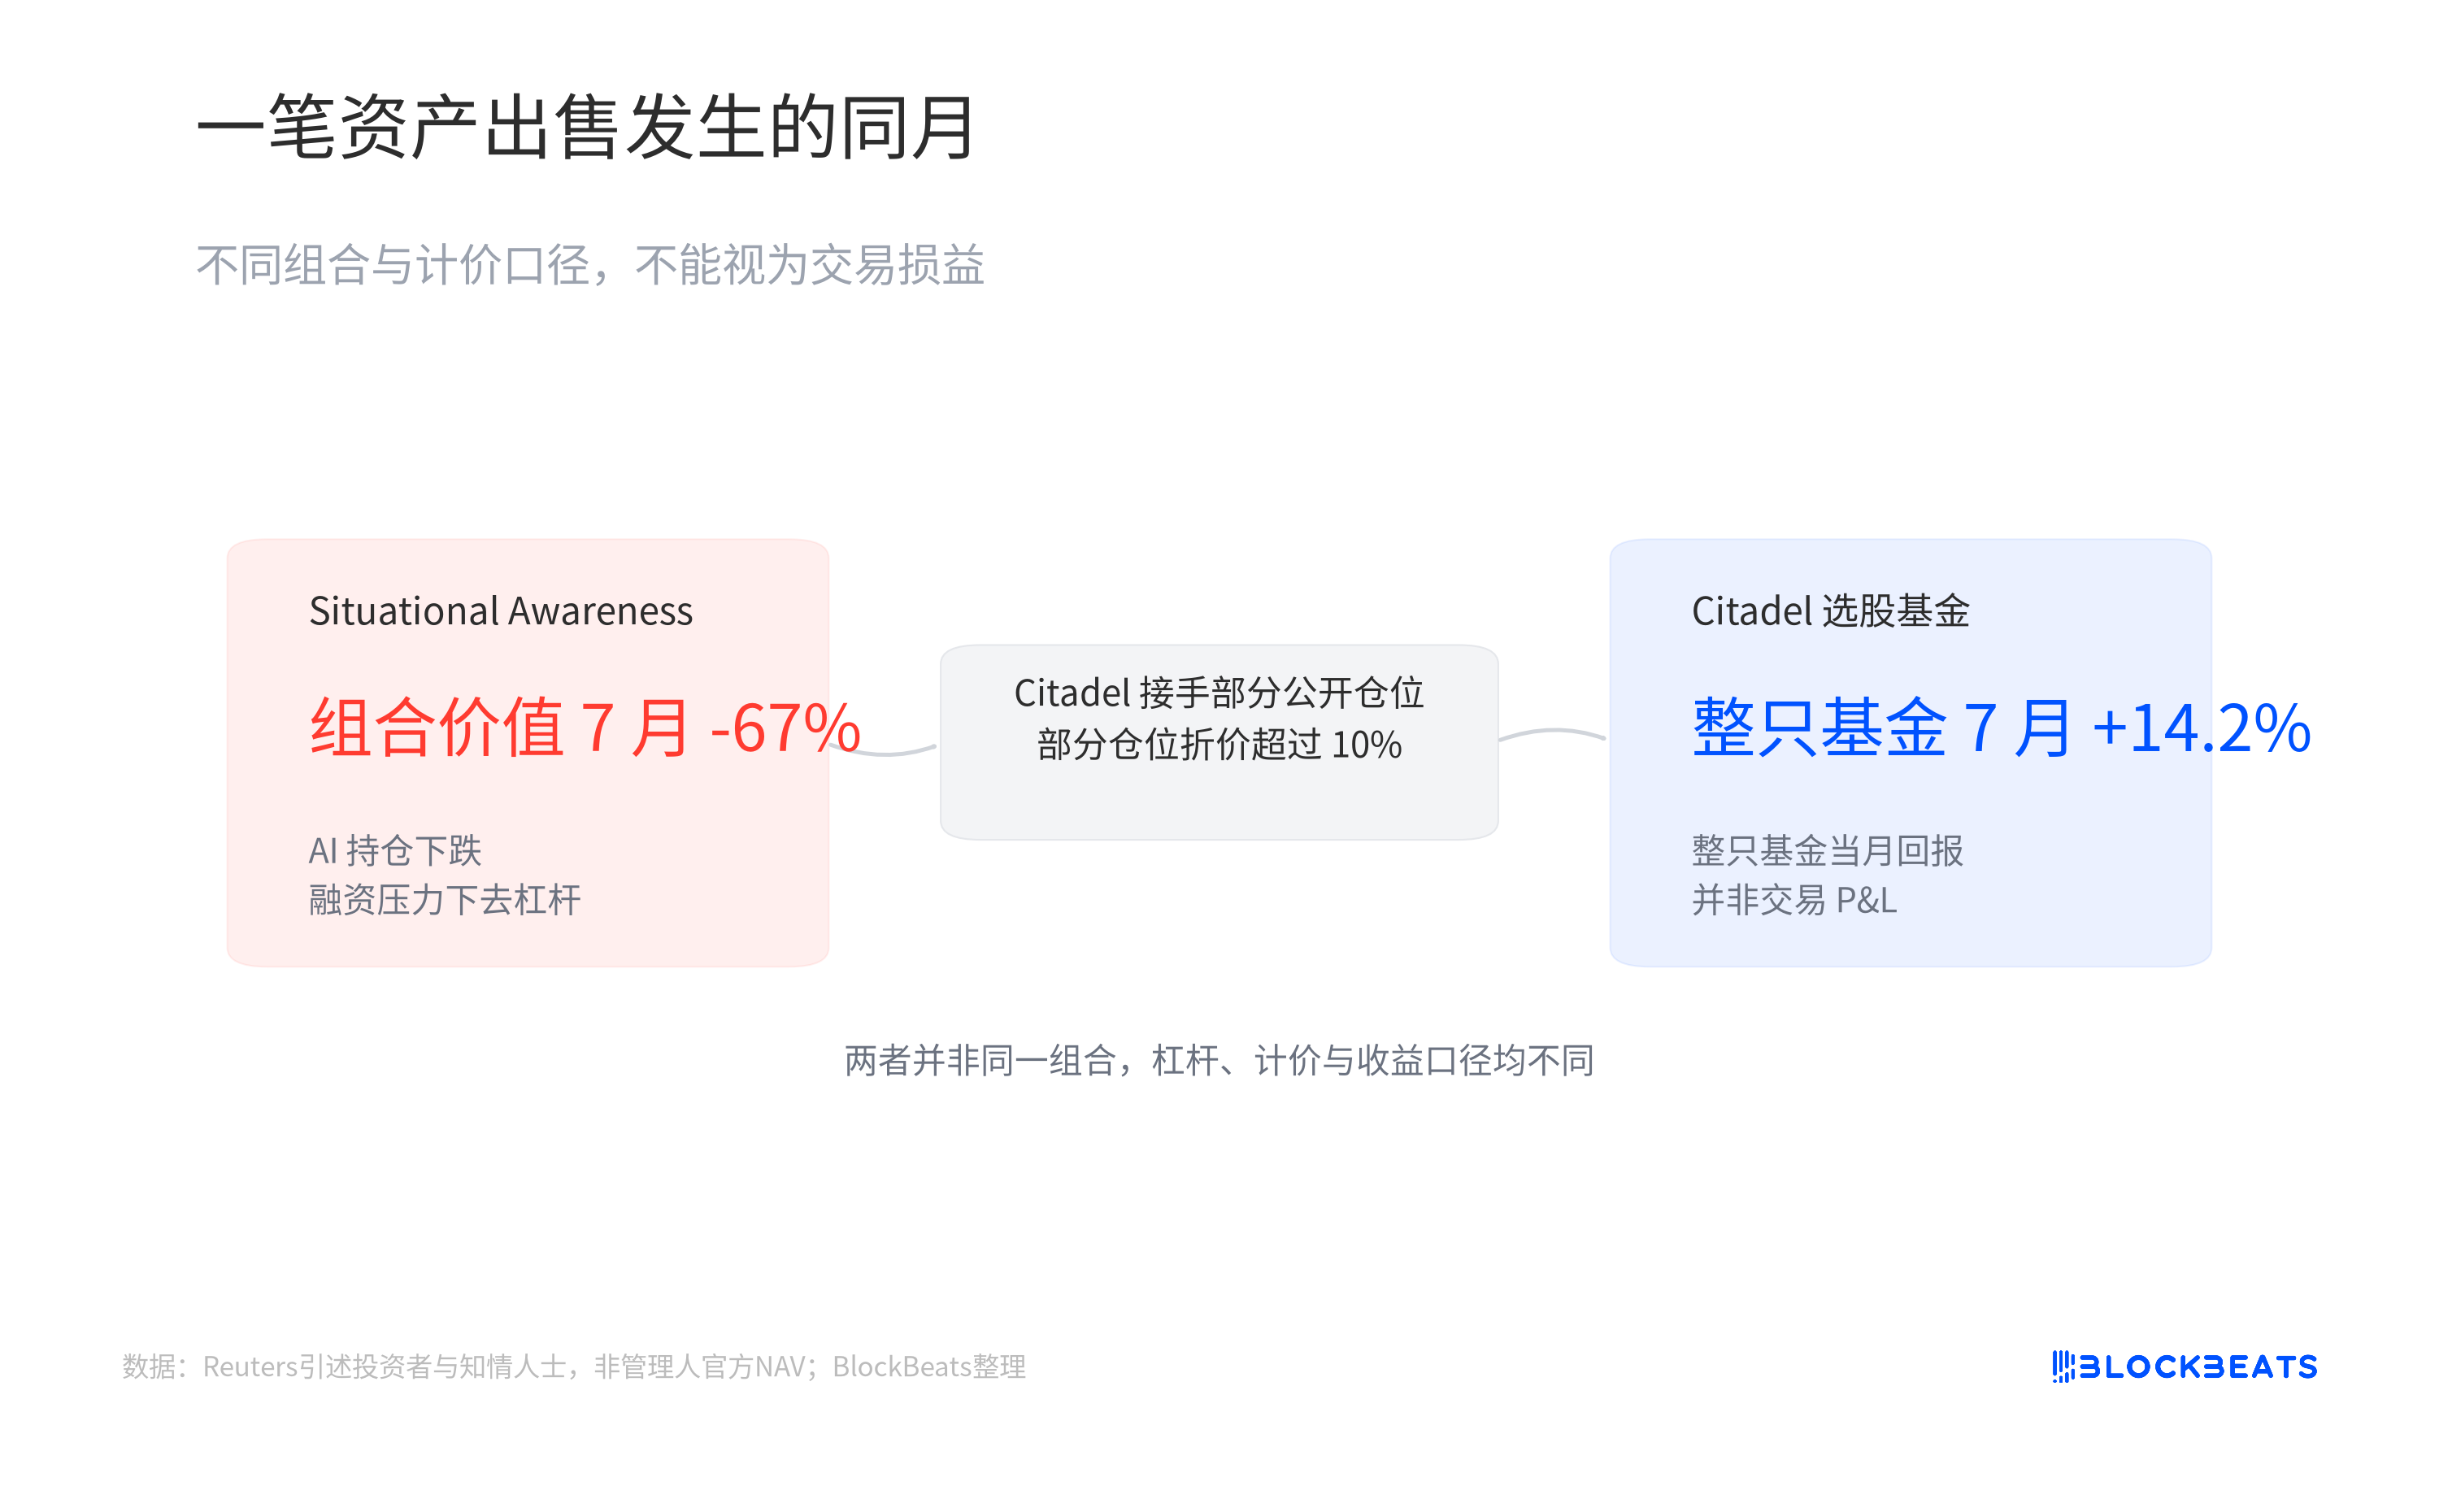
Late in the final week of July, AI-focused fund Situational Awareness sold most of its public equity holdings to hedge fund giant Citadel. A July 31 Reuters report, based on an investor letter seen by the news agency, said the fund’s portfolio value fell 67% during the month. Five days later, Reuters reported on August 5, citing investor information, that Citadel’s equities-focused fund gained 14.2% in July. The two funds were caught in the same AI stock pullback, but the roles were different: one was deleveraging under financing pressure, the other took over part of the public stock book.
That comparison, though, only goes so far. July return tables included systematic products that finished in positive territory, along with funds that were forced to adjust positions after technology holdings fell. Putting all of them under a single “quant” label strips out the distinctions that matter most.
A short list of systematic winners did not define the whole quant field
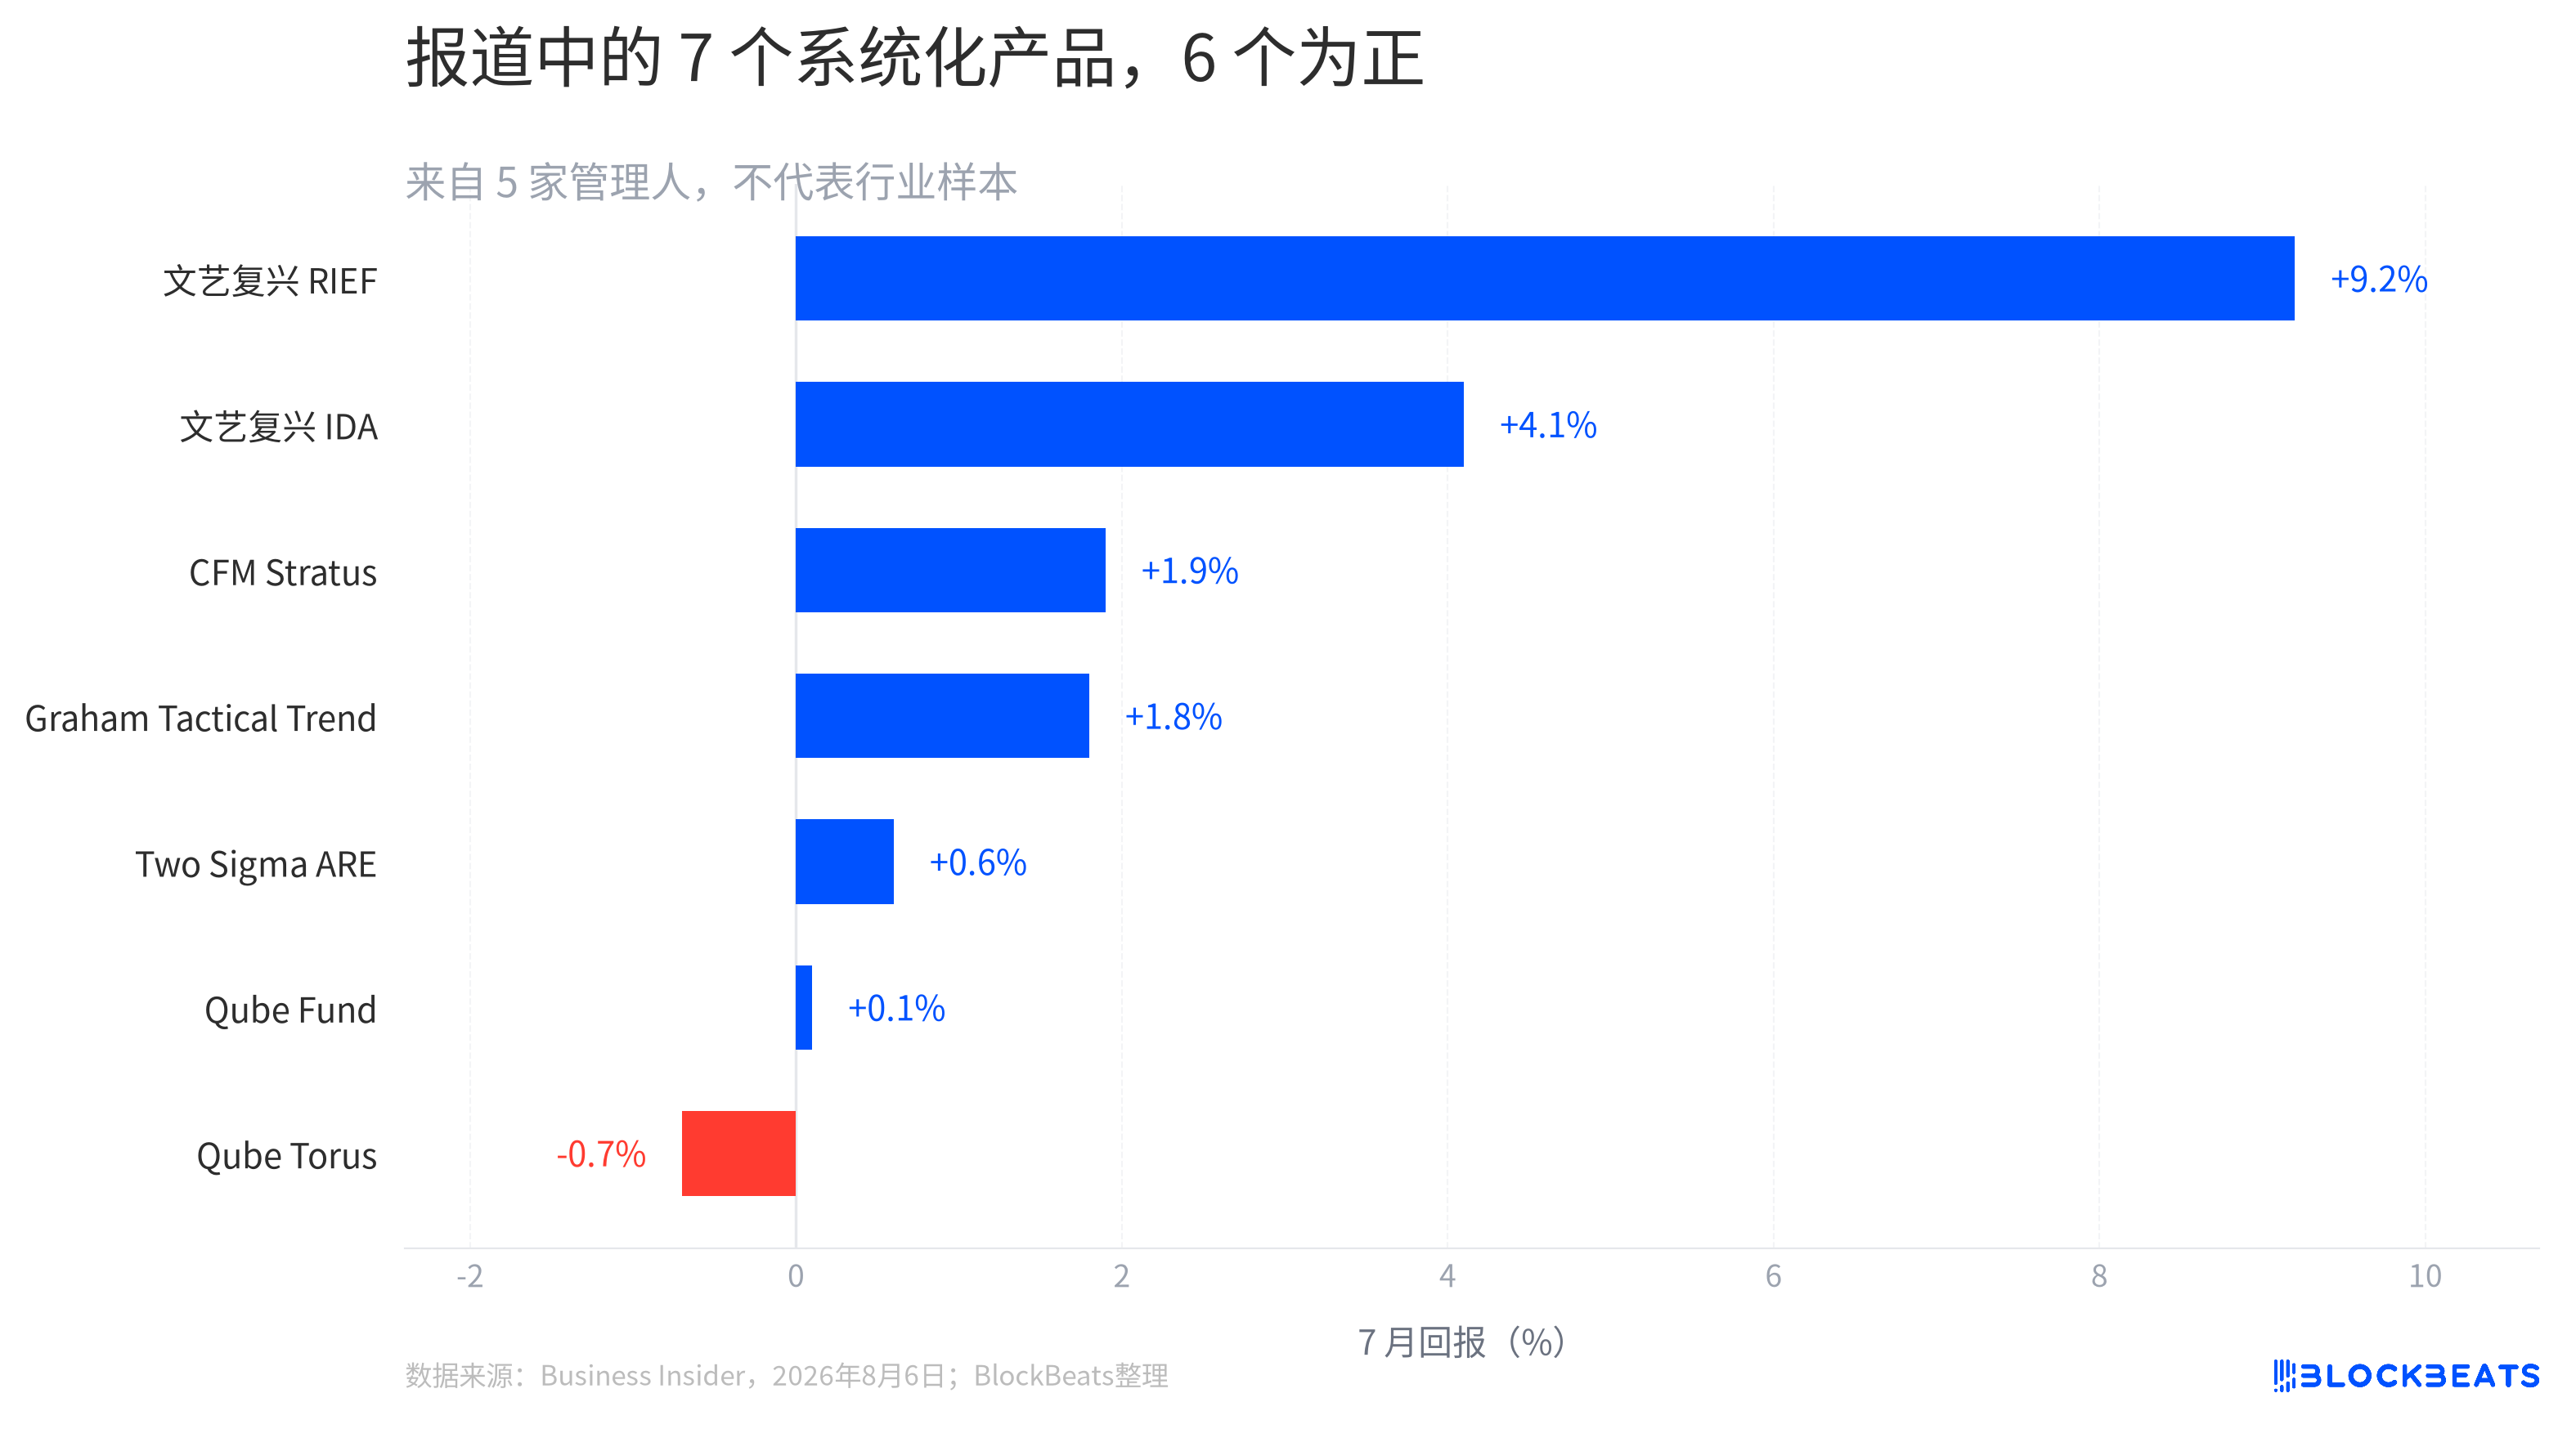
Business Insider said the products highlighted in its report came from five managers. The seven systematic funds it listed amounted to a limited return sheet, not a census of the quant industry.
Within that group, Renaissance Technologies’ Renaissance Institutional Equities, or RIEF, rose 9.2% in July. In the same report, Qube’s Torus strategy was the only product in negative territory. The blue bars in the chart may have looked tidy, but they were not broad enough to support a conclusion about the industry as a whole.
The more useful takeaway from those numbers is that “quant” needs to be tied to specific products rather than treated as an abstract category. Business Insider cited monthly returns for RIEF, Renaissance Technologies’ Institutional Diversified Alpha, and Two Sigma’s Absolute Return Enhanced, but did not disclose the models, asset scope, or risk budgets behind those strategies. What the public could see were monthly performance figures quoted by the media.
A positive monthly return does not automatically translate into a claim that machines understood the market better. It shows only that those systems recorded gains in that particular month.
Category indexes and media scorecards captured different slices of the market
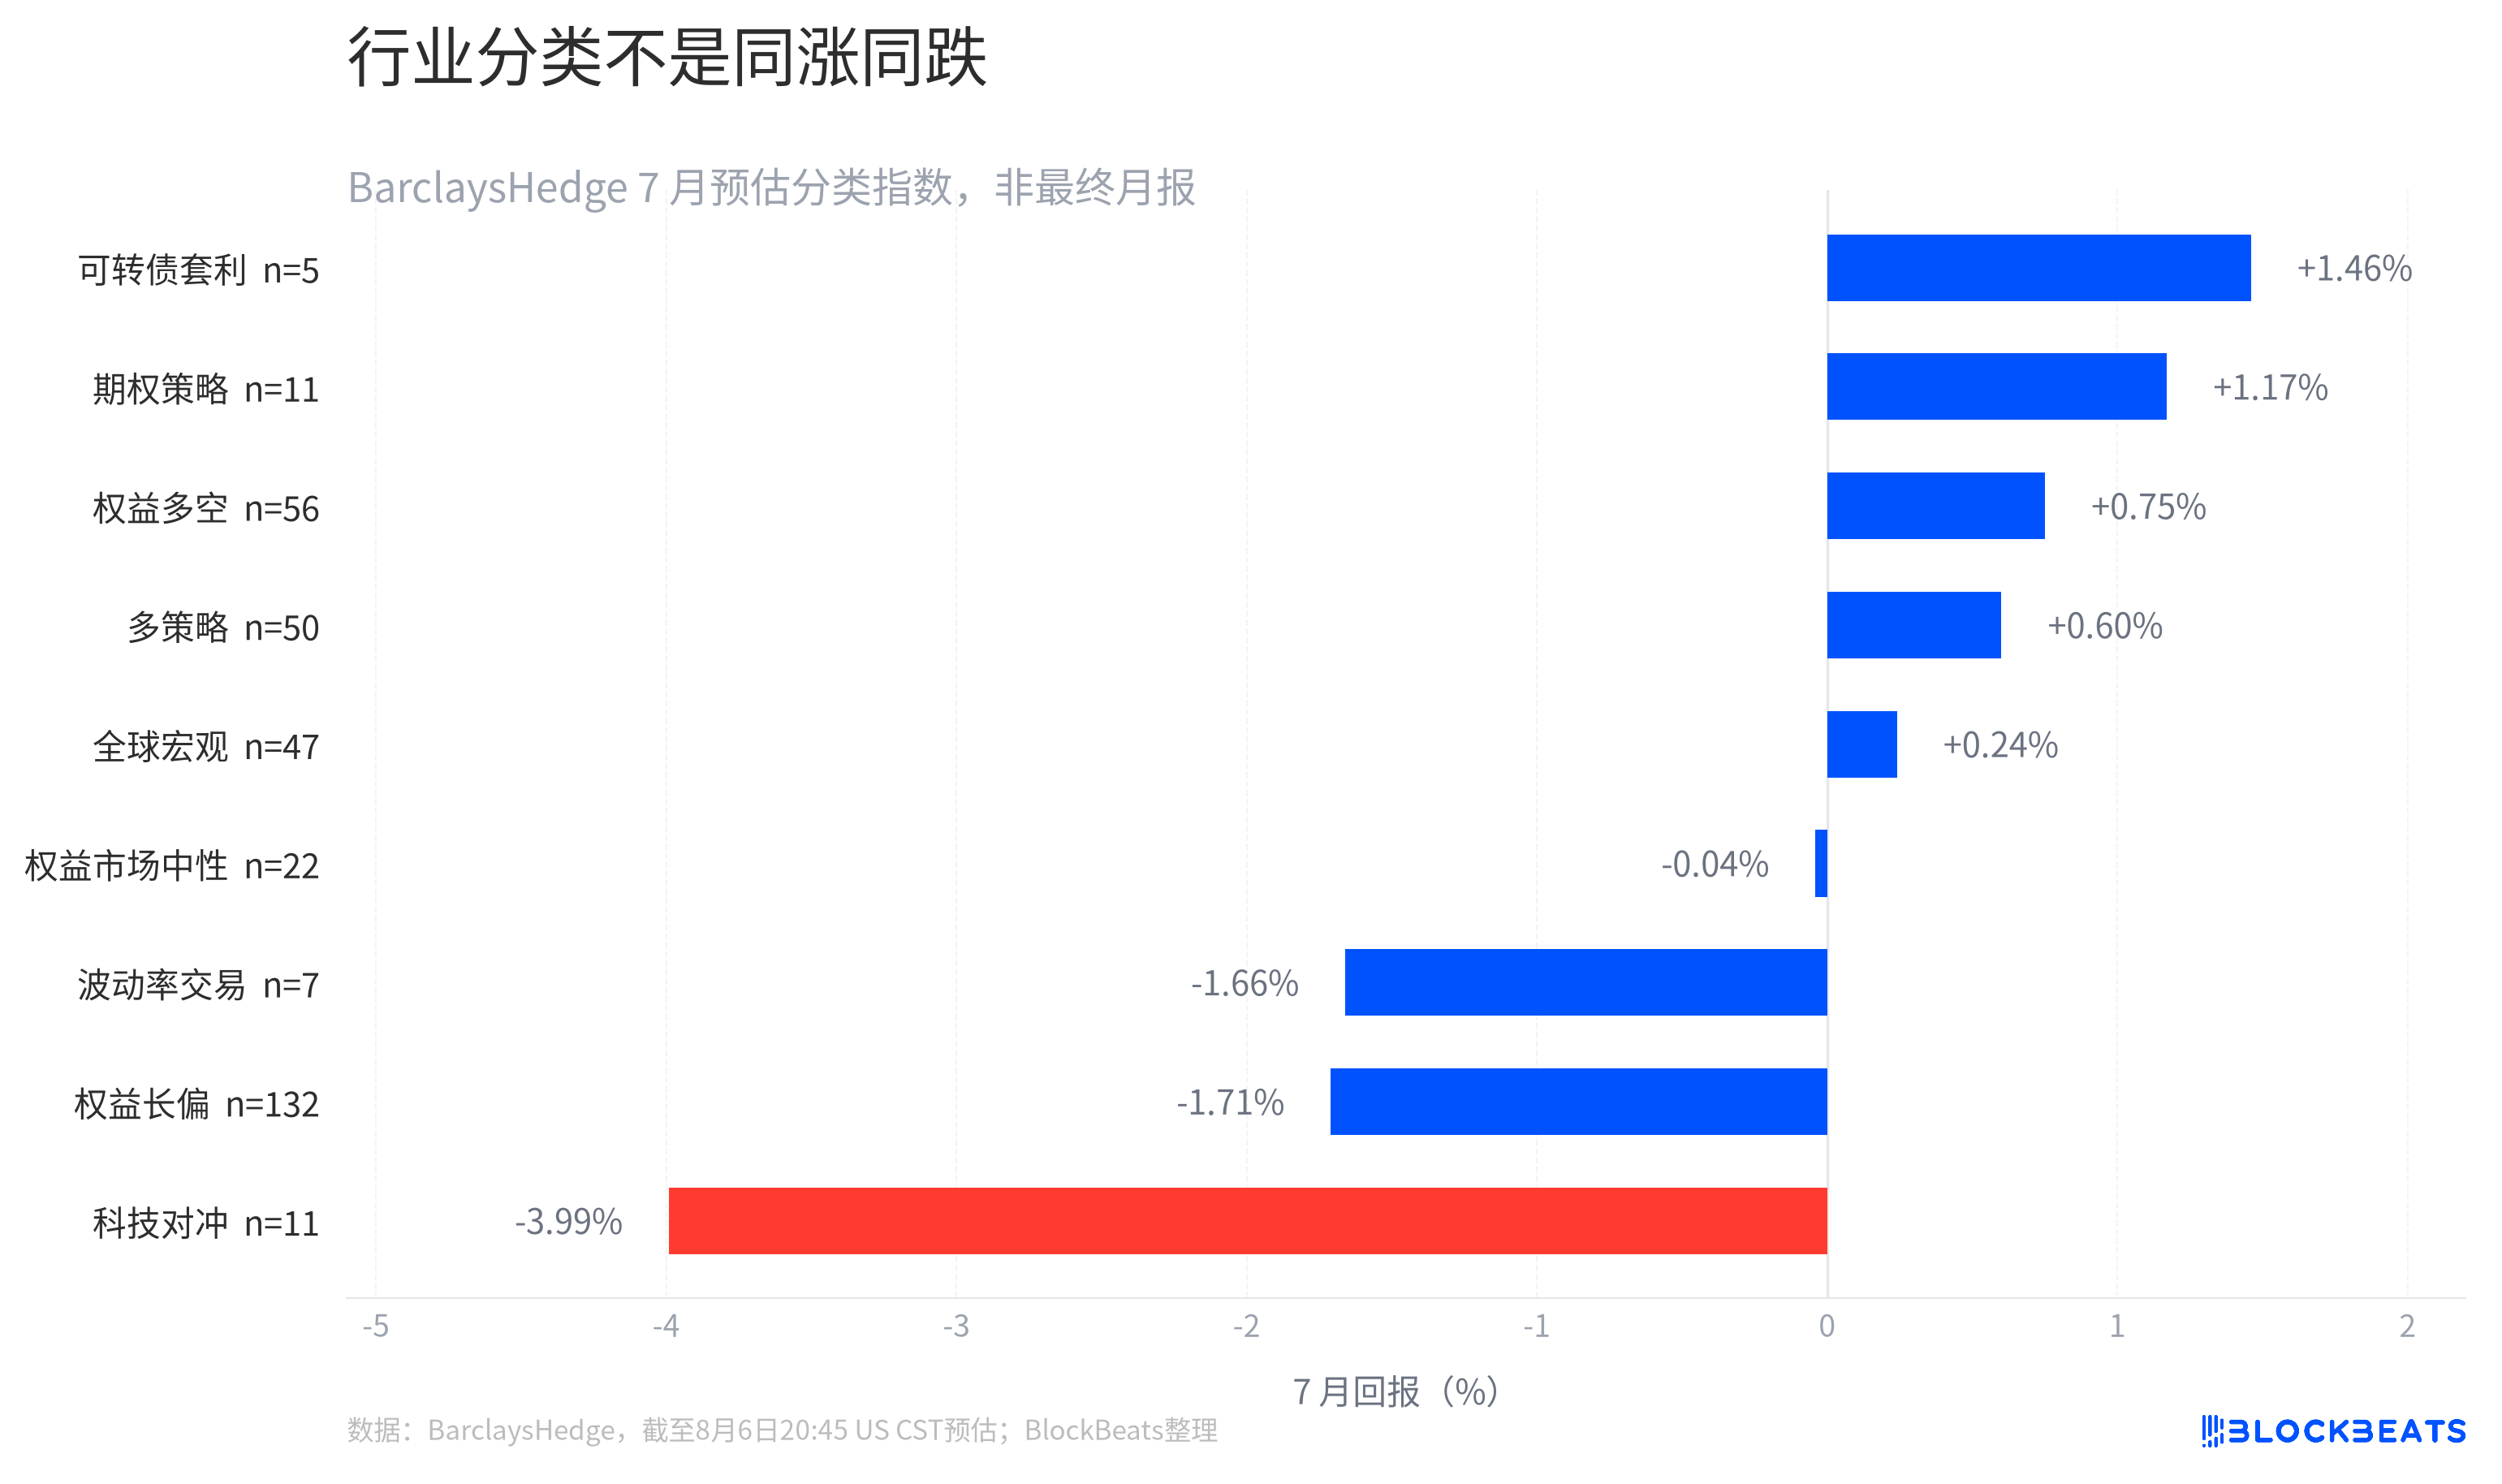
The split did not stop at individual fund returns. Business Insider’s multi-strategy hedge fund scorecard showed most products declining in July. BarclaysHedge, the hedge fund data platform, estimated at the same time that its multi-strategy category index rose 0.60%. Those readings do not cancel each other out. They draw from different samples and use different reporting frameworks.
The figures shown on BarclaysHedge’s page covered only data that had already been submitted at that point, and they could still change as more funds reported later. That makes the index more useful for answering which strategy buckets were under pressure than for attaching a label to any one private fund.
According to BarclaysHedge estimates, the technology hedge category fell 3.99% in July, while convertible arbitrage rose 1.46%. In the same month, categories such as equity long bias and convertible arbitrage posted visibly different results. The table is a reminder that every return number needs to be read inside its strategy label.
That is also why the line that “multi-strategy broadly stalled” needs to be handled with care. Business Insider’s sample had news value. BarclaysHedge’s indexes had a different kind of coverage. Each says something, but only within its own boundary.
July leaders did not necessarily lead for the year
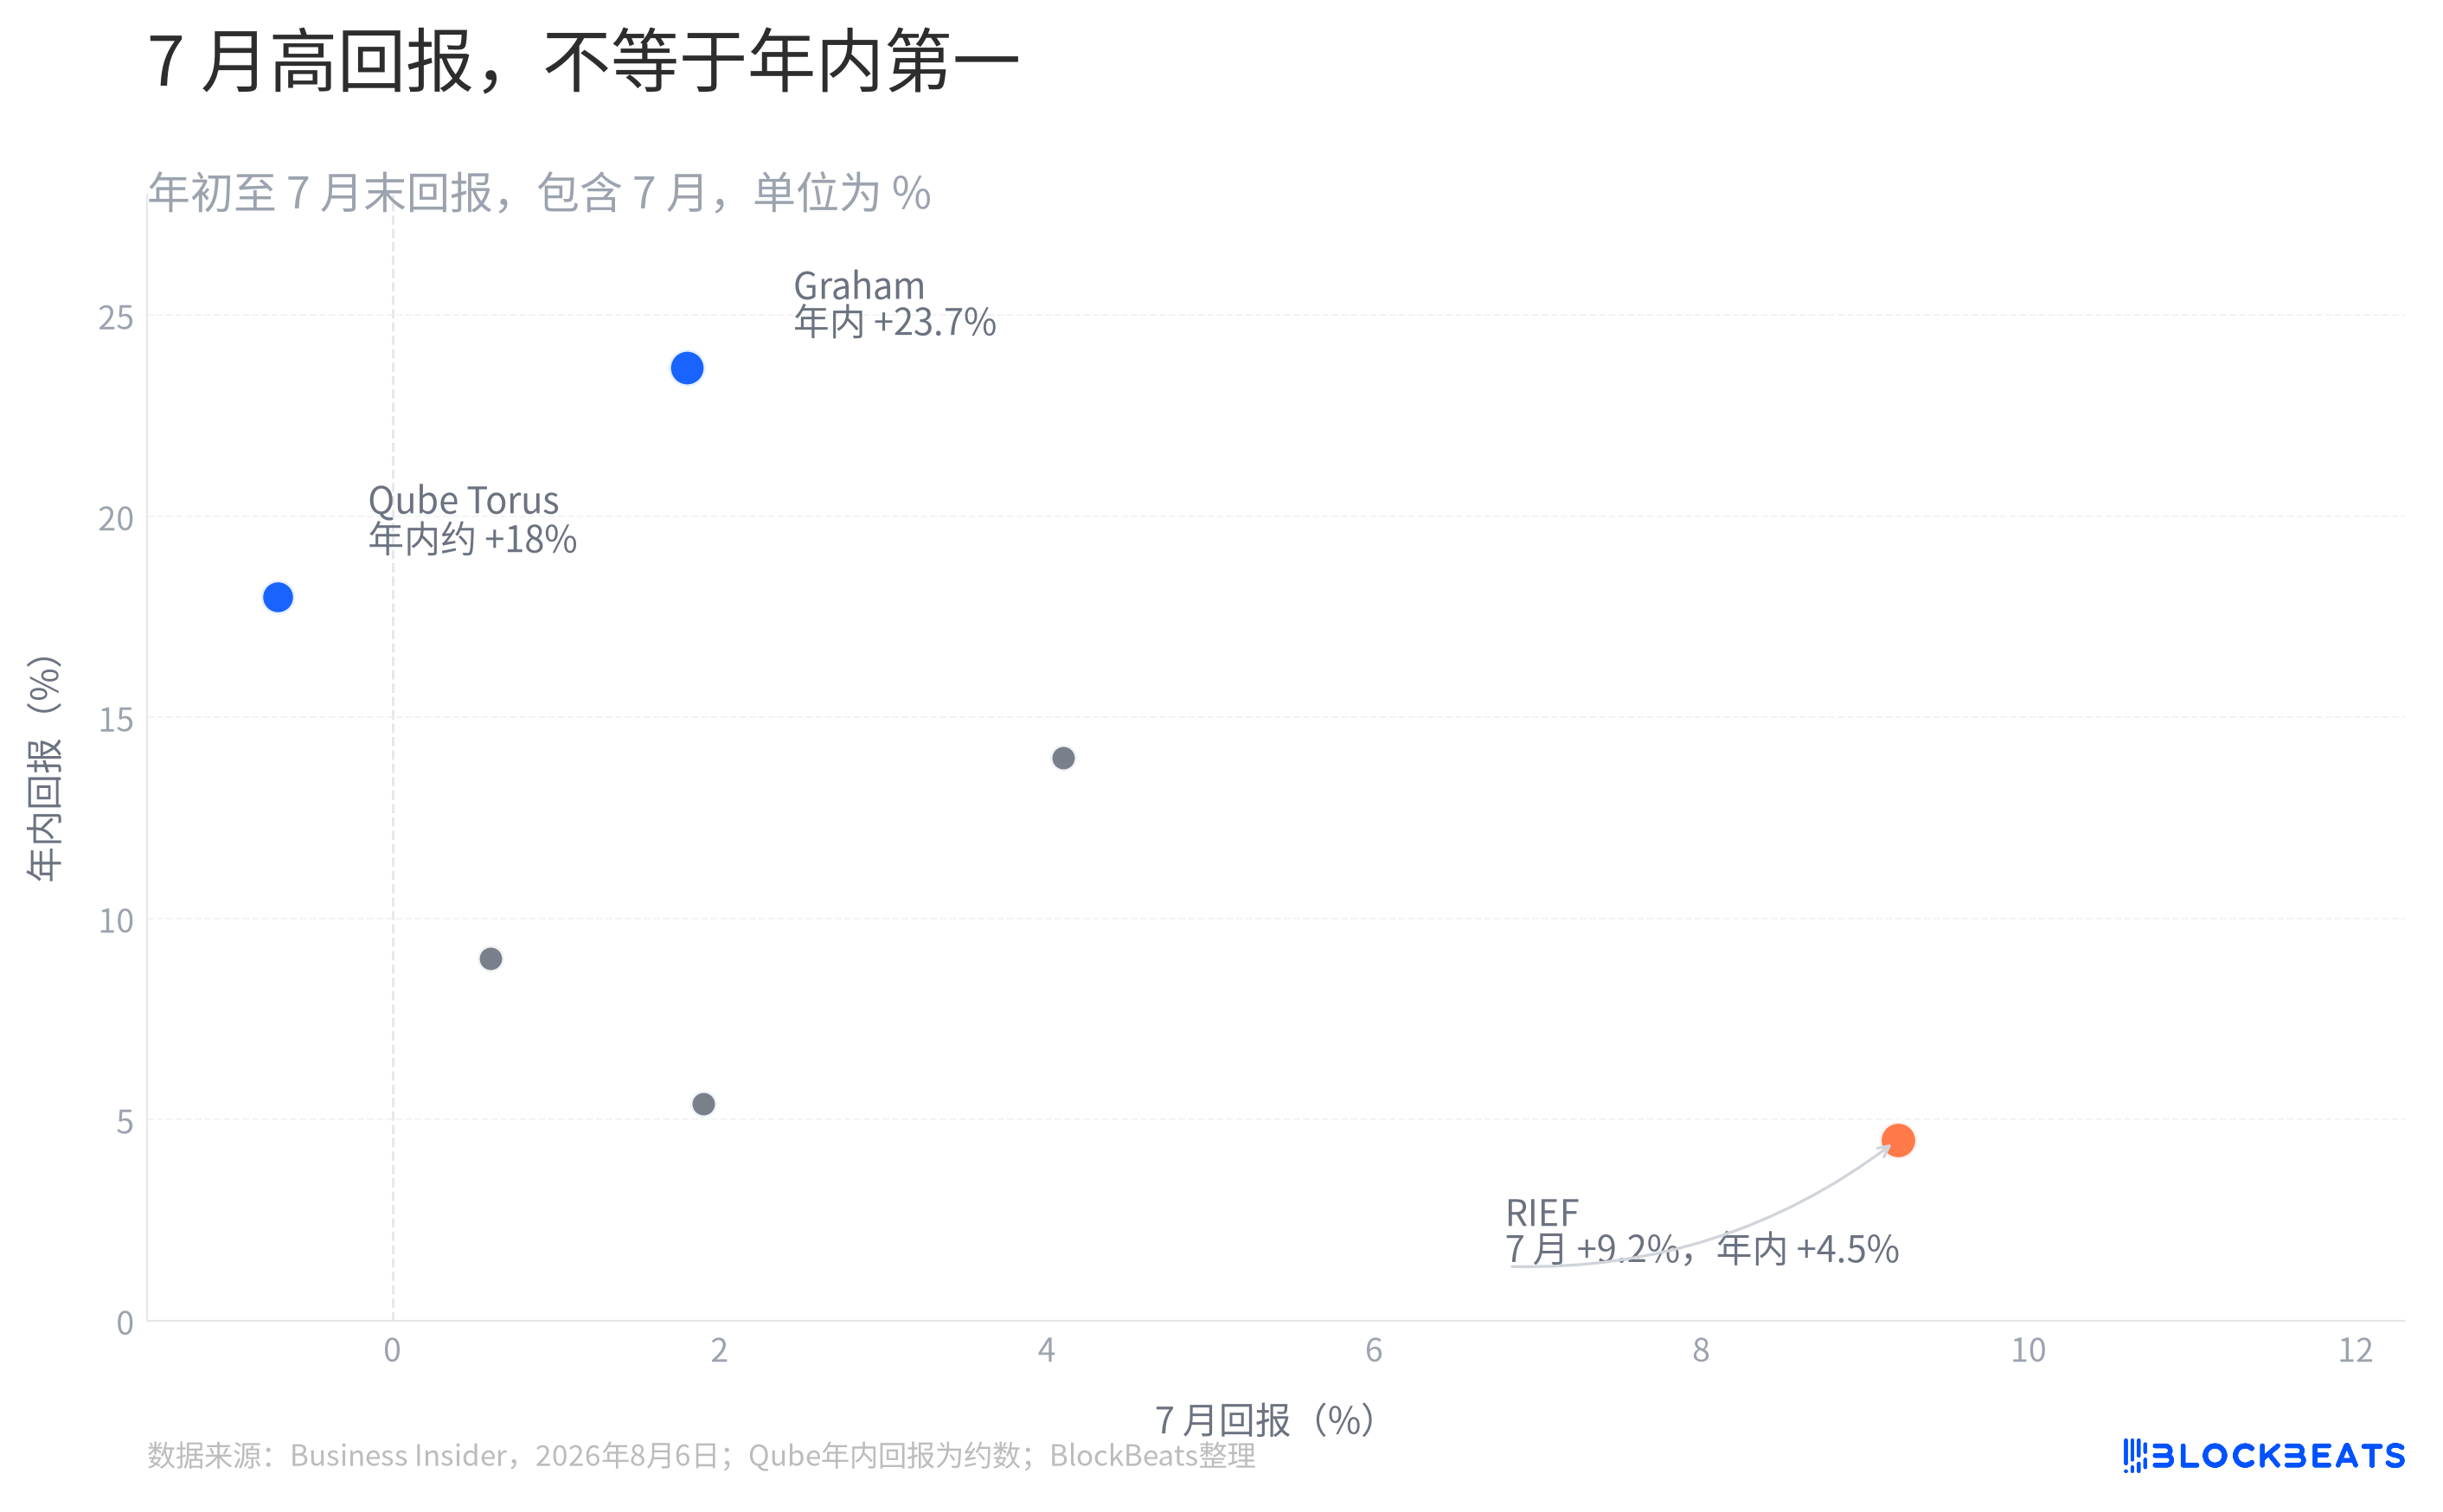
A strong month and a strong year were not always the same thing. Business Insider said RIEF stood out in July, yet its year-to-date return through the end of the month was only 4.5%. The report described the July gain as making up for losses from the prior six months.
The same article said Graham Capital’s Tactical Trend strategy had returned 23.7% for the year, even though its monthly rise was not as eye-catching as RIEF’s. London-based quant firm Qube also showed how monthly and year-to-date rankings can diverge: its Torus strategy fell in July but was still up about 18% for the year. Put single-month rankings beside year-to-date rankings, and the order changes quickly.
That does not mean the two sets of numbers are unrelated. Returns from the start of the year through the end of July already include July. The point is narrower. A monthly leaderboard is a snapshot, and once the time frame expands, both trajectory and ranking can look very different.
The Situational Awareness sale and Citadel’s purchase happened in the same month
Outside the rankings, one asset sale stood out. Reuters reported on July 31 that Situational Awareness sold most of its public stocks after an AI stock retreat and worsening liquidity, and said it had removed leverage from the portfolio. The report did not state as confirmed fact whether the fund had received a formal margin call, so the more careful description is that it was a deleveraging sale carried out under financing pressure.
Reuters then reported on August 5 that Citadel had taken over part of those public positions, with discounts on some of the holdings exceeding 10%. In the same month, according to investor information cited by Reuters, Citadel’s equities-focused fund rose 14.2%.
Those numbers cannot be netted against each other to produce a transaction profit figure. Situational Awareness disclosed a change in portfolio value. The Citadel figure cited by the media referred to the monthly performance of an entire fund. The positions, leverage, and valuation basis were not the same. That footnote matters more than any attempt to frame the trade as a neat arbitrage story.
Read piece by piece, the July return sheet shows something simpler: systematic trading, portfolio direction, and financing structure can all produce very different outcomes inside the same bout of volatility.